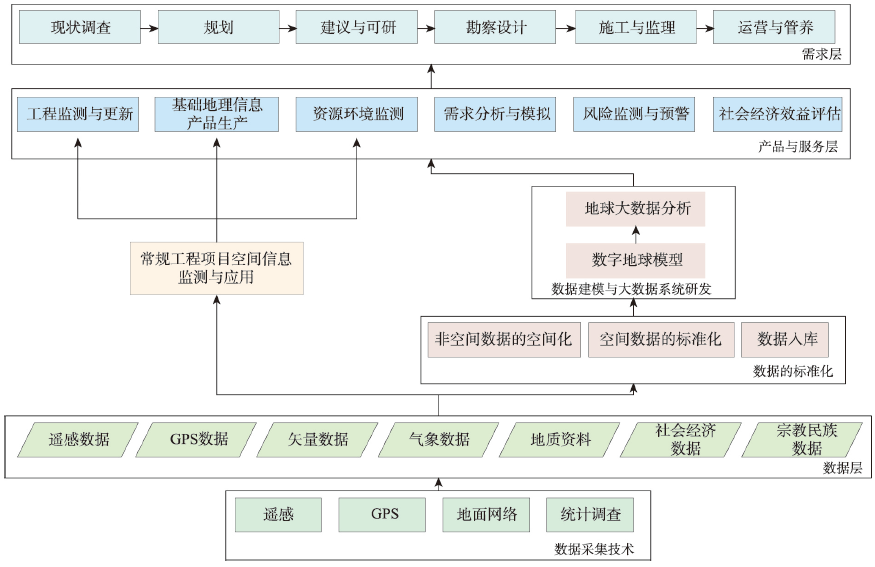
Spatial information is the foundation of project construction. Surveying and mapping, remote sensing, global positioning system, geographic information system, and other spatial information technologies play an important role in supporting the development of the projects to become higher, larger, and safer. With the rapid development of information collection technology, big data technology has promoted all walks of life to a new level. Massive spatial information is promoting the construction of engineering projects to be more intelligent, more scientific, and more environmentally friendly. In the era of big data, how to use big data technology in the construction of engineering projects has become a new research direction in the field of remote sensing monitoring of engineering projects. At the same time, since the "Belt and Road" initiative was proposed, the rapid development of our country's overseas engineering projects has put forward higher requirements on investment decision-making, construction, and operation management of engineering projects. Big earth data technology can provide new technologies, new methods, and new means for the early planning, feasibility study, design, safety risk assessment, construction, operation management, and supervision of overseas engineering projects. Focusing on the theoretical method system and scientific problems of big data monitoring and analysis of engineering projects, and facing the urgent needs of big data analysis technology in the construction of overseas engineering projects of China, this paper systematically expounds the concept, user needs, research contents, main technical methods, and vision objectives of the monitoring and analysis of big data of engineering projects, with a view to providing guidance for future related research work. On this basis, the research progress of the monitoring and analysis of the big earth data of the engineering project is summarized. The research findings are as follows: (1) with the rapid development of spatial information collection technology, more accurate, timely, and rich spatial information can be obtained in engineering construction than ever before. The new research direction of big data monitoring and analysis of engineering project construction came into being. It can promote the development of engineering project construction to be more intelligent, scientific, and environmentally friendly; (2) there is a great demand for the big earth data technology in all aspects of the project, such as the current situation investigation, planning, project survey and design, construction, operation, and supervision; and (3) the research and application of the big earth data technology in projects construction in China is still at the primary stage of specific technical services, and it is difficult to provide support for the investment decision-making of construction projects, especially related researches of overseas projects are still in its infancy. However, due to problems in the construction of overseas projects of China, such as lack of basic data, low level of overall planning and simulation, weak supervision ability, and high risk of cultural and political gap, there is an urgent need to carry out big earth data monitoring and analysis to improve the scientific level of investment decision-making and reduce the risk of overseas investment.
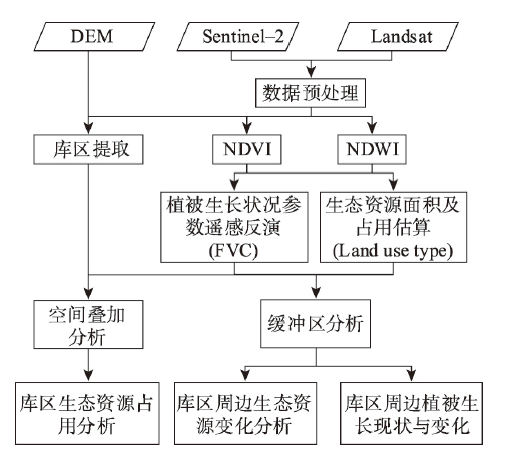
China has advocated a green, low-carbon, recyclable, and sustainable lifestyle for the sustainable development of regions along the green "belt and road". Remote sensing plays an important role in monitoring and evaluating ecological environment. This study focuses on the ecological impacts of hydropower projects in the "belt and road" region supported by China. The ecological impacts of hydropower projects on reservior area, vegetation growth, and ecological resources are analyzed based on decision trees and buffer area analysis methods using Landsat and Sentinel-2 images. In our study, first, the DEM and satellite images are used to obtain reservoir area and storage capacity of each hydropower station. Then, through buffer area analysis, buffer area type and its distance to reservior area of each hydropower station are determined by the area of reservior area, the ratio of reservior area to the smallest circumscribed square, and the average width of reservior area. Decision trees of each buffer area are further built to classify water, forest, grassland, cultivated land, and other land use types based on NDWI and NDVI. The ecological footprint and changes of each land use type before and after the hydropower construction are also analyzed. The Fraction of Vegetation Coverage (FVC) is used to evaluate the status and changes of vegetation growth for each hydropower station. Results reveal that the ecological loss caused by hydropower projects has a positive correlation with the area of reservior area. Generally, the construction of hydropower station has small impact on land use types and vegetation growth of surrounding areas as the annual average variation of land use type and FVC are about 0.35% and 1.27%, respectively. However, there is a significant difference in the lost area of land use types and FVC between hydropower stations. FVC is improved in areas with low FVC after the construction of hydropower station. Furthermore, the hydropower project in areas with low vegetation coverage significantly promotes local ecological environment. During the construction, from design, building to later maintenance of hydropower stations, experts actively take environmental protection measures to reduce reservior area, protect biodiversity, and control ecological risks. Hydropower stations can provide high-quality clean energy and promote local economic and social development.
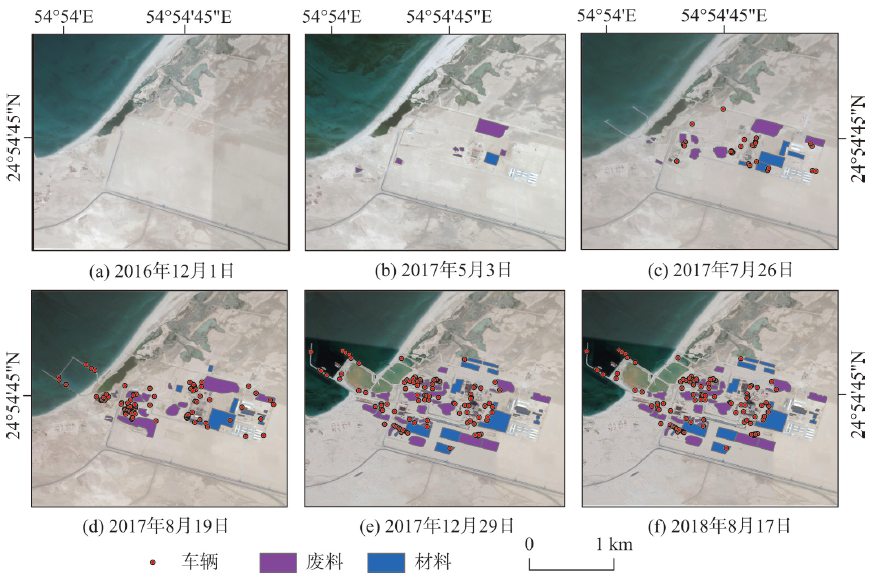
Since the Belt and Road initiative was put forward, Chinese enterprises have invested in and built a large number of infrastructure projects in countries along the Belt and Road region. While promoting the development of local economy, these projects inevitably bring certain impacts on local vegetation, ecology, and environment. However, China mainly adopts the methods of record filing and statistical investigation for supervision, lacking active supervision means for overseas projects. Remote sensing technology can provide new methods and means for the supervision of overseas engineering projects. And it is usually an important problem for the supervision of overseas projects that the ground survey data is difficult to obtain. Aiming at this problem, this paper takes Hassyan Clean Power Station as an example and combines the advantages of Remote Sensing technology (RS) and Geographic Information System (GIS) to propose a remote sensing monitoring method for overseas projects. First, the remote sensing monitoring technology index system is established with ecological environment impact and project construction progress as the main content of monitoring. Then, Based on 2016-2018 Landsat 8 imagery at 30 m resolution and WorldView-2 imagery at 0.5 m resolution, the dimidiate pixel model and the base state amendments model are used to monitor the ecological environment impact and construction progress of the project from five aspects, including vegetation coverage change, ecological space occupation, nature reserve monitoring, infrastructure construction, and appendages change. Finally, this paper analyzes the impact of the project construction on the ecological environment and the progress of the project construction through the comparison of time-series images. The results show that: (1) This method can reflect the influence of the project on the surrounding ecological environment during the construction process and accurately monitor the construction progress of Dubai Hassyan Clean Power Station. This method has important reference significance for the construction supervision of other overseas projects of the Belt and Road Initiative; (2) After the project construction, there is no phenomenon of large-scale vegetation coverage reduction. The vegetation coverage generally changed from low to high; (3) The project construction occupies 1.4780 km2 of sandy land. The reclamation area of the port construction reaches 0.1246 km2, and 0.0604 km2 of wetland is converted into a construction sedimentation pond, without occupying cultivated land; (4) The impact of the project on the Jebel Ali Marine Ecological Reserve is effectively reduced through measures such as the transfer of corals on the sea floor, the installation of anti-fouling curtains, and the reservation of sea turtle spawning channels; (5) Significant progress has been made in the construction of infrastructure and ancillary facilities. The building area has increased by 0.14 km2, and the total number of cofferdams for port construction has reached 3.785 km.
This paper takes Central Asian as study area, including Kazakhstan, Uzbekistan, Turkmenistan, Tajikistan, and Kyrgyzstan. Since the independence of these countries, they have experienced many significant events, such as political and economic reforms, the Russian financial crisis, the global financial crisis, and the fluctuation of international raw material prices. In order to study the socio-economic developments and changes of Central Asia in the past 30 years (1992—2017), based on DMSP/OLS, NPP/VIIRS, and yearbook data, this paper analyzes the spatiotemporal developments and their driving factors using the total Night-time Light (SNL) index, the Night-time Light Growth Rate (PNLG), as well as the socio-economic data. The results show that: (1) Night-time light can better characterize the spatiotemporal changes of the socio-economic development. Also, night-time light is more intuitive and sensitive than the socio-economic parameters such as GDP; (2) The socio-economic reforms in the early period of independence had a large and wide impact on Central Asia. The SNL of Kazakhstan, Uzbekistan, Kyrgyzstan and Tajikistan declined largely. Only the SNL of Turkmenistan increased by 4.5%; (3) Due to differences in basic socio-economic conditions and the richness of natural resources, the gaps of night-time light in Central Asian countries have gradually widened, and the abilities to withstand risks have greatly varied. For example, Kazakhstan, Uzbekistan, and Turkmenistan are rich in natural resources, especially oil and gas, while Tajikistan and Kyrgyzstan have few natural resources. When the 2008 global financial crisis occurred, Kazakhstan was least affected (PNLG= -3.6%) while Tajikistan was most affected (PNLG = -36.4%); (4) Central Asian countries are susceptible to the impact of international energy market prices, especially the increase of oil and gas prices. The sharp rise in the price of international raw materials market in 2000, especially the price of oil and gas, had led to a sharp rise in SNL and a quick rebound in economy of Central Asian countries. However, the decline of international oil and gas prices in 2015 hammered the development of Central Asian countries who heavily relied on the exports of oil and gas. Based on the nighttime light images from 1992 to 2017, this paper studies the spatiotemporal characteristics of socio-economic development in Central Asian countries in nearly 30 years since the independence, and then explores the driving factors. This study can provide decision-making reference for the security guarantee of Central Asia and the implementation of the Belt and Road Initiative.
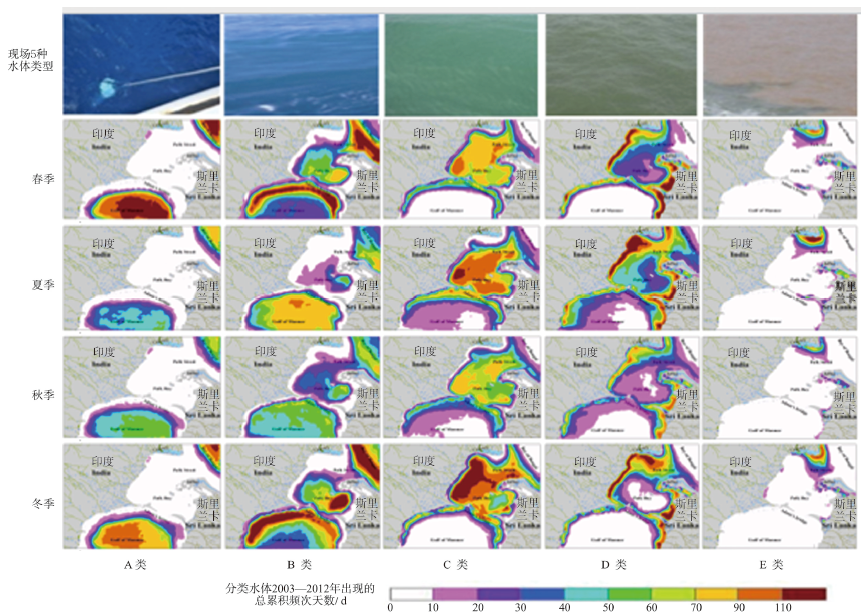
:Sri Lanka is an important node country along China's Maritime Silk Road. The changes in the ecological environment of its surrounding sea areas are closely related to its economic development, leisure life and dietary safety. This study analyzed Sri Lanka's surrounding waters and Colombo as a key node port from 2002 to 2017 using MODIS remote sensing products to characterize the interannual variations of ecological environment parameters. The MERIS remote sensing reflectance products were used to analyze the spatial and temporal characteristics of water bodies in the Palk Strait (2003-2012). Conclusions can be made as the following statements: (1) Within the study area, photosynthetically active radiation was observed higher value in Gulf of Mannar. The biomass of phytoplankton is relatively high in the coastal areas and inversely related to the sea surface temperature, while that in the open sea is extremely low and inversely related to seawater transparency.(2) In Colombo Port, the maximum values month of sea surface temperature, light intensity (photosynthetically active radiation), water cleanliness (seawater transparency), phytoplankton biomass and net primary phytoplankton productivity appear in April, March, March, August and July respectively, and the red tide, as a potential disaster causing factor, needs to be concerned in August.(3) The sources of the turbidity zone in the Palk Strait were the large amounts of sediment carried by the Cauvery River from Calimere cape of India. The distribution characteristics and long-term changing trends were analyzed, which provided a better understanding of the high temporal and spatial variations in the marine ecological environment of the Palk Strait and the surrounding waters of Sri Lanka in different time and space.
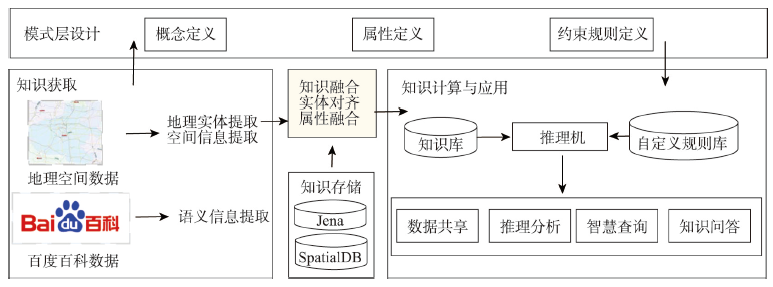
Knowledge graph is widely applied in the field of artificial intelligence. Fusing multisource geospatial data is a hot topic for the transformation of “data-knowledge”. However, the general knowledge graph has low spatial knowledge and some of them is incorrect. Moreover, geographic knowledge graph from Wikipedia has some problems such as missing spatial relation, Chinese attribute, and exact coordinates information. In this paper, we analyze the characteristics of geospatial data and baidubaike.In addition, we propose a knowledge graph construction method based on geographic entities which are extracted from geospatial data and supplemented by attribute information from baidubaike.At the end, the scale of knowledge graph is analyzed in terms of entities and relations. The experiment proves that the conceptual description information of geographic entities is expanded, and there is a higher success rate of linking web page with geographic entities than ever. In addition, the coverage of geographic coordinates is increased to 100%. The knowledge graph constructed in this paper will have an important significance to extend geospatialdata to knowledge.
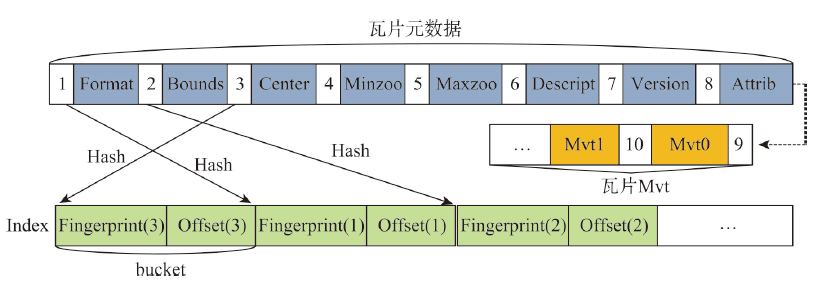
With the deepening of the information technology, Internet maps containing multi-source geospatial information are widely used in many fields such as forestry, ocean, land, transportation, and military. At the same time, due to the advancement of Earth observation, surveying, and mapping technology, spatial data with high precision and wide coverage has grown rapidly, leading to an era of geospatial big data. Under this background, how to quickly and efficiently construct Internet map services becomes the current research priorities and challenges. Grid tiles has been used to construct Internet maps at the beginning, and played an important role in the fast-growing popularity of Internet maps. However, with the mobilization of maps and the gradual deepening of applications, the disadvantages of large size and low efficiency of applying grid tiles are becoming more and more obvious, which is difficult to meet the needs of applications. Vector tiles have many advantages over traditional grid tiles, such as small in size, high in generation efficiency, and support dynamic interaction, are becoming the focus of next generation Internet map service research. In order to further accelerate the processing speed and enhance the scalability in current vector tile application, this study uses big data technology for vector tile processing. Firstly, we uses the parallel computing framework-Spark, to build the vector tile pyramid model. Specifically, through customizing the Spark conversion function, the steps of tile generation are parallelized, and the original vector data GeoJson is converted into a vector tile set-MapBox Vector Tile (Mvt). Then we designs a tile storage model-VectorTile Store, to store the generated Mvt based on the distributed memory filesystem-Alluxio. The VectorTile Store model stores data with key-value pairs, with the tile metadata occupying the first eight key-value pairs, and each single tile occupying a key-value pair. When the data is being written, a hash index is built based on the key for fast access. This model efficiently stores massive tiles and is highly scalable. The experimental results show that the vector tile parallel construction algorithm and distributed storage model proposed in this paper are more efficient than traditional schemes, and are more suitable for massive vector tile data processing.
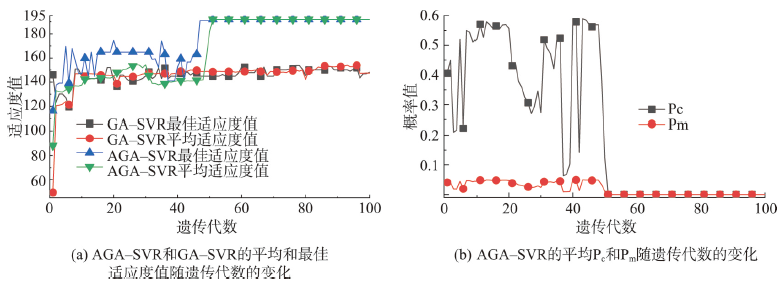
The selection of feature subset and the optimization of model parameters plays an important role in improving the accuracy of soil salinization monitoring. However, machine learning algorithm combined with other data such as remote sensing images to predict Soil Salt Content (SSC) pays little attention to the optimization of feature subset and model parameters. In this paper, the Support Vector Regression (SVR) algorithm with synchronous optimized feature subset and model parameters using the Adaptive Genetic Algorithm (AGA) was developed to retrieve the SSC of Sangong River Basin in 2016, and the distributions of SSC in different land use types were analyzed. The synchronous optimization of feature subset and model parameters, and the comparative experimental design were conducted as follows. First, a total of 40 salinization-related factors of 7 categories(Vegetation indices, Salinity indices, Underlying surface Reflection factor, Feature spaces, Tasselled Cap transformation factors, Surface reflectance, Topographic factors) were extracted from Landsat 8 OLI and SRTM Digital Elevation Model(DEM) data, and the Candidate Feature Variables (CFVs) were initially selected by correlation analysis using significance (p<0.05) as standard. Then the CFVs were introduced into AGA, Genetic Algorithm(GA), Grid Search (GS) to synchronous optimize the feature subset and model parameters of SVR, and the different salinization monitoring models (AGA-SVR, GA-SVR, GS-SVR) were established, respectively. The results show that the performance of different salinization monitoring models occurred in the order of AGA-SVR> GA-SVR > GS-SVR. Comparing with GS-SVR, the GA-SVR and AGA-SVR improved the accuracy of salinization monitoring obviously, while the R2/RMSE of AGA-SVR increased by 44.65%. In terms of the different types of salinized soil, the proportion of non-salinized soil, slightly salinized soil, moderately salinized soil, severely salinized soil, saline soil in Sangong River Basin was 42.83%, 11.02%, 15.88%, 9.22%, 21.05%, respectively. In terms of the distribution of SSC in different land use types, the unused land and grassland were mainly comprised of non-salinized soil and saline soil, while the distribution proportion of non-salinized soil were the largest in farmland and forest land. Moreover, the mean and standard deviation of SSC of different land use types were in the order of unused land > grassland >farmland > forest land. To some extent, the preferred method of feature subset selection and model parameters optimization in this paper can improve the accuracy of salinization monitoring.
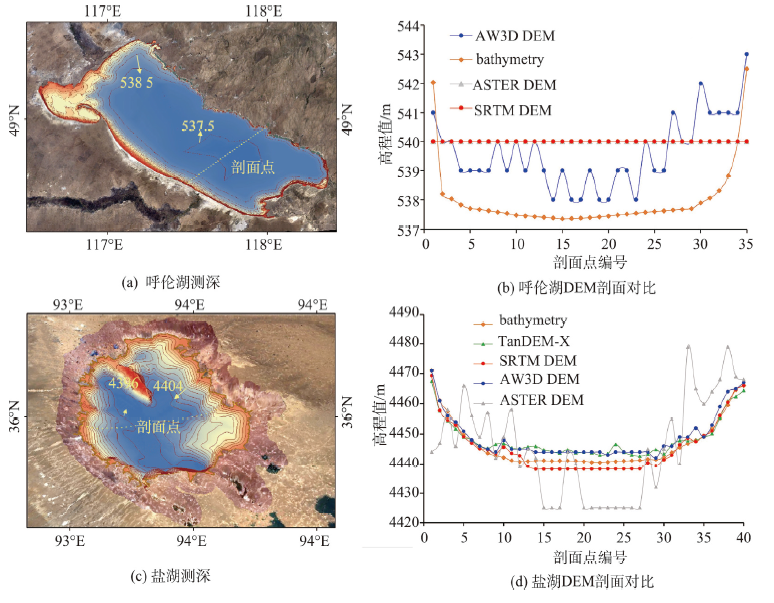
:The dynamics of lake hydrology is not only an important indicator for assessing and predicting climate change, but also poses important impacts on the sustainable development of regional society, the utilization of water resources, and the construction of ecological civilization. The changes of lakes are controlled by the topography of lakeside and underwater bathymetry. Hence, the topographic information is essential to quantify the lake variations. With the development of remote sensing technology, the methods for high-resolution data acquisition at large scale have been improved largely. Currently, DEM has been widely used in the studies of lake hydrology. This study collected the related literatures based on Web of Science platform, with a quantitative analysis in terms of published time, study area and adopted datasets. Then, the research literature can be categorized in four main fields including: Lake water extent change, lake water level change, lake water volume change and lake hydrological disaster. To take full advantages of DEM, three aspects of efforts should be further paid, specifically in (1) integrating DEM with multiple other sources including remote sensing images, satellite altimetry and hydrological observations, (2) developing state-of-artdata fusion strategy by integrating digital terrain analysis and hydrological analysis, and (3) improving the performances of DEM data in resolution and accuracy for lake hydrology study. Finally, this paper discusses the key problems of DEM in lake hydrology research, and puts forward possible solutions and research prospective based on the development trend of technology and hot issues.
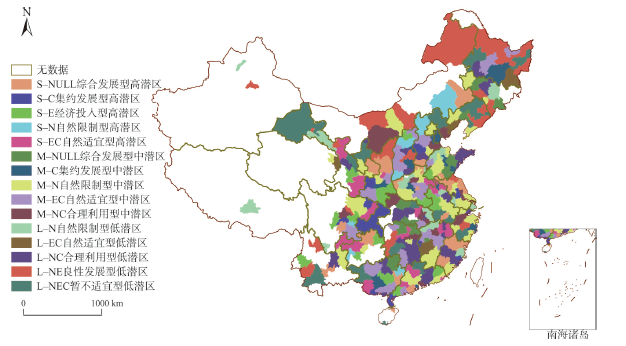
Land consolidation in urban regions is important for promoting the functional operation of urban land systems and the harmonious coexistence of urban components. To date, studies on urban land consolidation potential and zoning have largely failed to establish a comprehensive index system from the urban perspective. In this paper, based on the demand of urban land consolidation, we used the research framework of "potential assessment-classification-problem identification-optimization pathway." Using hotspot analysis, hierarchical judgment, and other research methods, we evaluated comprehensively the potential of land consolidation in the 289 cities of China, identified zone-specific problems, and proposed improved management strategies. The results show that: (1) The difference of land consolidation potential between different cities is remarkable, the ratio of cities with high consolidation potential and low consolidation potential is low, while the ratio of medium consolidation potential is the highest. There are significant regional differences and agglomeration characteristics regarding the level of urban consolidation potential in China. (2) Based on the decision classification judgment between the three factor layers and between the factor layers and the potential classification, fifteen urban land consolidation types were defined, including S-NULL comprehensive development high-potential consolidation area, M-N naturally restricted medium-potential consolidation area, L-NE benign development low-potential consolidation area, and L-NEC temporarily unsuitable low-potential consolidation area, etc. (3) According to the constraints of various zone types, the problem identification by region was mainly divided into eight types, including the comprehensive development type, intensive development type, economic investment type, natural constraint type, natural applicable type, rational use type, benign development type, and temporary inappropriate type. Based on the identification of zone-specifric problems in urban land remediation, the goal of urban land remediation was clarified, and the improvement pathways of regional goal orientation were proposed according to local conditions. The research methods and the findings can be used as a theoretical reference for urban land consolidation of China.
To serve as a basis for atmospheric environmental quality monitoring and pollution prevention & control in Hainan, which located in a specific geographical position with great strategic significance and national development potentiality, it is imperative to reveal the spatiotemporal dynamics patterns of aerosol over Hainan Island and clarify the sources of atmospheric pollutants. Hence, this study aims to investigate the spatiotemporal dynamics characteristics of the Aerosol Optical Depth (AOD) over Hainan Island by using the MODIS 3 km spatial resolution data (i.e., MOD04_3K product) from 2003 to 2017. Then, we calculated the 48-h backward trajectories at three above ground levels (10, 500, and 1000 m) of eight typical air pollution events in Haikou city, the capital and largest city of Hainan Province and the starting point to trace the sources of air pollutants in the region, by using the Hybrid Single Particle Lagrangian Integrated Trajectory(HYSPLIT) model. The results indicated that: (1) The average values of AODs during 2003-2017 over Hainan Island region exhibited a notable three-stage stepped-down spatial distribution from northwest to southeast, each of which displayed some distinctly spatial variations. (2) During the fifteen-year period, a slight increase tendency of the annual mean values of AODs was noted with their total mean value of 0.095 over Hainan Island, and the seasonal mean values of AODs were characterized with “spring > autumn > winter > summer”, the reasons for which could be derived from the common influences of regional weather systems and local winds, as well as the atmospheric pollutant emissions caused by tourism development. (3) In addition, during periods of typical atmospheric pollution events in Hainan Island (Haikou) from 2013 to 2017, the backward trajectories of air pollutants at three ground levels (10, 500, and 1000m) were primarily from the northeast direction of Hainan Island. Thus, the air pollutants originated from the mainland in the northeast direction such as the Pearl River Delta region were brought to Hainan Island along land tracks or coastal belts by the prevailing northeast winds; the plausible explanation of this could be that the atmospheric pollution events in Haikou occurred because of the joint effects of regional weather (e.g., continental cold high pressure) and local weather (e.g., sea-breeze convergence) systems. Perhaps, findings of this study could contribute to the understanding and assessing dynamic changes of the atmospheric environmental quality situation over decade in Hainan Island region and provide useful references for the establishment of joint prevention and control mechanism for air pollution.
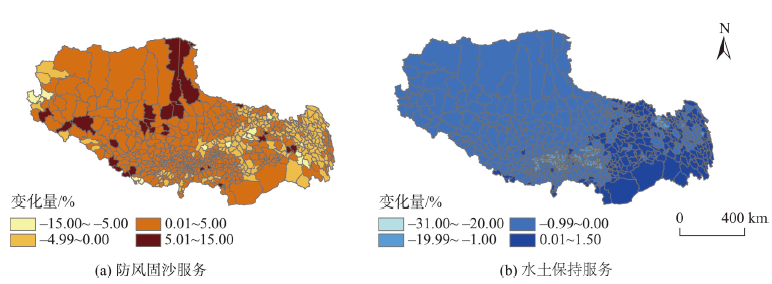
The alpine ecosystem of the Tibet autonomous region is extremely fragile and highly sensitive to climate change and human activities. In recent years, the government implemented several conservation policies, aiming to simultaneously conserve the degraded ecosystem and guarantee the livelihood of local residents. These policies include grassland ecological compensation policy, settlement of nomads, and relocation of poor people from inhospitable areas. Human activity intensity varied temporally and spatially during the implementation of those polices, which can be reflected by land use transition and population migration. Therefore, quantitative assessment of the response of grassland ecosystem services to land use and human activity changes can help with the adjustment and improvement of Tibet's ecological policies and spatial planning. We used GIS spatial analysis to analyze the changes of residential land and night light intensity of Tibet, based on the land use maps of 1980 and 2015 and DMSP/OLS night light index data from 1992 to 2013. The influence of changes in human activity intensity (i.e., as reflected by the change of residential land and night light) on soil and water conservation and sand-fixing services in the ecosystem of Tibet was studied by correlation analysis. Results show that:(1) From 1980 to 2015, the newly constructed residential land in Tibet was 212.06 km2, of which 62% was urban. Residential areas shrunk by 44.99 km2, of which 95.88% were rural. The changes of residential land mainly occurred in the south Tibetan valley. (2) The expansion of land use in residential areas directly led to the increase of light intensity at night to a certain extent. Land consolidation projects in the Yarlung Zangbo River and its two tributary basins and the project of peasant and herdsman's safe housing promoted the intensity of local human activities, while some townships in the region reduced the intensity of local human activities due to migration and poverty alleviation. (3) The sand-fixing service in Tibet increased from 1990 to 2015, and the soil and water conservation service showed a notable degradation trend except for the high mountains and valleys in eastern Tibet. (4) There was a positive correlation between sand-fixing service and the reduced amount of land in residential areas, while there was a negative correlation between soil and water conservation service and the increased amount of land in residential areas, the reduced amount of trees in residential areas, and the trend value of night light index. Human activities such as reforestation and grassland restoration contributed to the sand-fixing services, and the increase of human activity intensity could easily cause degradation of soil and water conservation services, especially in the Yarlung Zangbo River and its two tributary basin areas. Our findings could help improve Tibet's spatial planning and ecological policies.
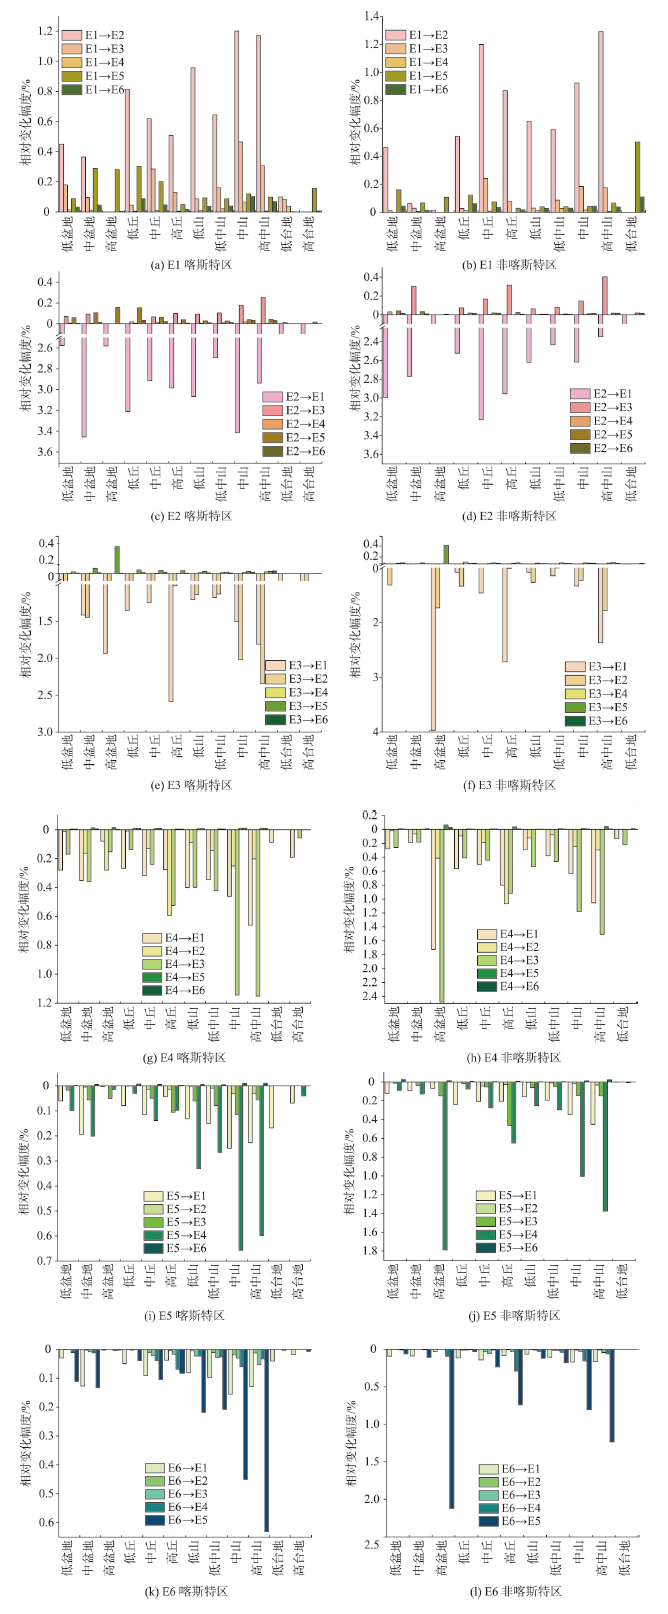
Quantifying the changes of soil erosion intensity across different geomorphological types is one of the key issues that need to be explored in the field of soil and water conservation, especially for the karst region where the ecological environment is relatively fragile. According to different classification criteria of soil erosion intensity in karst and non-karst areas of China, we generated the spatially explicit soil erosion data at a resolution of 10 m×10 m in Guizhou Province combining multi-resolution remote sensing data, i.e. ALOS, ZY-3, GF-1, Landsat, and GDEMV2, and 2762 field samples in 2010 and 2015. We analyzed the spatial-temporal changes of soil erosion intensity in karst and non-karst area of Guizhou Province based on the spatial distribution of soil erosion estimates and the geomorphological type data of Guizhou Province. The results show that soil erosion intensity showed a decreasing trend with the total area of soil erosion decreased by 6468.13 km 2 in Guizhou Province from 2010 to 2015. The total area of decreasing soil erosion intensity in karst area was larger than that in non-karst area, while the decreasing amplitude of soil erosion intensity in extremely intense and severe erosion karst area was smaller than that in non-karst area, which indicated a higher difficulty of soil erosion restoration in extremely intense and severe erosion area in karst area. Moreover, the decrease of soil erosion intensity in high-altitude areas was larger than that in the low-altitude areas. The decreasing soil erosion intensity in high basins, middle mountains, and high mountains was more obvious than that of other geomorphological types, though high mountains in karst and non-karst areas were still the obvious areas of increasing soil erosion. In our study, the larger decrease in soil erosion intensity in karst area than non-karst area might be due to the ecological restoration projects and water soil conservation polices carried out in karst area, especially in the western of Guizhou Province during 2010-2015. In future, the soil erosion in non-karst area should also be paid attention by local government.
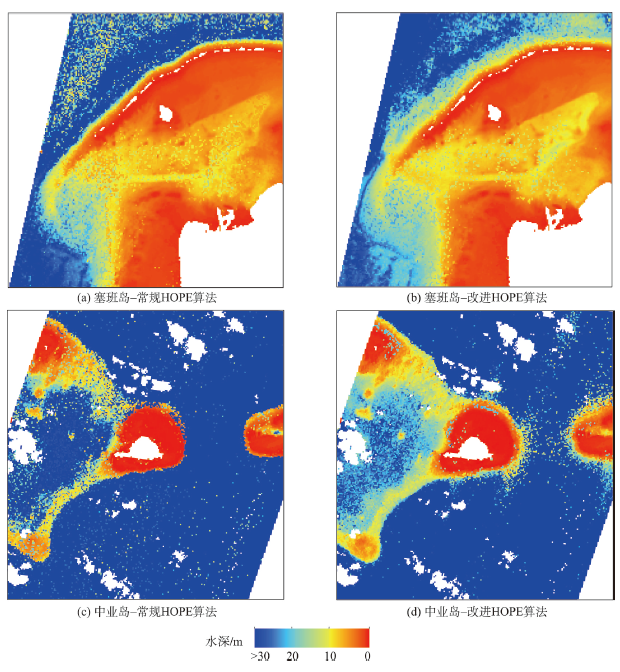
Shallow water depth estimation with remote sensing images can provide significant reference values in navigation, construction of reef islands, and investigation of coral reef ecosystems. It is a convenient, time-saving, and non-contact way to detect the depth of shallow water areas. With a growing number of hyperspectral satellites, many shallow water depth estimation algorithms using satellite hyperspectral images have been proposed. One of the mostly used is the Hyperspectral Optimization Process Exemplar (HOPE) algorithm.The algorithm is implemented by searching for the unknown parameters of the Semi-Analytic Radiative Transfer Model, including water depths, water optical properties,and the bottom albedo with a nonlinear optimization approach. However, the HOPE algorithm tends to overestimate water depths for areas with low remote sensing reflectance. To help address thisproblem, we proposed an improved HOPE algorithm based on Hyperion satellite hyperspectral images. The improved HOPE algorithm makes use of the characteristic that the properties of the water column are homogeneous: (1) According to the Semi-Analytic Radiative Transfer Model, the remote sensing reflectance of the optical deep water only depends on the optical properties of the water column, thus the HOPE algorithm is simplified to only estimate the optical properties of the water column with the remote sensing reflectance observations of the deep water; (2) The estimated optical properties are then used as the optical properties of the water column of the entire study area so that the shallow water depths can be easily estimated by solving the Semi-Analytic Radiative Transfer Model with only the water depth and the bottom albedo unknown. The purpose is to reduce the number of the unknowns in the traditional HOPE algorithm and to mitigate the overestimation problem. The improved HOPE algorithm was validated by comparison with the traditional HOPE algorithm based on the Hyperion hyperspectral images of two study sites: Saipan Island and Zhongye Island. For the areas with low average remote reflectance, i.e. 0~0.0075sr-1 for Saipan Island and 0~0.001 sr-1for Zhongye Island, the mean absolute errors in water depth estimation achieved by the traditional algorithm were2.94m and 6.44 m, respectively. The errors were reduced to 2.56 m and 4.99 m by using the proposed algorithm. As a result, the Root Mean Square Error (RMSE) and the Mean Relative Error (MRE) were reduced from 3.18 m and 32.4% to 2.30 m and 30.6% for Saipan Island; and from 5.39 m and 27.1% to 3.32 m and 23.9% for Zhongye Island. Our findings suggest that the improved HOPE algorithm is feasible and effective in improving the accuracy of the shallow water depth estimation and has good potentialfor future applications.
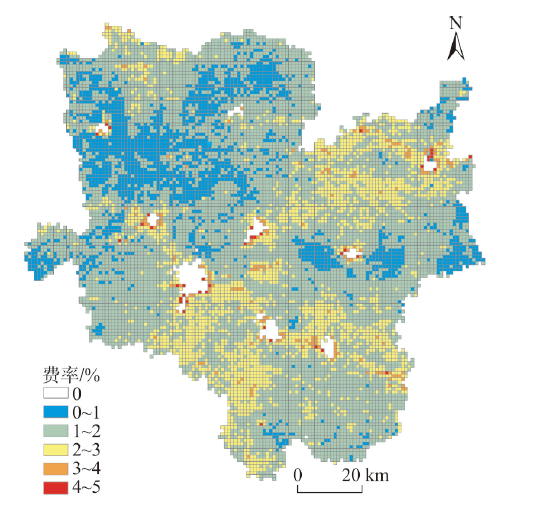
Crop insurance is an important measure to reduce farmers' economic loss caused by disasters and to guarantee farmers' basic income of agricultural production. Traditionally, the rate-making of crop insurance is usually based on statistical data collected at administrative level without considering the differences in risk between farms within each administrative unit. Hence, how to obtain the pure premium rate of crop insurance for land parcels within each administrative unit is critical in precision crop insurance. In this study, we calculated the pure premium rate of winter wheat at the farm level in Zhoukou city, Henan, China, based on remote sensing data and insurance actuarial model. We first extracted the GPP data in the growing season from 2005 to 2015 using Moderate Resolution Imaging Spectroradiometer(MODIS) GPP product(MOD17A2) and the administrative boundary of Zhoukou city. We then generated the ratios of winter wheat area in the pre-winter periods from 2004 to 2014 in Zhoukou city at 1 km spatial resolution using Landsat TM/ETM/OLI data. The guaranteed GPP was estimated based on the Bühlmann-Straub reliability model and the real GPP estimates. Second, we calculated the GPP loss rate using the guaranteed GPP and real GPP estimates. Finally, we used the empirical rate method to set the pure insurance premium rate for winter wheat in each land parcel. Our results showed a map of winter wheat pure premium insurance rate at fine scale for Zhoukou city. Compared to the insurance rate calculated using administrative-level statistical data, the insurance rates calculated using remote sensing data were more precision. The fine-scale pure insurance rate map provides an important reference for farm-level winter wheat insurance pricing, making the pricing of crop insurance more reasonable. Our study highlights the integration of remote sensing in determination of crop insurance rates and improvement on the spatial fineness of crop insurance, which could further promote the commercial development of precision crop insurance. Government can hence formulate appropriate crop insurance policies for different farmers, while insurance companies can charge premiums reasonably.