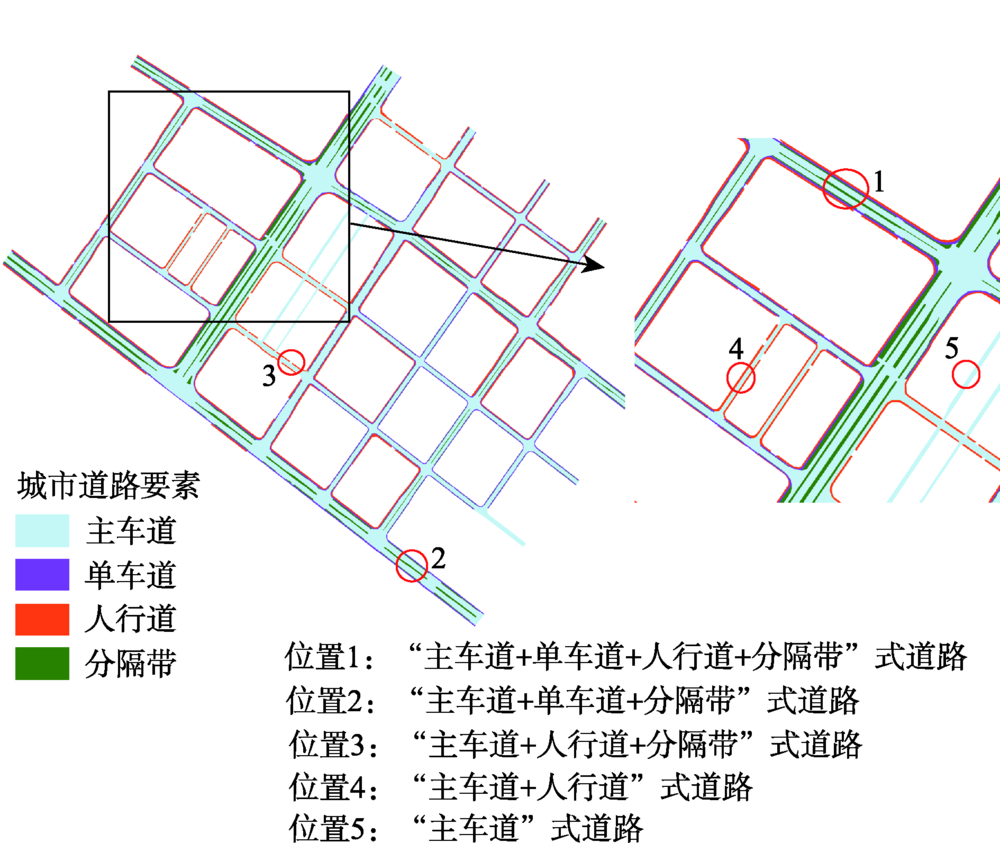
The Digital Elevation Model (DEM) is one of the most important basic geographic information data of a city. Urban road DEM modeling is an important part of urban DEM construction, while road classification is an important foundation and prerequisite of urban road DEM modeling. However, the existing urban road classification methods have a certain degree of distortion in expression of urban road surface. They cannot accurately reflect the planar morphological characteristics of the road, making it difficult to meet the needs of future surface processes simulation. In view of this problem, based on the composition of urban roads, this paper analyzed the characteristics of urban road morphology from the perspective of DEM modeling. An urban road classification method that takes into account the road morphology was proposed to address the shortcomings of existing road classification methods. Based on this, the DEM of urban roads was further explored. In our paper, we selected a subset of Nanjing as the experimental area and used DLG data was as the data source, to further verify the strengths of our urban road classification method. Our results show that the road morphology derived from the road DEM that was constructed based on our urban road classification method was more consistent with the actual road morphology than the existing methods. The framework structure of urban roads was obvious without abnormal changes on the local road surface. The urban road topography was expressed with finer details, which could be used as an important foundation for rain and flood simulation and hydrological analysis, etc. Thus, the road classification method proposed in this paper can assist the modeling of urban road DEM effectively and provide a reference for the construction of high-precision urban road DEM.
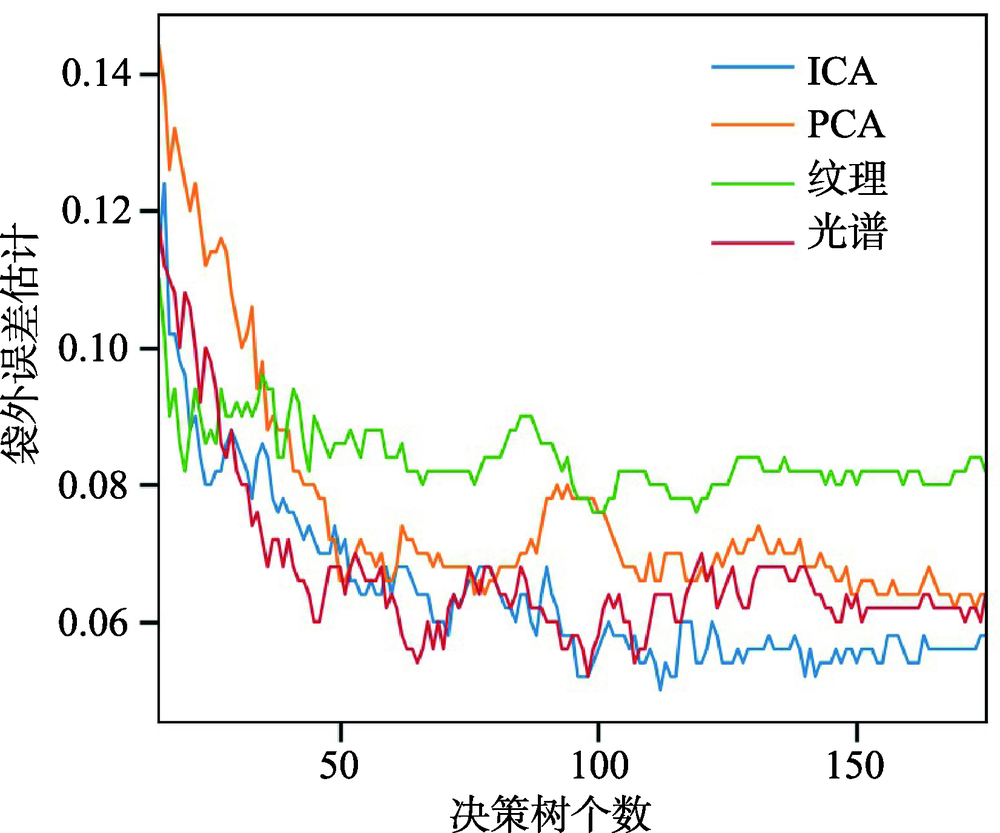
Urban area information is of great significance for human development, in the 2030 United Nations (UN) Sustainable Development Agenda. Urban area expanded rapidly in many places of the world. Accurate and timely urban area information is very important for decision makers. However, land cover in urban area is highly complex, including artificial buildings, trees, grasslands, water bodies, etc. Extraction of urban land cover information based on traditional manual survey is time-consuming and difficult to update in time. Free access to remote sensing satellite data such as Landsat provides a rich source of data for urban area extraction. Urban area information extracted from space borne remote sensing images can provide basic scientific data for decision-making and city construction and management. Based on supervised classification method and satellite remote sensing data, it is possible to extract urban areas fast. However, choosing appropriate feature variables is very important for obtaining accurate urban area extraction result, especially linear correlations between different features has a significant impact on the extraction accuracy. After implementing independent component analysis (ICA) transformation to satellite remote sensing image data, linearly independent feature variables can be obtained, therefore accuracy of urban area extraction can be effectively improved. Taking Beijing city as the study area and Landsat 8 Operational Land Imager (OLI) imagery (path/row: 123/32) acquired on July 10th, 2017 as the experimental data, preprocessing, texture extraction, independent component analysis, and principal component analysis were performed, 29 features in 4 dimensions and 7 feature variable combinations were selected. Then, Random Forest (RF) algorithm was chosen for urban area extraction owing to its stable performance, high classification accuracy and feature importance evaluation capability. Based on the random forest algorithm, feature importance evaluation, urban area extraction, and accuracy assessment were carried out to determine the optimal feature combination for urban area extraction. It was found that: (1) the overall accuracy of urban area extraction with spectral and ICA transformed features is 93.1% and the Kappa coefficient is 0.86, which is superior to the results with other features; (2) Based on the random forest algorithm, the data is trained to obtain normalized importance of each feature. There is a similarity between the normalized importance of features and the standard deviation of mean values of the features, indicating that the importance estimate of features has a close relationship with the standard deviation of mean values of the features and both can be used to estimate importance of the variables.
The finer-scale spatial distribution of population within cities and towns is of great significance for studying the human-resource-environment interrelationships and supporting smart city construction and resource allocation. It also helps the government to assist disaster assessments and land use planning, manage the distribution of population and resource, and promote urban sustainable development. However, existing population spatialization methods are insufficient to spatialize population in cities and towns at fine scales. With the rapid development of geospatial big data and the popularity of high-resolution remote sensing data, this study proposes a method to estimate urban population distribution at fine scales through fusing multi-source spatial data. First, a total of 12 variables having large correlations (R2>0.7) with the population were selected to estimate the population distribution in Ningbo city, including the build-up area, distance to the road, nighttime lights, business service center, EAHSI index, kindergarten, park, primary school, gas station, hospital, and bus station and coach station. First, the population distribution areas are determined by urban functional zones, then a random forest model was used to train a population estimation model with the selected 12 variables; finally, the 2018 population data of the Ningbo were redistributed into 500 m grids by the trained estimation model. The importance of the chosen variables were analyzed using the random forest model. The results demonstrate that the presented population estimation model reaches an accuracy of 81.2% at sub-district scale with the MRE of 0.29 and the RMSE of 3279.89. Therefore, the population estimation model presented in this study can accurately predict the population distribution at the sub-district. This study also conducted the accuracy verification at the grid scale with the MRE of 17.16 and the RMSE of 1149.9. According to the importance of variables computed by the random forest model, it is found that the importance of the variable building area is about 0.22, which has the largest influence on the population distribution, followed by the variables, distance to road, nighttime lights, business service center, EAHSI ( Elevation-Adjusted Human Settlement Index), kindergarten, and park. The accuracy verification at the grid level is of great significance for studying the fine population distribution in cities. However, the estimation accuracy is still not very high in some cases where the populations of some grids are either overestimated or underestimated. The lack of building height information is a possible reason. In addition, deep learning methods will be explored to improve accuracy in future.

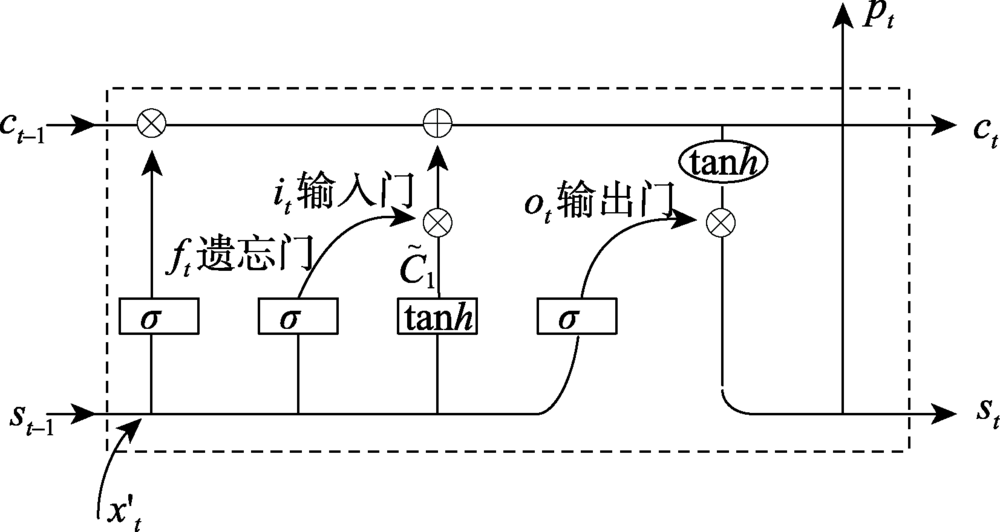
Precipitation prediction on the Qinghai-Tibet Plateau not only provides a basis for rational planning and utilization of water resources, but also has significance for climate change research in China and neighboring countries. In this paper, the Long Short Term Memory neural network (LSTM) was used to predict the monthly precipitation over the Qinghai-Tibet Plateau using data from 1990 to 2016. Firstly, the monthly precipitation data of 86 stations in the Qinghai-Tibet Plateau from 1990 to 2013 were used to predict the monthly precipitation of each station from 2014 to 2016. Comparing with the traditional RNN, NAR, SSA, and ARIMA prediction models, LSTM increased the average coefficient of determination (R2) by 0.07, 0.15, 0.13, and 0.36, respectively. Simultaneously, LSTM had lower Root Mean Squared Error (RMSE) and Mean Absolute Error (MAE). Among them, the observation of station 56106 showed that the LSTM model predicted the period more accurately with less displacement deviation, and that the prediction of the valley between July and September was more accurate with R2 reaching 0.87. Secondly, the spatial distribution characteristics of precipitation prediction accuracy were analyzed. The R2of each model was interpolated in the Qinghai-Tibet Plateau, and the spatial distribution characteristics of R2were analyzed. All the drought areas with rare rainfall and the wet areas with heavy rainfall were of lower R2, while the areas with stable climate and obvious precipitation were of higher R2. Areas of R2 over 0.6 were much larger when using the LSTM model than the traditional model. Finally, influence of different prediction lengths on the prediction accuracy was analyzed for each model. All models showed decreased prediction accuracy as the prediction length increased, yet the RMSE values predicted by LSTM were lower than by other models with the varying prediction lengths.
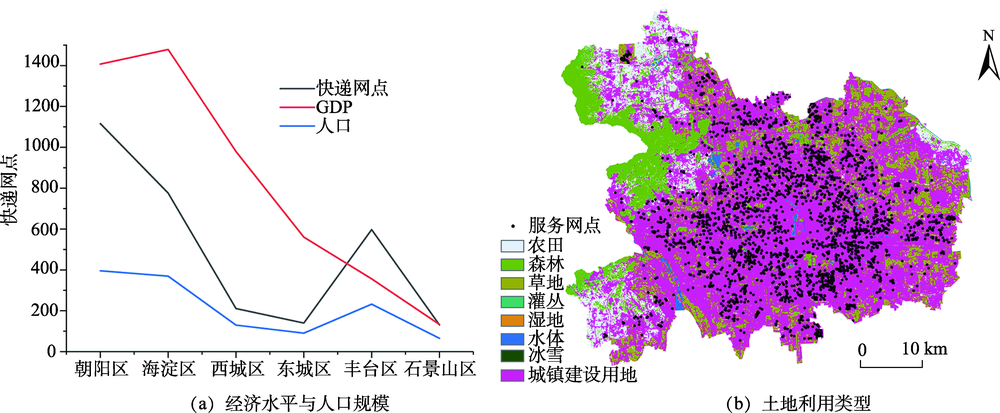
The leap-forward development of e-commerce has injected fresh blood into the express delivery industry to promote the national economy. As a bridge between express delivery companies and users, service outlets have gradually become an important research object of urban geography and logistics geography.In this paper, by taking Shunfeng Express service outlets of Beijing as the research object,we introduced for the first time the DBSCAN clustering algorithm andunattended intelligent express cabinets into the urban logistics express industry. Spatial analysis methods such as the nuclear density analysis and Ripley's K function wereused to quantitatively compare and analyze the spatial pattern, agglomeration features, and influencing factors of the two types of Shunfeng Express service outlets, namely, manned cooperative outlets and unattended intelligent express cabinets.Results show that: (1) The density-based DBSCAN clustering algorithm can quickly and efficiently identify clusters of express service outlets of any arbitrary shape. The algorithm identified 24 intelligent express cabinet clusters and 14 cooperative network clusters. (2) The high-density area of Shunfeng Express service outlets was mainly concentrated in residential areas with large population density, economic prosperity, convenient transportation, and residential areas in popular business districts, such as Shuangjing, Financial Street, Sanlitun, and Xueyuan Road. (3) The spatial distribution of the two types of service outlets, namely, cooperative outlets and smart express cabinets, was in an agglomeration mode, but the scale of agglomeration was different. The scale of express cabinet agglomeration was significantly larger than that of cooperative outlets, while the intensity of agglomeration was smaller than that of cooperative outlets. (4) The intelligent express cabinet had a large cluster density and a smaller service radius, and was more inclined to serve residential areas within the walking distance; the cooperative network had a smaller cluster density and a larger service radius, and the service object extended to the surrounding major areas with the service radius, at the same time, the demand for traffic accessibility increased. (5) The layout of Shunfeng Express service outlets were the result of a combination of the regional economic level, population size, traffic conditions, land use types, and urban functional area positioning.
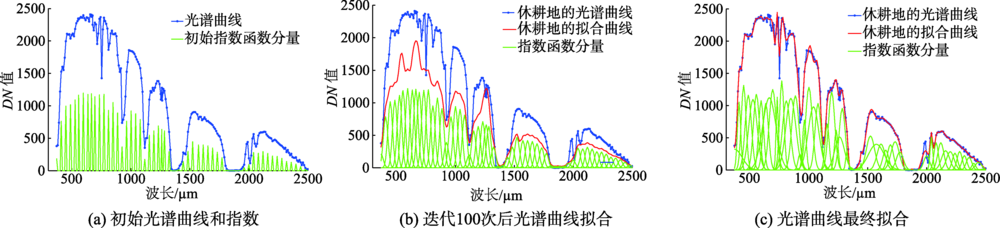
In recent years, the hyperspectral remote sensing technology has developed rapidly. Hyperspectral images obtained by hyperspectral sensors contain abundant spectral information of ground objects, such that they are good for fine spectral recognition. In hyperspectral image processing, its accurate classification is a solid foundation for the subsequent interpretation tasks. However, the numerous bands in hyperspectral imagery not only provide sufficient characteristics information for classification, but also bring the problem of how to use these characteristics effectively. In this paper, to make full use of the spectral information of hyperspectral images so to achieve accurate classification, a hyperspectral image classification method based on the Weighted Exponential Function (WEF) was proposed that considers the multi-peak characteristics of the spectral response curve of pixels. Firstly, the WEF model was used to build an ideal model of the spectral response curve of pixels, composed of several exponential functions with different weights. Because there are many parameters in the model (including weight, peak position and peak width), it is difficult to solve them. Therefore, the WEF model with fixed peak positions and number of exponential functions was used to model the spectral response curve of all pixels. Then, the parameters of the WEF model were determined according to the least square principle to fit the spectral response curve. Finally, the parameter set was used to replace the spectral measure vector, and the WEF model parameter vector of the pixel was used as its feature. Fuzzy C-means (FCM) algorithm was used for image classification. To validate the feasibility and effectiveness of the proposed method, the classification experiments of Salinas and PaviaU hyperspectral images were conducted by using respectively the proposed method, Principal Component Analysis (PCA) based classification method, Minimum Noise Fraction (MNF) based classification method, and FCM method with the spectral measure vector as the classification feature. The user accuracy, product accuracy, overall accuracy and Kappa coefficient of the results from these classification methods were calculated, and the experimental results were evaluated qualitatively and quantitatively. Compared with other methods, the classification accuracy of the proposed classification method for the Salinas image increased from 51% to 60%, and for the PaviaU image from 43% to 51%. In addition, the proposed classification method reduced the amount of hyperspectral image data while preserving the rich spectral information of hyperspectral images.
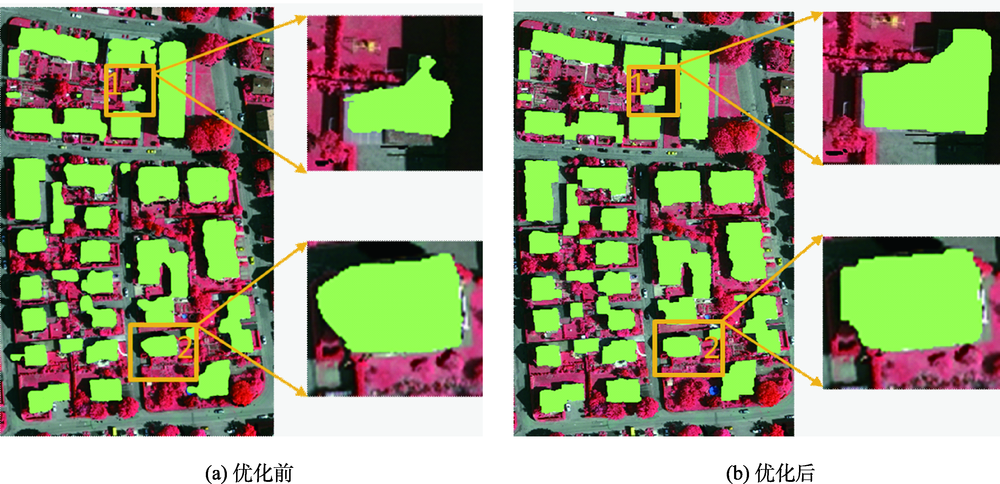
One of the main feature types in urban areas is building; automatic building extraction from high-resolution imagery or other data has great significance for improving the quality and efficiency of land use change detection, urban planning, land law enforcement, and so on. To deal with the problem of boundary inaccuracy of extracted buildings and the limitation caused by expressing image information with artificial features, this paper proposed a new building extraction method based on the SegNet semantic model, which fused feature information from LiDAR data and high-resolution imagery. Firstly, LiDAR data were preprocessed to obtain Digital Surface Model (DSM), Digital Terrain Model (DTM), and normalized Digital Surface Model (nDSM). The resulted image nDSM_en was acquired by removing tree points from nDSM with Normalized Differential Vegetation Index (NDVI) values derived from high-resolution imagery. Secondly, three features–LiDAR data echo intensity, and surface curvature from LiDAR data, and NDVI from high-resolution imagery were obtained to construct feature images for training the SegNet semantic model. Initial extraction of buildings was completed with the trained model. Finally, the threshold segmentation algorithm was executed with nDSM_en for generating image objects, which were used to refine the initially extracted buildings through boundary constraints. In the experiment which utilized the Standard Dataset as a sample, the average completeness, correctness, and extract quality of the proposed method at the pixel level were 96.4%, 94.8%, and 91.7% respectively. For building objects with area larger than 50 m 2, the above three indicators were 100%. Our findings suggest that the proposed building extraction method makes better use of the feature information which reflects the essential difference between buildings and non-buildings, integrates effectively the relative advantages of the two data sources, and can increase the accuracy of building detection and extraction.Key words: building extraction; LiDAR data; high resolution image; SegNet; threshold segmentation; boundary constraint
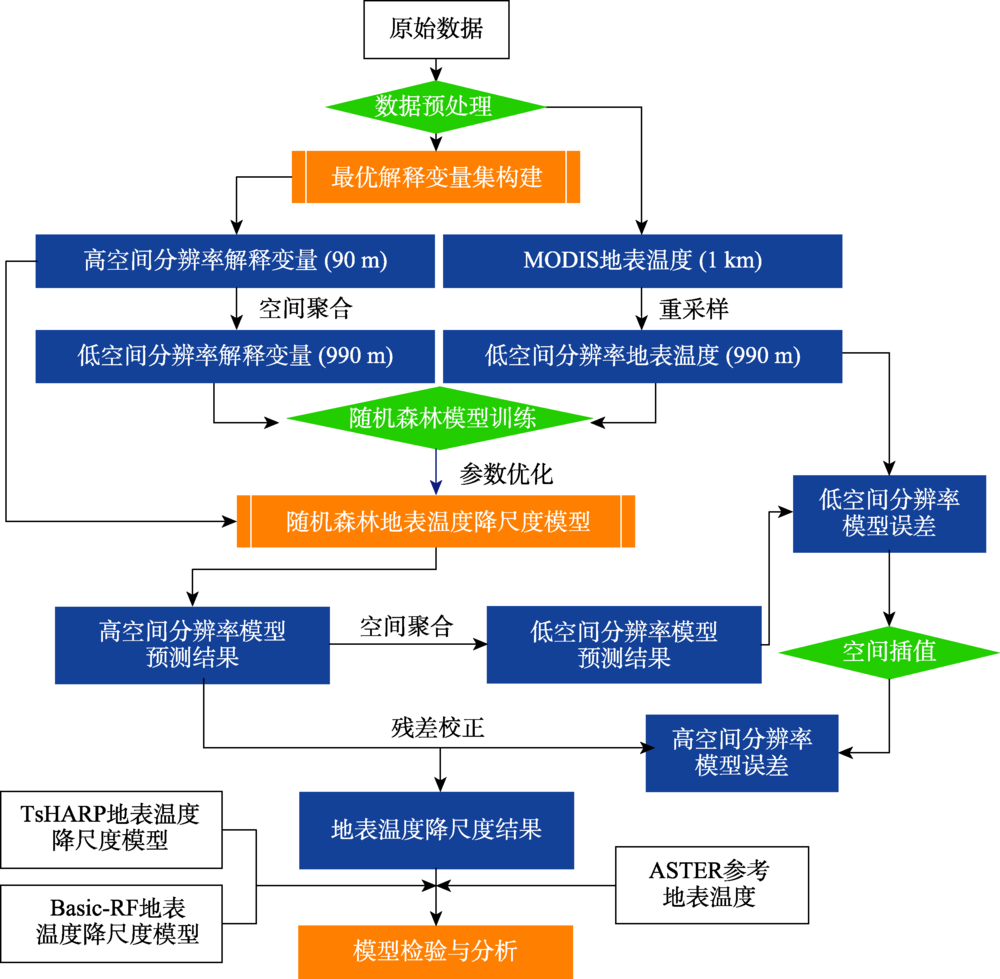
Land Surface Temperature (LST) is one of the most important environmental parameters that describe the atmospheric and land surface interactions and energy balance in the terrestrial ecosystem at regional and global scales. Due to the trade off between high temporal and high spatial resolutions of remotely sensed LST products, many downscaling algorithms have been developed. However, the selection of explanatory variables of LST and downscaling models are often restricted by study location, which limits the generalization performance of these models. In this paper, a robust downscaling method of land surface temperature using Random Forest algorithm (RRF) is proposed after the evaluation of relationships between six variables, including surface reflectance, spectral indices, terrain factors, land cover types, longitude and latitude information, andatmospheric reanalysis data, to establish a nonlinear relationship between LSTs and other land surface parameters. This paper selects 11 regions of China as study areas, the Moderate Resolution Imaging Spectroradiometer (MODIS) LST product is downscaled by RRF from 1 km to 90 m. A comparison with two other downscaling methods (the Basic-RF model and the thermal sharpening (TsHARP) algorithm) is also made. Taking Beijing city as a presentative study area, the RRF model is proved to achieve a more satisfied performance in both study area A and B, in which the RMSEs are 2.39 K and 2.27 K, respectively. Besides, the Root Mean Squared Error (RMSE) of the RRF model trained ins tudy area B and evaluated in study area A is 2.56 K, while the RMSE trained in study area A and evaluated in study area B is 2.44 K, with a small decreasein RMSE (i.e., 0.17 K). Our further experiment results prove the robustness of RRF model trained in a specific region while being applied to other regions, and indicate that we can downscale LST with the RRF model in a large area using a few study areas for model training.
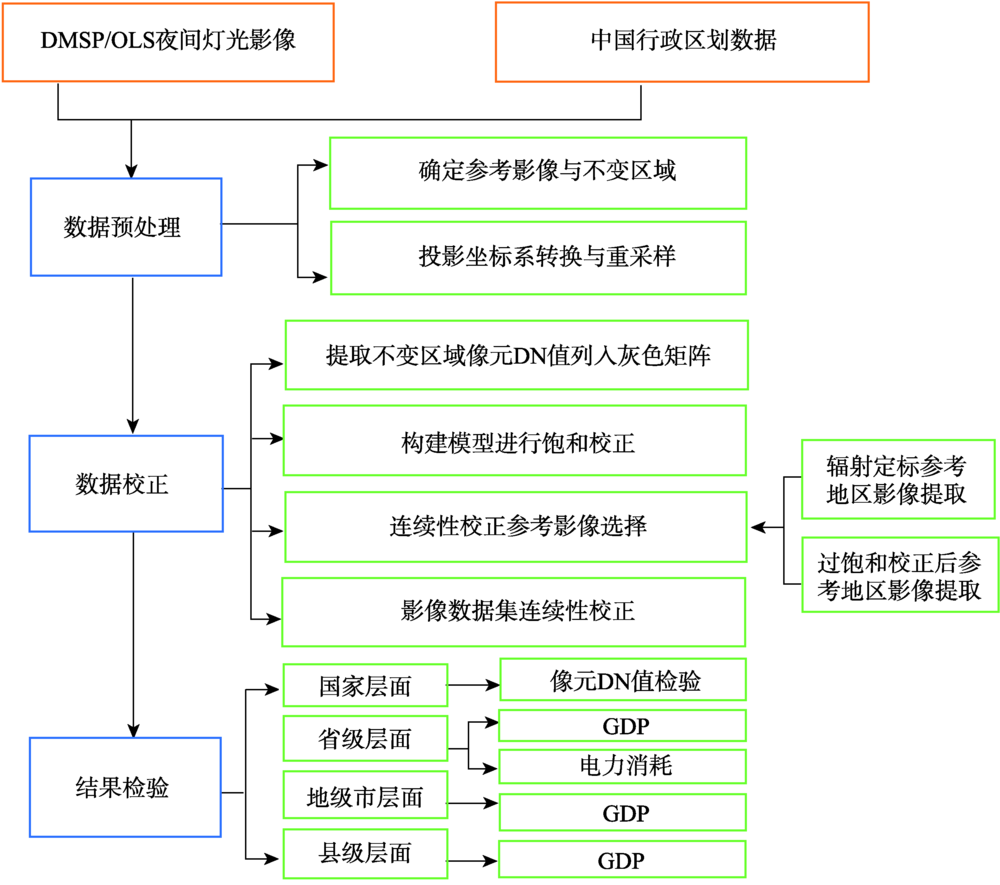
With the rapid development of remote sensing technology, the night light image of Defense Meteorological Satellite Program Scanning System (DMSP/OLS) has been more and more applied in the research of humanist economics. Since there are many problems in the original images, such as the saturation of DN value and inter-annual discontinuity, it is necessary to correct those data before using them. "Traditional invariant region method" is a widely-using correction method, but there are still some problems, such as not taking into account the weak changes from the prospect of a long-time scale of the target region and the selection of the reference year in a continuous correction. In this paper, the traditional invariant region method was improved. In order to reduce the impact on correction results, caused by the small changes of the target region in a long time scale, and to improve the saturation of the original images, the stable night light images of DMSP/OLS were saturation corrected with the help of selecting three group data (F12_1999, f14-15_2003 and F16_2006) as reference images. By the comparison between saturation corrected images and reference images, the reasonable reference year, F15_2006 (after the saturation correction), with the minimum error was selected, so as to carry out the continuous correction of the saturation corrected images. To verify the correction precision of images, in this paper, pixel DN value test was carried out at the national level. And linear regression test was carried out in the corresponding TDN value between GDP at the provincial level, electricity consumption at the provincial level, GDP at the prefecture-level and at the county level, at the same time, compared with the other published correction results such as Cao Z Y[25], results shew that the average fit R2 between the improved DMSP/OLS stable night light images TDN and the city's GDP was 0.85 while the average fit R2 between the results with the traditional invariant region method and with city GDP was only 0.53. As time goes by, the fitting degree of the traditional invariant region method gradually decreased to 0.40 in 2013. However, the fitting degree using the improved correction method did not decrease. In 2013, the R2 was 0.88, which indicated that compared with the traditional invariant region method, the correction accuracy was significantly improved and the saturation problem was greatly improved. At the same time, the fitting degree of TDN and GDP on the county scale was about 0.6, indicating that the night light image data set on the county scale also had certain applicability. However, this approach did not completely solve the problem of pixel saturation. How to solve this problem perfectly is the core in the application research of noctilucent data in the future.
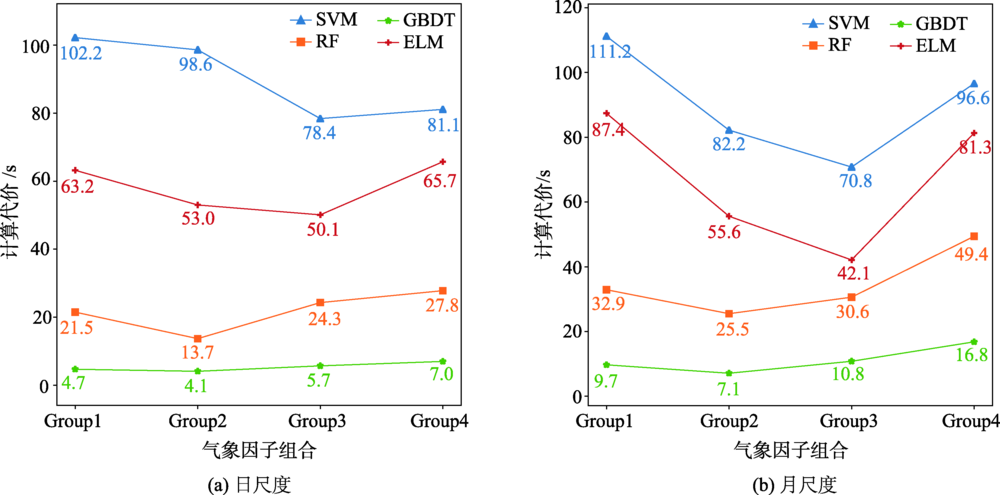
Accurate estimation of Reference Evapotranspiration (ET0) is essential to agricultural water management and allocation and hydrological cycle research. FAO-56 Penman-Monteith (FAO-56 PM) is the standard method to calculate ET0 recommended by Food and Agriculture Organization of the United Nations (FAO). But this method demands too many parameters and these meteorological inputs are not commonly available or unreliable, especially in Xinjiang province. Under this situation, machine learning algorithms have been introduced to estimate ET0 using fewer meteorological parameters and many comparisons of their prediction accuracy have been conducted. But the input combinations of meteorological factors are various and lack theoretical support. Meanwhile, the comparison of their performance at different time-scales has not been comprehensively conducted yet, and the good stability and less computational effort of models are also less to consider. The objective of this research was to evaluate machine learning algorithms' performance in modeling daily ET0 and monthly ET0 using fewer meteorological factors in Xinjiang. At this point, by using data collected from 41 weather stations in Xinjiang, this paper used Sensitivity Coefficient (SV) to evaluate the meteorological factors' influence degree to ET0 and then combined factors with high influence as input to Support Vector Machine (SVM), Gradient Boosted Decision Tree (GBDT), Random Forest (RF), and Extreme Learning Machine (ELM) in modeling daily and monthly ET0, and finally investigated and compared the performance of these algorithms from accuracy, stability and computational cost. The results showed RH (SV=-0.516), Tmax (SV=0.283)and U2 (SV=0.266) had high influence to ET0 followed by n (SV=0.124), while Tmin (SV= -0.016) and Tavg (SV= -0.003) exhibited low influence. In modeling daily ET0, models obtained satisfactory accuracy (RMSE<0.5 mm/day, R2>0.95) with input combination of RH, Tmax, U2 and n, while combination of RH、Tmax and U2 showed comparable accuracy for monthly ET0 prediction. The SVM and GBDT models showed the best performance and have been recommended for daily and monthly ET0 estimation in Xinjiang and maybe elsewhere with similar climates around the world.
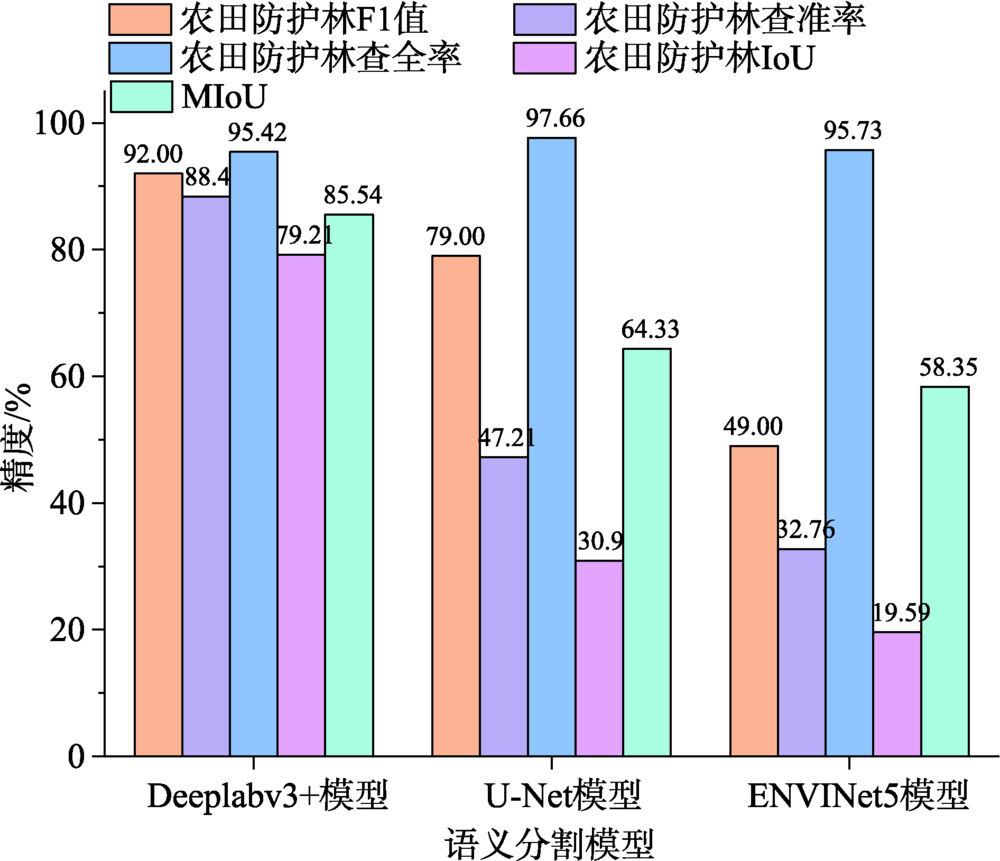
Farmland shelterbelt is the barrier of a farmland ecosystem. Monitoring and assessing the health condition of farmland shelterbelt are significant for farmland forests management in North China. This paper selects the farmland shelterbelt in the 3th Division of Xinjiang Production and Construction Crops as the experimental example. In July and August of 2019, we used the CW-20 fixed-wing drone which was equipped with a SONY-A7RII camera and a Micro MCA12 Snap camera to capture visible light images and multispectral images. Four targets on the ground with different reflectance (3%, 22%, 48%, and 64%) were set up for radiometric correction. we collected field data by Aowei software. Optimal bands were selected base on the Optimum Index Factor (OIF) and correlation coefficient. By integrating appropriate vegetation indices, eight different extraction schemes were constructed to select an effective method for final farmland shelterbelt extraction. In this study, when the flight mission was completed, we collated the exported POS and image data correspondingly. High resolution visible light images with 0.08 m resolution and high resolution multispectral images with 0.149 m resolution were first mosaiced using Pix4Dmapper. Four ground targets were then used for radiometric correction of mosaiced images using linear fitting model. The final experimental data was extracted using clipping method. Because each multispectral image was displayed in gray scale, which was not easy for direct data interpretation. High-resolution visible light images and multispectral images were registered together through ArcGIS software. We labeled 8030 samples based on visible light images through ENVI 5.5 software. We separated the training dataset and verification dataset according to the ratio of 4:1. Specifically, 112 512 pixel×512 pixel slices were taken as the training dataset, and 28 512 pixel×512 pixel slices were taken as the verification dataset. Based on eight extraction schemes, model accuracy of Deeplabv3+semantic segmentation model was evaluated. Three optimal bands that had the best model performance were selected including band 6 (wavelength 710 nm), band 8 (wavelength 800 nm), and band 11 (wavelength 900 nm) based on OIF. Based on these three optimal bands, we further compared the Deeplabv3+ model with U-Net and ENVINet5 model. Our results show that Deeplabv3 + model can capture the potential information in the images at a deeper level with fewer parameters. The MIoU derived from Deeplabv3+, U-Net, and ENVINet5 was 85.54%, 21.21%, and 27.19%, respectively. Also, Deeplabv3 + model solved the problem of sample unbalance. Our results provide a reference for the application of semantic segmentation using multispectral remote sensing data in farmland areas.
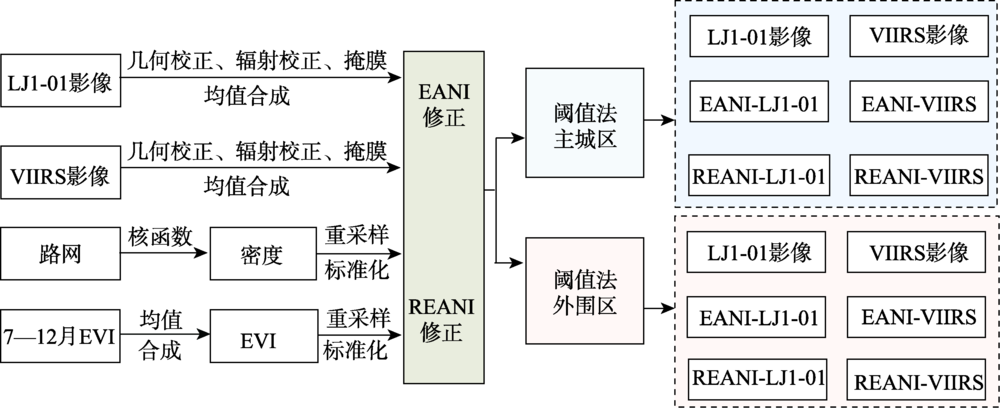
Nighttime light data are widely used to monitor human activities from space, such as urban development, population density simulation, energy gas emissions, power consumption, human activities and effects, economic development level, and ecological environment. However, due to road lights and light scattering from water surface, Nighttime Light (NTL) images always contain a lot of background noises. These background noises may greatly limit the application of nighttime light images in built-up area extraction. In our paper, based on high-resolution nighttime light images of Lujia1-01 from China and NPP-VIIRS from the United States in the second half of 2018, the Enhanced Vegetation Index (EVI) Adjusted NTL Index (EANI) and Road Density & EVI Adjusted NTL Index (REANI) were proposed to reduce background noises and applied to built-up area extraction. The EANI and REANI were developed based on the law that the Digital Number (DN) values of the nighttime light images are positively correlated with road density and negatively correlated with the EVI. In this paper, the Xuzhou city of China was selected as the research area. The threshold method was used to extract built-up areas in the main city and the peripheral area from the original LJ1-01 and NPP-VIIRS images, and the images processed by the EANI and the REANI, respectively. The results show that: (1) both EANI and REANI can effectively reduce background noises in nighttime light images. The results extracted from images processed by these two indexes were much better than that from the original NTL images, especially for the low urbanization areas; and (2) LJ1-01 performed better than NPP-VIIRS in built-up area extraction. Due to the higher spatial resolution of LJ1-01 data, the accuracy of extracted built-up areas from LJ1-01 was much higher than that from NPP-VIIRS in low-level urbanization areas, but was about the same with NPP-VIIRS in areas with high urbanization levels. Through error analysis, the relative error of extracted built-up areas from LJ1-01 decreased by about 6%, which indicates that LJ1-01 nighttime light image is promising for future built-up area extraction. Also, both EANI and REANI provide effective tools for the extraction of built-up areas and could be further applied to researches such as urban planning and urban expansion.
The retrival of Fraction of Absorbed Photosynthetically Active Radiation (FPAR) by remote sensing is one of the major research fields in ecological environment. However, in mountainous areas with rugged terrain, the estimation accuracy is seriously affected by terrain effect, including the influence of self and cast shadow. In this paper, Shadow-Eliminated Vegetation Index (SEVI), which can effectually remove the influence of terrain shadow, was used to conduct FPAR inversion in mountainous areas from remote sensing data. The inversion result based on SEVI was compared and analyzed with the inversion results based on Normalized Difference Vegetation Index (NDVI) and Ratio Vegetation Index (RVI) with different pre-processing degrees and evaluate the topographic effect of FPAR inversion based on different indexes in complex mountainous areas from remote sensing images. The results show that the FPAR inversion based on NDVI and RVI have much smaller values in self and cast shadow areas than that in non-shadow area without terrain correction using DEM data, their relative error are both greater than 70%. C correction can be better used in the pre-processing of NDVI and RVI deriving and effectually corrected the FPAR inversion results based on these two indexes, its relative error dropped to about 6.974%. But the results after C correction not performed well in cast shadow areas, its relative error is about 48.133%. The FPAR inversion based on the SEVI without DEM data can achieve similar results with the FPAR inversion based on NDVI and RVI after the atmospheric correction of the FLAASH and C combination, and the result shows a better terrain correction effect in shadow area where relative error dropped to about 2.730%.

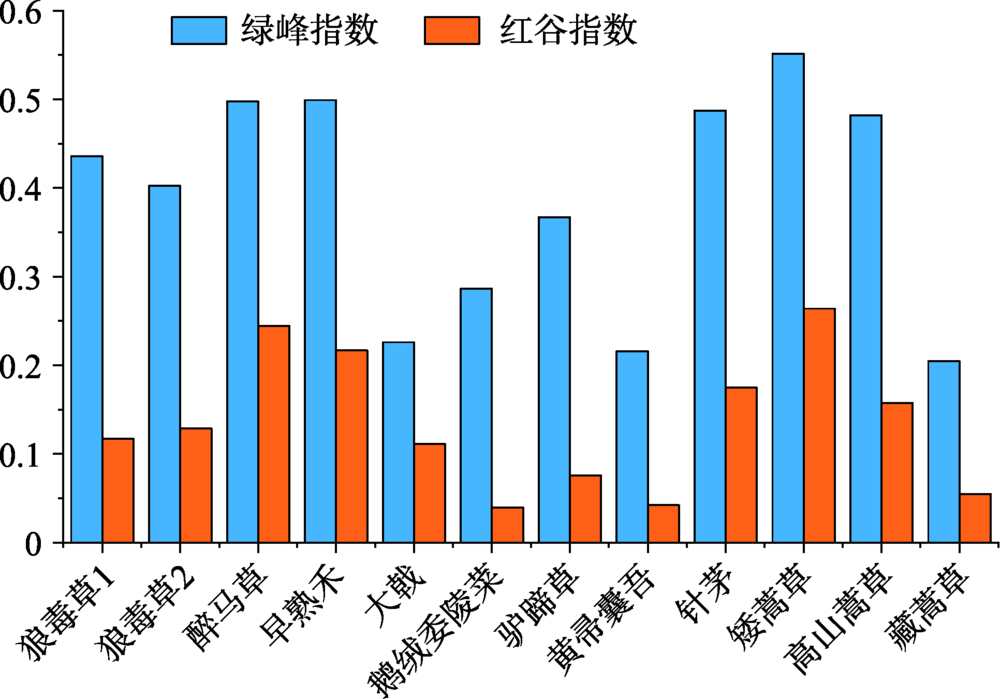
The poisonous weed type degraded grassland is a type of degraded grassland in the "Three-River Headwaters" Region, which has the characteristics of community reverse succession. Its manifestation is that the grassland community with fine herbage as the dominant species evolved into the grassland community with weeds and poisonous plants as the dominant species. Therefore, the key to control this kind of grassland degradation is to monitor the spread of poisonous weeds and the change of grassland community structure. Hyperspectral remote sensing Technology can be used to identify poisonous weeds and fine herbage in a region, and spectual feature analysis is the basis of remote sensing recognition of terrain features. In this paper, the hyperspectral data of eight typical poisonous weeds and four fine herbages in the degraded grassland of toxic weed type in the Three-River Headwaters Region were selected as the research samples. The hyperspectral data in this study are all from field sampling using AvaField-2 portable hyperspectral surface object spectrometer. After Savitzky-Golay convolution smoothing, envelope removal, derivative transformation, and spectral parameterization, the spectral characteristics of poisonous weeds and fine forage species were analyzed, and the characteristic recognition bands were extracted by Mahalanobis distance method. The results showed that: (1) After data preprocessing, the spectral reflectance curves of eight poisonous weeds and four fine forages are similar, but the spectral reflectance differences can be compared through some characteristic bands and parameters; (2) NIR peak refers to the maximum reflectivity of each vegetation in the wavelength range 780~1000 nm. The NIR peak of eight typical poisonous weeds and four fine forages were significantly different. The NIR peak of Potentilla anserine reached 60.07%, while that of Poa pratensis was only 17.53%; (3) After envelope removal, the spectral difference between absorption valley and reflection peak in vegetation spectral curve is more obvious. The maximum values of Caltha and Ligulariavirgaurea with similar NIR peaks were 0.3671 and 0.2157, respectively, in the green band; (4) The sensitive recognition bands of toxic weeds and fine forages based on Mahalanobis distance are mainly distributed in the wavelength range of 680~750 nm and 900~1000 nm. This study can provide an important scientific basis for the use of hyperspectral remote sensing in the identification of large-area poisonous weeds and the monitoring of vegetation community growth. It is of great significance to the monitoring and control of poisonous weeds and the sustainable development of animal husbandry in the Three-River Headwaters Region.
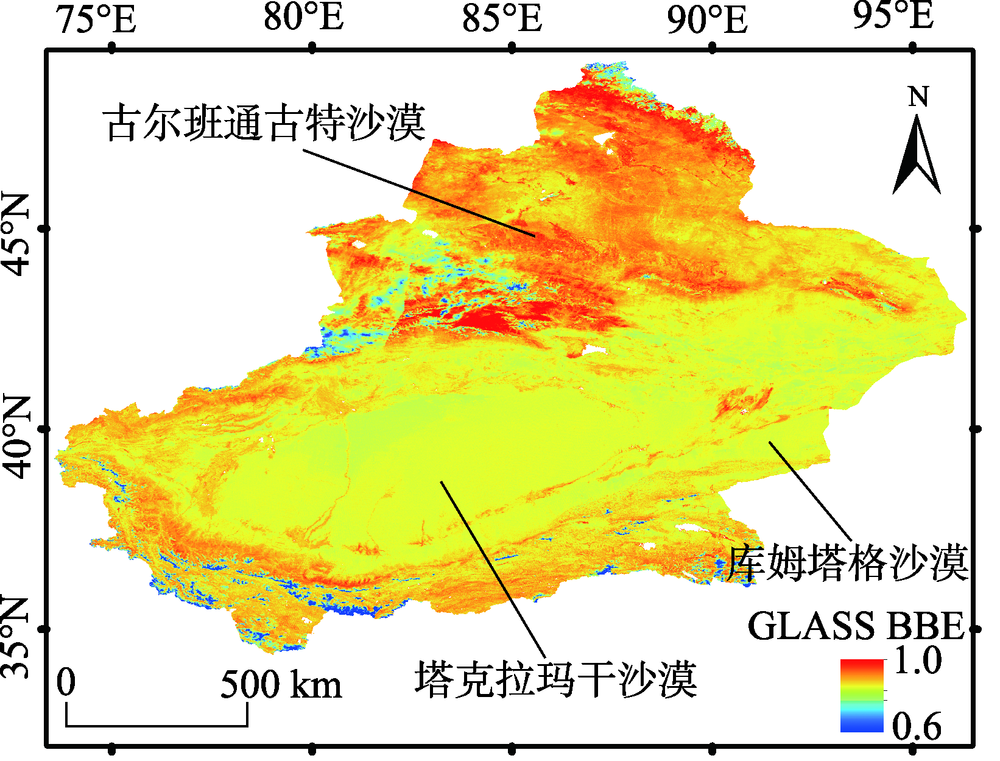
Surface Broadband Emissivity (BBE) is a key variable for estimating surface longwave net radiation, which is a component of the surface radiation budget and an important parameter in climate, weather, and hydrological models. A constant land surface longwave emissivity, or simple parameterization, has been adopted by many land-surface models because of the lack of reliable observations. Moreover, of all the various Earth surface types, bare soil has the largest variation in BBE. Thus, accurate estimation of land surface emissivity for bare soil is important for retrieval of surface temperature and calculation of longwave surface energy budget. In order to retrieval accurate emissivity from remote sensing in the bare-soil area, two types of data were obtained indeserts of Xinjiang: (1) Land surface emissivity at 25 sites along two highways across the Taklimakan Desert. The spectral of broadband emissivity were measured in the fall of 2013 and 2014 by portable FTIR ( Fourier Transform thermal InfraRed spectroscopy), (2) MODIS (Moderate Resolution Imaging Spectroradiometer) temperature and emissivity data ( MOD11A1 and MOD11B1 ), reflectance data ( MOD09GA ), and albedo data (MCD43A3) of the same period.The two types of data were combined to estimate the surface emissivity of the Xinjiang deserts. Firstly, we re-estimated the coefficients of the MODIS BBE equation and the GLASS (Global Land Surface Satellite) BBE equation. The MODIS and GLASS BBE equations were both optimized with the new coefficients. Secondly, we compared with the optimized GLASS BBE equation with the FTIR and MODIS BBE equations. By comparison, the accuracy of optimized GLASS BBE equation was significantly improved, which was proved by: (1) According to the error analysis against FTIR data, the value of R2 (coefficient of determination) increased from 0.42 to 0.95, the RMSE ( Root Mean Square Error ) and the Bias reduced by 1 and 3 orders of magnitude, respectively; (2) Compared to MODIS BBE data, the value of R2 increased from 0.69 to 0.91, the RMSE and Bias reduced by 1 and 2 orders of magnitude, respectively. In our study, the BBE in Xinjiang desertswasfinally calculated using the optimized GLASS BBE equation. Our results show that the BBE in Taklimakan Desert ranged from 0.88 to 0.91, which was due to the single type of terrain, soil, and particularly aridity.While the Gurbantunggut Desert and the Kumtag Desert were more affected by topography and vegetation, their BBE values (0.89~0.95 and 0.89~0.94, respectively) were slightly higher than that of the Taklimakan Desert. The sparse vegetated area around the deserts and the edge area had the highest BBE(0.95~1.00).The BBE equationsdeveloped for Xinjiang desertsbased on GLASS and MODIS provides useful reference forfuture land-surface process models.