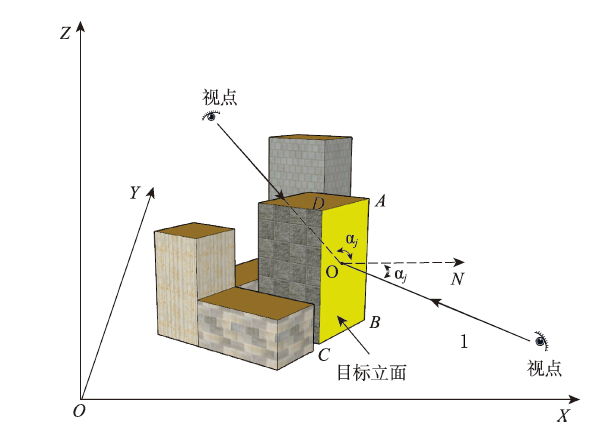
Texture is one of the important information in the three-Dimensional (3D) city photorealistic mapping, which usually occupies large computer memory for storage. As a result, the effective modeling and organization of texture data become an important issue in geographic information science community. Hence, this paper proposes the Fractal Viewing Distance (FVD) multi-resolution texture data generation and organization method for 3D city building photorealistic mapping. First, a fractal compression method based on the self-similarity and self-affine properties of texture is developed, which compresses and stores texture and 3D building model data in the database. Second, the corresponding texture is created and organized according to the visual distance and the visibility of the target facade. When the visual distance meets the texture calling condition and the target facade is visible, the texture data is iteratively decompressed, and the number of texture resampling is determined to create multi-resolution texture data. A texture index is established and stored in a database according to the relationship between various types of 3D building model data. When the visual distance does not meet the texture calling condition, but the target facade is visible, the building facade texture is represented using a colored texture tree created in this paper. The method smooths the texture and divides it into different rectangles as nodes based on the color difference, and then a colored texture tree is built to store these nodes. In the process of model visualization, the nodes are merged to represent the texture. Finally, the corresponding texture is selected according to the angle of view and distance, representing the dynamic and smooth visualization of the 3D model. The experimental field consisting of a total of 5290 texture data, located in Lixia District, Jinan City, Shandong Province is selected to validate the method we proposed, which occupies a total size of 6.1G. The results demonstrate that when the number of decompressing iterations reaches around 8 or 10, the peak ratio of signal to noise of each texture tends to be stable. The average memory consumption is approximately 54.7%, and the frame rate for building fa?ade mapping is at about 42 frames per second. Compared with 3ds Max and SketchUp Pro, the proposed method reduces the memory occupation by about 36.5 % and 49.1%, respectively, and increase the frame rate approximately by 7 % and 10.9 %, respectively. The method proposed in this paper has achieved a good balance between rendering efficiency and visual quality of 3D building model. The method proposed in this paper can provide an effective scientific support for the establishment of smart city.
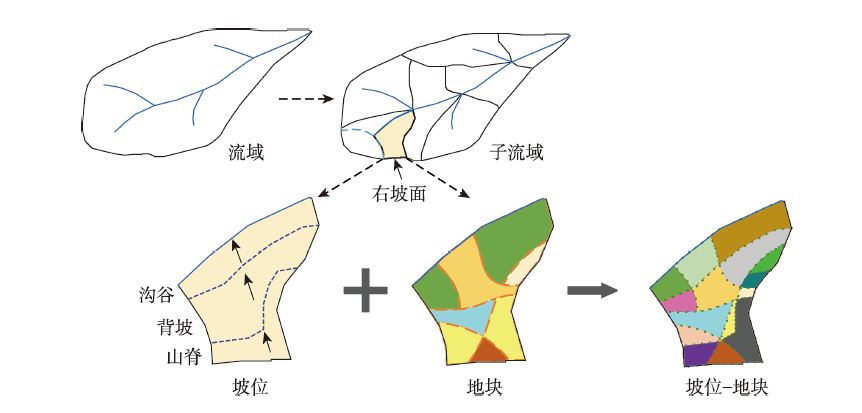
Best Management Practices (BMPs) are effective ways to control environmental problems in watersheds such as soil erosion and nonpoint source pollution. BMP scenario optimization method based on watershed modeling and intelligent optimization algorithms can obtain near-optimal Pareto solutions with comprehensive cost-effectiveness. Existing spatial units used for BMP configuration in optimizing BMP scenarios (e.g., subbasins, Hydrological Response Units (HRUs), farms, and slope position units) cannot comprehensively represent spatial relationships between BMPs and topographical positions and differences of BMPs configured on various landuse units within the same topographical position. In other words, these spatial units cannot effectively consider both the characteristics of natural processes and the flexibility of BMP configuration during BMP scenario optimization in a watershed. In this paper, a composite type of spatial unit, the so-called "slope position-field" unit, is proposed to be the BMP configuration unit, which can incorporate the advantage of slope positions (i.e., effectively considering spatial allocation relationship between BMP and topographic position at the hillslope scale) and that of landuse fields (i.e., effectively considering the difference of BMP configurations on various landuse units within a topographical location). Based on a distributed watershed modeling framework named SEIMS (Spatially Explicit Integrated Modeling System) and a multi-objective optimization algorithm named NAGA-II ( Non-dominated Sorting Genetic Algorithm II), a methodological spatial optimization framework of BMP configuration based on the slope position-field units is designed. The method was examined by a case study of controlling nonpoint source pollution in the Zhongtianshe watershed, Liyang city, Jiangsu province, China. Four types of BMPs (e.g., reducing fertilizer application, returning farmland to forest, closed forest, and planting ecologic forest and grass) were selected. The optimization objectives are maximizing the reduction rate of total nitrogen output at the watershed outlet and minimizing the economic cost of the BMP scenario. The proposed BMP configuration unit was compared with two existing types of BMP configuration units such as slope position unit and field unit on the effectiveness of watershed BMP scenario optimization. The results present that: (1) compared with slope position units and field units, taking slope position-field units as BMP configuration units can obtain the largest number of optimized BMP scenarios that have the best comprehensive cost-effectiveness, which can be interpreted from the scatter plot of Pareto solutions, and proved by the quantitative Hypervolume index (with an increase of 7% and 4%, respectively); (2) BMP scenarios based on slope position-field units have more fragmented but finer spatial distribution of BMPs. Therefore, slope position-field units are more flexible for BMP configuration and hence maybe more beneficial for actual BMP implementation. In conclusion, the proposed method can optimize the spatial configuration of BMPs effectively and reasonably, so as to support decision making for watershed management.
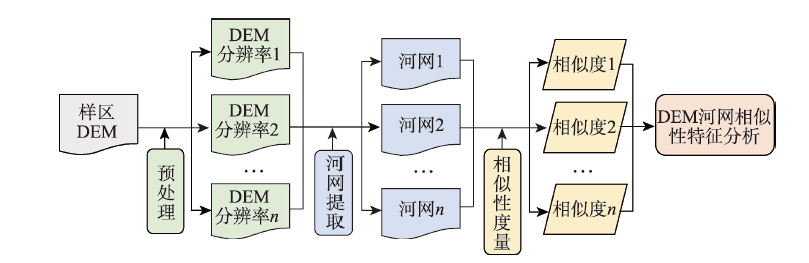
Drainage network is a key element of topographic structure and can be applied to assess the DEM quality effectively. As the spatial resolution of DEM decrease, the topographic information represented by DEM will be more generalized. The generalized drainage networks can thus be derived from low-resolution DEM. The spatial variation of drainage networks at different DEM resolutions can be quantified by the metric of spatial similarity. This metric has been widely used in terrain generalization, quality assessment, and uncertainty analysis. Therefore, this paper aims to quantify the spatial similarity of drainage networks derived from multi-resolution DEM. Firstly, this paper presents an adaptive method to derive drainage networks from DEM at different resolutions. This adaptive approach combines the non-linear filtering of elevation data, a statistical analysis of geometric curvature, and geodesic minimization principles to automatically extract drainage networks. Secondly, the calculation of spatial similarity of drainage networks uses four indicators including topological relation, direction relation, distance relation, and attribute variation. The weighted sum is applied to sum up the four indicators, and the corresponding weights are 0.22, 0.25, 0.31 and 0.22, respectively. Finally, based on the spatial similarity of different drainage networks, the varying patterns and relationships with the errors of topographic parameters (e.g., elevation and slope) are analyzed via a sample area located in the hilly and gully regions in Loess Plateau. The results show that: (1) the adaptive method for extracting drainage networks can effectively capture the morphological features represented by DEM at different resolutions and automatically generate drainage networks with high accuracy; (2) there is a significant relationship between the spatial similarity of drainage networks and the corresponding resolution change, which can be fitted by a power function; and (3) the relationship of spatial similarity with the root mean square error of elevation and slope can be fitted by the power and logarithmic functions, respectively. The relationship with the latter is more significant than the former.
The existing methods of mining the relationship between terrorist groups are difficult to be applied in anti-terrorism researches because of the unique characteristics of terrorist group relationship such as complex structure, flexible action, and long survival period. From the perspective of time and space, based on the characteristics of spatiotemporal proximity and spatiotemporal co-occurrence of terrorist groups, the relationship of multiple independently distributed terrorist groups is modeled as the frequency of spatiotemporal co-occurrence in our study. We propose a method of terrorist group relationship mining based on the distribution of point mode. Based on this method, a terrorist group network can be constructed. We further applied this method to analyze the real GTD data of Afghanistan and Pakistan from 1970 to 2018. The results show that there are mainly 11 types ({Taliban,TTP}, etc.) of terrorist group relationship in our study area. The terrorist organization that occupy the core position in the network is Taliban, followed by TTP and BLA. The method proposed in this study can effectively quantify the potential relationship between terrorist groups. The quantified terrorist group relationship also indicates the positions of different organizations in the network. Our verification analysis shows that our results are highly consistent with the spatiotemporal distribution and historical roots of the terrorist events. This study expands the application of spatiotemporal co-occurrence pattern in discovering the relationship of terrorist groups. Our results are of great significance to the public security department in identifying the perpetrators of certain terrorist incidents and reasonably allocating police resources.
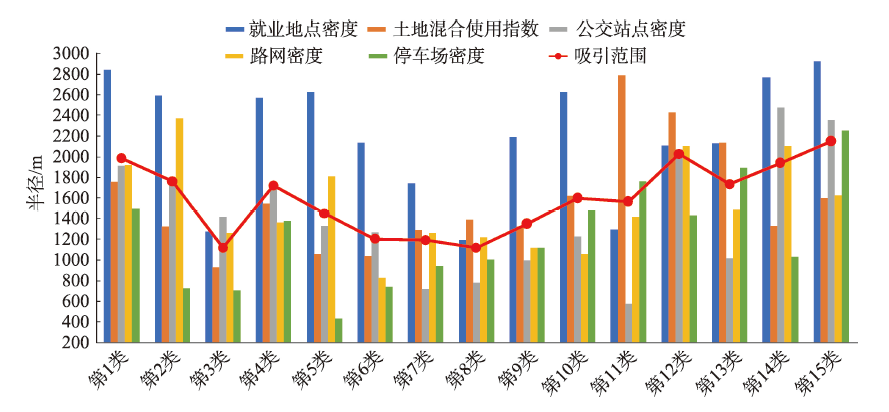
With the development of the times, the scale of the world's cities is expanding, and the traffic demand of major cities has sharply increased. Traffic congestion and environmental problems caused by road transportation have led governmental departments to turn to underground transportation. The metro is the most important means for underground transportation. Identifying the catchment area of a metro station is essential for evaluating and improving metro system service and its surrounding built environment, which provides important reference for optimizing metro resources and planning new metro facilities. Traditional methods of identifying the catchment area of a metro station mostly depend on the investigation of residents' daily travel, which is usually time-intensive and labor-consuming and causes uncertainties in catchment area. The emergence of multi- source urban data provides a new solution to quantify the surrounding built environment and spatial distribution of passenger flow, which allows for a reasonable delineation of catchment areas. Transit Oriented Development (TOD) is an important choice for the harmonious development of cities and transportation in high-density cities (e.g.Shenzhen, Beijing, etc.). From the perspective of TOD, this paper presents a data-driven method to outline the catchment area of the metro station. We used multi-source urban data in 2017 in Shenzhen city including road network, bus routes, point of interest, etc.,to characterize the TOD around metro stations. Then these metro stations were spatially clustered, and their catchment areas were computed according to the trend of the TOD indices. The TOD-based catchment area of metro stations can vary across space. The results show that: (1) the proposed method captured the difference in catchment areas around different metro stations. The employment density and mixed land use played the most important role; (2) compared with suburbs, the catchment radius of metro stations in the central urban area was relatively smaller but represented higher travel demand, which indicated that the metro planning should better balance its service coverage and urban travel demand; and (3) the overlap of catchment areas in Shenzhen coincides with the well- developed areas, which inspire us that building up new metro stations could accelerate the development of surrounding areas.
With the continuous development of China's social economy, residents' demand for medical services is increasing. It is of great significance to analyze and evaluate the service scope of urban medical facilities to solve the contradiction between medical supply and demand and improve the level of urban health. At present, the coverage assessment of medical facilities in China mostly ignores the traffic network and population distribution, resulting in many blind areas of urban medical services. The complex terrain environment of mountainous high-density city affects the travel ability and mode of residents, and increases the difficulty of medical facilities service coverage, so it is difficult to accurately evaluate it by traditional methods. Based on the analysis and comparison of the advantages and disadvantages of the existing medical accessibility research methods, taking the main urban area of Chongqing as the experimental area, this paper attempts to adopt the optimized 2SFCA, and according to the network map data and official statistical data, establishes the medical facility accessibility analysis model based on GIS platform, The coverage of medical facilities and medical accessibility of each street and town were scientifically evaluated from three levels of city, district, and community. The results show that the improved method can deal with massive medical data, accurately simulate the scope of medical services, and output the evaluation results of full level medical facility service coverage, which is more suitable for mountainous areas with complex transportation and multi-level medical facility service coverage evaluation. The comprehensive evaluation shows that the medical facilities in the main urban area of Chongqing have the problems of uneven spatial distribution of large general hospitals and incomplete internal coverage of primary medical facilities, and the streets and towns with better medical coverage only account for 33.1% of the total. Therefore, it is suggested that the high-quality large-scale medical resources gathered in the old urban areas should be shared with the new urban areas. At the same time, according to the geographical location and technical ability, medical districts with complete levels should be established to make up for the shortcomings of primary medical services in the old urban areas, to improve the allocation of medical facilities in the main urban areas of Chongqing.

Urban transit system is a public service facility oriented for the public, especially the vulnerable groups. The fairness of urban transit service is of great significance for promoting the construction of livable and transit-oriented cities. Considering the impact of terrain variation in mountainous cities, an innovative approach is proposed to measure the actual service scope of transit stops to modify the fairness evaluation model of transit service. Taking Guiyang city as an example, the fairness of transit service is analyzed for the elderly group in Guiyang. The results show that: (1) Due to the influence of the terrain of the mountainous city, the actual service scope of stops and the number of residents covered will decrease. The service scope of transit supply has decreased significantly. Considering the terrain factors, the service supply scope of transit system based on modified model is more consistent with the actual situation of mountainous cities; (2) The distribution of service supply of "Bus + BRT (Bus Rapid Transit)" transit system for the elderly group presents a circle structure, which gradually decreases from the core area to the periphery of the urban area. The fairness of transit service supply of "Bus + BRT" transit system among the elderly groups is at a great disparity level, and its distribution tends to be polarized. The spatial allocation of "Bus + BRT" transit system service supply in the elderly group is significantly unbalanced. Although the elderly group is more concentrated in the urban core, the per capita service supply of "Bus + BRT" transit system is lower than the average level. (3) When Rail Transit line 1 is added to the "Bus + BRT" transit system, the transit service supply presents an irregular "core-periphery" structure around the Rail Line 1. The polarization trend of the service supply from "Bus + BRT"transit system among the elderly group decreased, and the unbalanced spatial allocation of "Bus + BRT" transit system service supply among the elderly group was improved. Rail transit operation exerts a significant effect on the improvement of urban transit service supply. The research results could provide a theoretical reference for the transportation planning department of mountainous cities to reasonably carry out the layout of service supply facilities in urban transit system. Combined with terrain variation characteristics of mountainous city, some suggestions are also proposed to promote the fairness of the service supply of urban transit system in Guiyang.

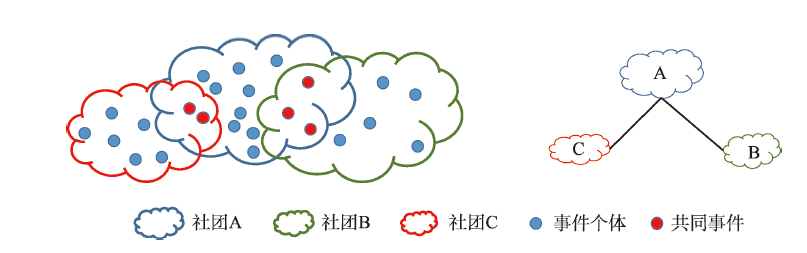
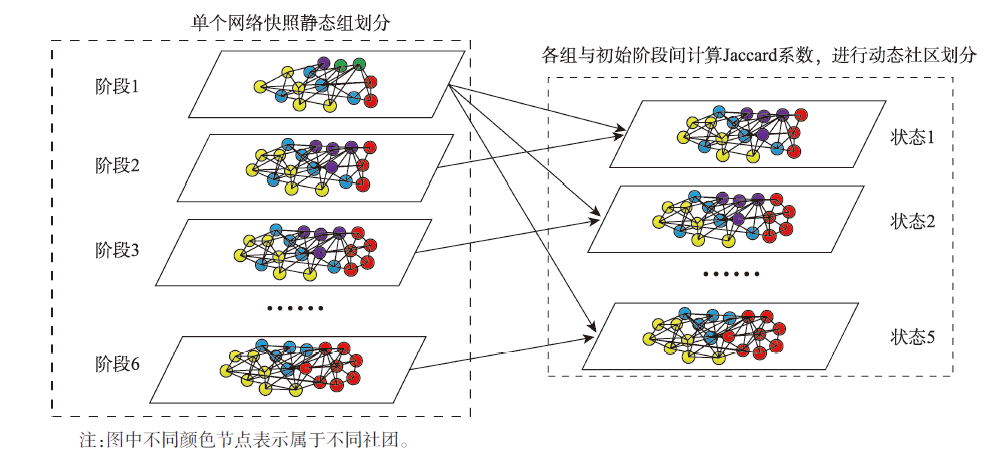
Since the beginning of the 21st century, the complex and fast-changing international relations have brought profound effects to the world economy, politics, security, and diplomacy. Keeping abreast of the changes in international relations is of great significance to China's foreign policy making and overall development planning. With the advent of the era of big data, the application of big data combined with quantitative analysis tools of international relations to timely and effectively mine the change patterns of international relations has become an important issue. Big data of news events with strong timeliness and high information content can timely reflect the information that international events affect global international relations. As an information mining method oriented to big data, network mining is a good choice for data-driven international relations research because of its figurative relational expression and rich structural analysis methods. Taking short-term international events as the background, the network mining of big data of news events and the sequential evolution analysis of international relations network can provide solutions to the changes of international relations in the context of changes of international relations caused by short-term international events. This paper takes the Trade War between China and the United States as an example to study the temporal evolution pattern of the international relations network in special events. Based on the GDELT news event data, the international relations network is constructed, and methods based on complex network theory are used for information mining and analysis of international relations. Firstly, the data are used to construct the international relationship network, then the temporal evolution patterns are detected by dynamic community partition method, and finally the spatial characteristics are analyzed by combining the spatial analysis methods such as analysis of point distribution patterns, nuclear density analysis, and spatial autocorrelation analysis. The results show that: (1) In the process of the occurrence of special events, there is a strong correlation between the evolution of the network community and the type of sub-events; and (2) Nodes in the same community generally show obvious clustering characteristics in spatial distribution. Nodes in a specific region join different communities with high frequency. The spatial distribution of the high values of node network attribute changes with the occurrence of events. The local eigenvalues of the network change dramatically with the occurrence of sub-events. The research in this paper provides a new perspective for the empirical analysis of the dynamic changes of international relations in short-term international events, provides a new idea for the spatial shift of international relations research, complements the data-driven international relations research at the methodological level, and also provides a reference for the network mining of big data.
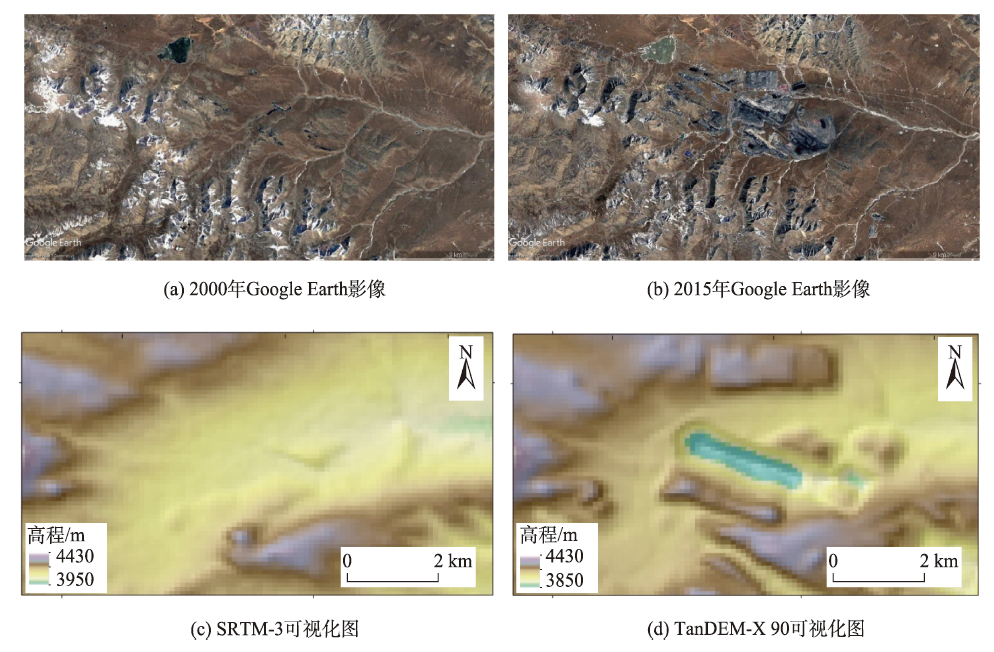
Digital Elevation Model (DEM) is the basic data of studies on monitoring earth surface status and processes. Accuracy assessment of DEM is of great importance in selecting the optimal dataset and estimating the influences caused by DEM errors. Among all the open-access DEM data at a global scale, TanDEM-X 90 m DEM (termed as TanDEM-X 90 hereafter), released in 2018, has attracted widespread attention due to its good performance demonstrated by recent studies. However, few studies focus on the accuracy assessment of TanDEM-X 90 at a large scale, lacking the knowledge of its overall accuracy and the spatial distribution of error influencing factors. In this study, ICESat/GLAS altimetry data was used as basic reference data while SRTM-3 DEM and AW3D30 DEM were used for comparison. Using statistical parameters of Mean Absolute Error (MAE), Root Mean Square Error (RMSE), skewness, and kurtosis, this study investigated the statistical characteristics and spatial distribution patterns of TanDEM-X 90 errors across mainland China. This study also explored the impacts of elevation, slope, geomorphic type, and land cover to DEM vertical accuracy and further analyzed the applicability of TanDEM-X 90. The results indicated that: ① MAE and RMSE of TanDEM-X 90 in China are 4.31 m and 7.87 m, respectively. The overall accuracy of TanDEM-X 90 is close to that of SRTM-3 (MAE=4.72 m, RMSE=7.71 m), but obviously poorer than AW3D30 (MAE=2.69 m, RMSE=4.17 m). ② TanDEM-X 90 achieves the highest accuracy among the three DEMs when the slope is smaller than four degrees. ③ TanDEM-X 90 has better performance than SRTM-3 in three types of landforms, plains, hills, and terraces. ④ Furthermore, the spatial distributions of vertical error of TanDEM-X 90 by watershed were also represented at a national scale, which can provide a beneficial reference for the data applications. In addition, TanDEM-X 90 has been proved to be better in depicting the recent elevation changes of land surface affected by human activities because of its advantages in data acquisition time. For areas with obvious artificial reconstruction such as mining districts, the appropriate time phase of the data according to the research objectives is more important than the difference in data accuracy. This study also found that there are obvious outliers in the TanDEM-X 90 data of the existing version, which restricts the regional availability of the data. Further improvement of this data is the focus of future researches.
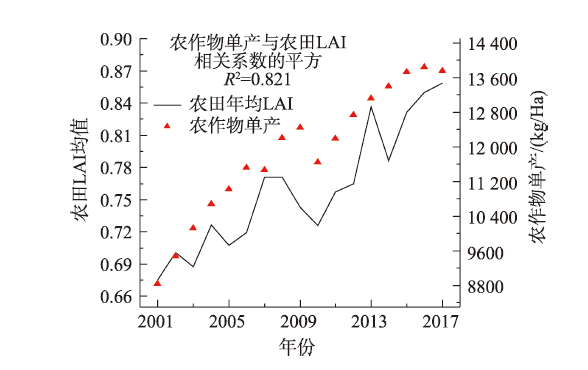
Leaf Area Index (LAI), one of the vegetation biomass indicators, not only change with growth of crops, but also closely related to agroecology and crop yield in cultivation areas. In this study, the long time series of MODIS-LAI data were reconstructed in China's cultivation areas from 2001 to 2017. The spatial and temporal changes of LAI were further analyzed by Mann-Kendall test, coefficient of variation, and gravity center migration model. The results show that LAI significantly increased wavelike from 2001 to 2017 in cultivation areas of China. The correlation coefficient between LAI and crop yield was as high as 0.91. There were significant differences in mean LAI between different seasons, with summer (1.54) > autumn (0.78)> spring (0.63) > winter (0.31) and an average of 1.13 for the growing season. LAI changed little from 2001 to 2012 in the double and triple cropping regions but showed an increase trend after 2012. It was very different that LAI in the single cropping region showed a steady increase before 2006 and an abrupt increase after 2006. The coefficient of variation of LAI was large in cultivation areas in the north of the Yangtze River in China with a maximum of 4.12. Moreover, the gravity center of cultivation areas first migrated forward southwest and then forward northwest. The migration range of LAI gravity center during farmland growth season was larger than that of cultivation area. It migrated to the west after the north-south transfer, with a migration distance of 82.78 km and 90.53 km, respectively.
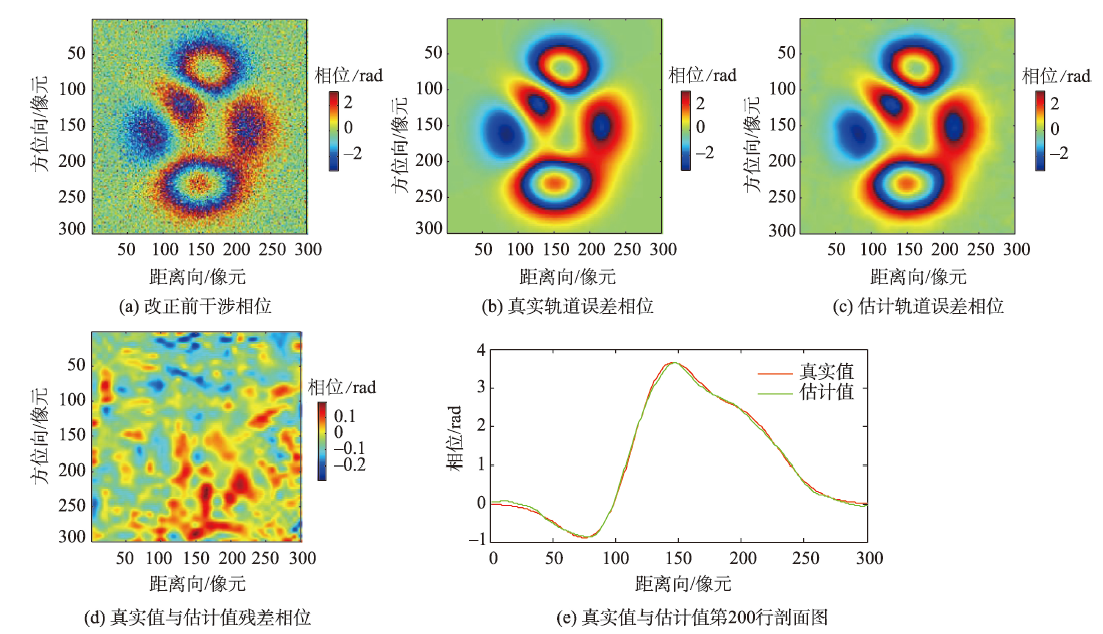
In the process of high-resolution airborne interference SAR imaging, due to the deviation from the ideal trajectory during the flight of the aircraft, it is necessary to compensate the motion trajectory of the inertial navigation system and the GPS system. However, due to limited accuracy of current sensor navigation, orbit error still exists after motion compensation, which affects the accuracy of the interference phase. In this paper, a method of removing orbit error for airborne polarimetric interferometric SAR is proposed. This method uses wavelet multi-scale analysis to decompose the phase of differential interference in different polarization modes and reduce the interference of terrain error phase and noise phase to orbit error. According to the correlation of orbit error between different polarizations, the phase is corrected by weight reduction. Finally, we get Phase unwrapping of differential interference after orbit error correction. In order to verify the reliability of the method, simulated data and E-SAR P-band multi-polarization data are used for experimental analysis. The results show that the orbit errors are eliminated obviously. In addition, the correction interferograms obtained in P-band are also used to generate Digital Elevation Model (DEM). The Root Mean Square Error (RMSE) of DEM and LiDAR obtained before and after correction are 6.02 m and 1.68 m, respectively, which improves the accuracy of InSAR measurement. This study provides a new thought for airborne InSAR orbit error compensation.
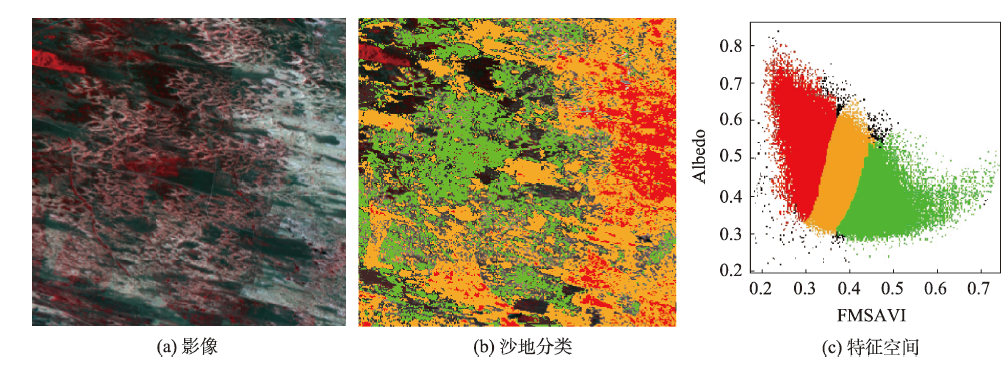
Desertification has become one of the most serious environmental problems facing the world today, which is also one of serious environmental threats in southwest China. Remote sensing technology offers substantial information for assessment of desertification. Based on remote sensing technology, our study aimed to extract the sandy land information and map the land cover classification in Otindag sandy land. We proposed a new sandy land extraction index and a new sandy land classification model to extract and classify sandy land at different times and levels on the basis of object-oriented classification. First, we segmented the image of study area using optimal segmentation scales evaluated by ESP2 in eCognition. The results show that the optimal segmentation scales for sandy land, shrub, and herb were 200, 145, and 185, respectively. Then in order to extract sandy land, we proposed the Ratio Soil Brightness Index (RSBI). Compared with SBI, RSBI can avoid the misclassification between water body and non-sandy land and hence had higher precision. In order to avoid the misclassification between the fixed sandy land and areas with relatively high vegetation coverage, we extracted sandy land at different times and levels. We first used RSBI to extract sandy land in the winter image. The index of MSAVI was introduced to derive the coverage of vegetation, named as FMSAVI. FMSAVI and Albedo were selected to construct two-dimensional feature space in sandy land area extracted by RSBI in the summer image. After normalization of FMSAVI and Albedo, a liner regression analysis was performed. Based on this, a Desertification Classification Index (DCI) was developed. The DCI was a collection of lines perpendicular to the fit line. Different positions of the lines mean different sandy land classifications. A map of sandy land classification was generated and we grouped sandy land into three classes, namely shifting sandy land, semi-fixed sandy land, and fixed sandy land. Our result show that the overall accuracy of DCI model was 83.24%, higher than traditional methods using modified vegetation coverage (67.04%) and NDVI-Albedo feature space (77.65%) to classify sandy land. We proposed the RSBI to extract sandy land in the winter image and constructed FMSAVI-Albedo feature space to classify sandy land in summer image. These two indexes improved classification accuracy. Our methods are simple, robust, powerful, and easy to use for the extraction and classification of sandy land.
In recent years, with the rapid development of the city, a large number of people turn to work and live in the city, resulting in an increasing number of urban buildings. Land resources and urban ecological environment (such as green space) are threatened to some extent. Thus, it is urgent to plan urban land resources and space reasonably, prevent illegal construction, improve urban living environment, and make the city sustainable, orderly, healthy, and green. With the high-resolution remote sensing image data becoming more and more abundant, accurate building extraction using high-resolution remote sensing images plays an important role in urban planning, urban management, and change detection of urban buildings. Based on the U-Net network model, using the Massachusetts building dataset, this paper explored the network model structure and proposed a network model called FE-Net with "encoder-feature enhancement-decoder" structure and ELU activation function. First, the best basic network model called U-Net6 was found by comparing the building extraction results using U-Net5, U-Net6, and U-Net7 with different number of network layers. Based on the U-Net6, the network model of "U-Net6+ReLU+feature enhancement" was established by adding the structure of feature enhancement. In order to optimize the activation function, the ReLU activation function was replaced by the ELU activation function, and then the network model called FE-Net (U-Net6+ELU+feature enhancement) was created. The FE-Net network model was compared with the building extraction results from the other two network models (U-Net6+ReLU and U-Net6+ReLU+feature enhancement). Results show that the FE-Net network model had the best building extraction performance. Its relaxed F1-measure reached 97.23%, which was 0.36% and 0.12% higher than the other two network models. Meanwhile, FE-Net also had the highest extraction accuracy compared with other studies using the same dataset of Massachusetts. The FE-Net network model can extract multi-scale buildings better, which can not only extract small-scale buildings accurately, but also roughly and completely extract buildings with irregular shape with relatively less missing and wrong detections. Thus, the FE-Net network model can be used to achieve end-to-end building extraction with a high accuracy.

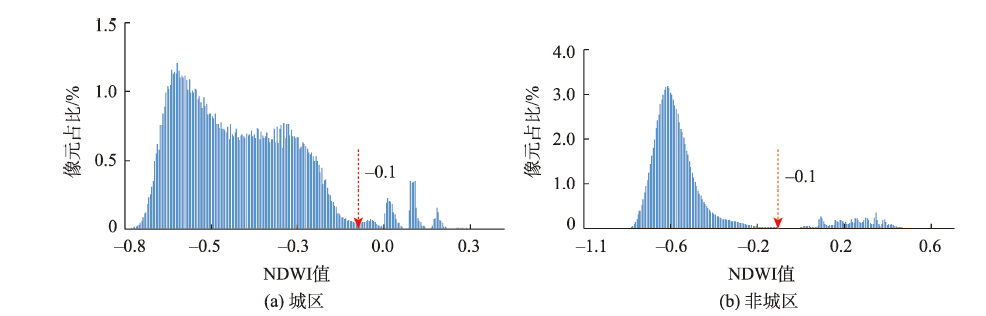
Rapid and accurate extraction of water information from satellite images has been a hot issue in remote sensing applications and has important application value in water resources management, water environment monitoring, and disaster emergency management. Although there are a variety of water extraction methods for Landsat series images, the same method can generate different extraction results in different environmental backgrounds due to the influence of environmental background factors such as geographic location, topography, and water body shape. In order to study the applicability of water extraction methods under different environmental conditions, this article focuses on two typical environments: urban areas around Huairou County, Beijing with severe human influence and strong contrast between light and dark images, and non-urban areas around Beijing Miyun Reservoir with obvious topography and small water bodies. Water index method and classification method are tested based on water extraction and accuracy verification using Landsat 5 (2009) and Landsat 8 (2019) satellite images which have slightly different band settings. The water index method includes Normalized Difference Water Index (NDWI) and Modified Normalized Difference Water Index (MNDWI), while the classification method includes Support Vector Machine (SVM) and Maximum Likelihood (ML). Our results show that SVM has the highest accuracy with overall accuracy > 97% in the urban areas. By selecting training samples reasonably and delicately, the extracted spatial pattern of water results is close to the real water distribution. It applies well to multiple-scale and complex water bodies. In the non-urban areas, SVM can completely identify the fine rivers which are usually difficult to be identified by other methods. It is also suitable for judging the shape and flow direction of small rivers between mountains, though the shadow of the mountain could be easily mixed together by mistake. Due to the difference in sensor band settings, SVM has a better performance in Landsat 8 data. MNDWI can effectively reduce the error extraction rate, resulting in an overall accuracy > 95%. It is convenient to determine the threshold value of MNDWI through visual interpretation, which is more suitable for the rapid extraction of water in the non-urban areas. The environmental background may show different effects on water body extraction. The water index method and classification method have different advantages in different environmental backgrounds. The most suitable method should vary according to the actual situation. In scenarios with higher requirements for efficiency, we should focus on the use of index method, and design a new index which can make full use of the band information. In application scenarios where higher extraction accuracy is required, classification methods can improve the accuracy of water extraction. Moreover, we cannot ignore the differences between interpretation methods in data sources from different sensors. This study provides a reference for the selection of water extraction methods under different environmental backgrounds.
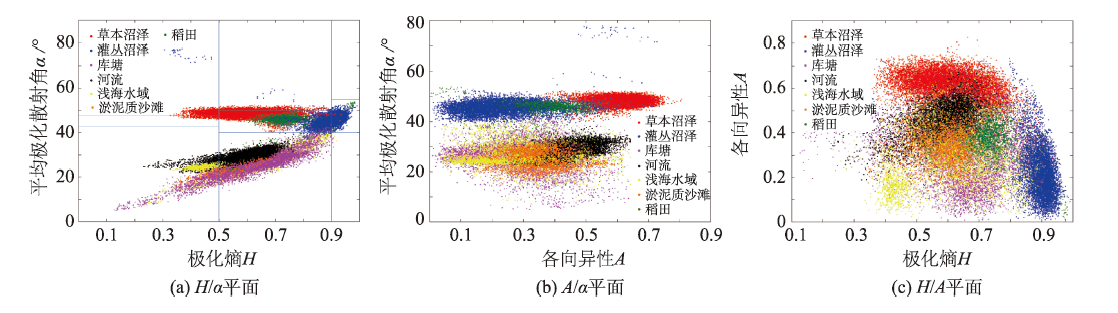
Rapid and accurate classification of wetland features is the basis of accurate wetland monitoring. The key to improve the classification accuracy is to select the best polarization characteristics combination among many polarization characteristics. And in order to further study the influence of significant polarization characteristics of wetland features on classification results, a classification method based on the polarization decomposition characteristics of typical features in this area is proposed. In this method, the optimal polarization characteristics are selected and combined from a variety of polarization decomposition methods under the criteria of feature selection factors and so on by using the box plots, and then the classification is realized on this basis. Firstly, in order to simplify and reduce the speckle noises of PolSAR (Polimertice Synthetic Aperture Radar) image, the original four polarization images are processed by reciprocity, and the three polarization images after reciprocity are processed by multi-looks processing and Refined Lee filtering. Secondly, the data are decomposed into six kinds of polarization decompositions, such as Cloude-Pottierde decomposition and Paulide decomposition, and the polarization characteristics are extracted according to the decomposition results. Thirdly, the correlation between the above polarization characteristics and the scattering mechanism of typical features of Shuangtai Estuary wetland is analyzed in detail by using the box plots, Cloude-Pottier plane scatter plots and power mean scatter plots, and some polarization characteristics are selected under the criteria of feature selection factor, feature judgment factor, H/α plane, A/α plane, H/A plane, mean and standard variance. The selected polarization characteristics are combined. Finally, on the basis of the optimal polarization characteristics combination, the Support Vector Machine (SVM) classifier is designed to achieve the optimal classification of wetland features. Shuangtai Estuary, located at the estuary of Liaohe River in Panjin, Liaoning Province, is known as the "world's largest reed field". In order to verify the effectiveness of the optimal polarization characteristics combination, the C-band Radarsat-2 full polarization data in July, 2016 are utilized as experimental data. Through the qualitative and quantitative analysis of the proposed and the compared algorithm, the conclusions are as follows: the polarimetric entropy H, average alpha angle α and anisotropy A of the Cloude-Pottier decomposition, the single-bounce scattering of MCSM (Multiple-Component Scattering Model) decomposition, T33 of Pauli decomposition, the single-bounce and the double-bounce scattering of Yamaguchi3 decomposition are the optimal polarization characteristics on the one hand, and on the other hand, the optimal polarization characteristics combination can not only reduce the data redundancy and the calculation, and improve the classification efficiency, but also accurately represent the features and improve the producer's accuracy of each wetland category, the overall accuracy and kappa coefficient. Among them, the producer's accuracy of the wetland features has increased by 1% to 5%, the overall accuracyand kappa coefficient can reach 94.25% and 93.63% respectively.
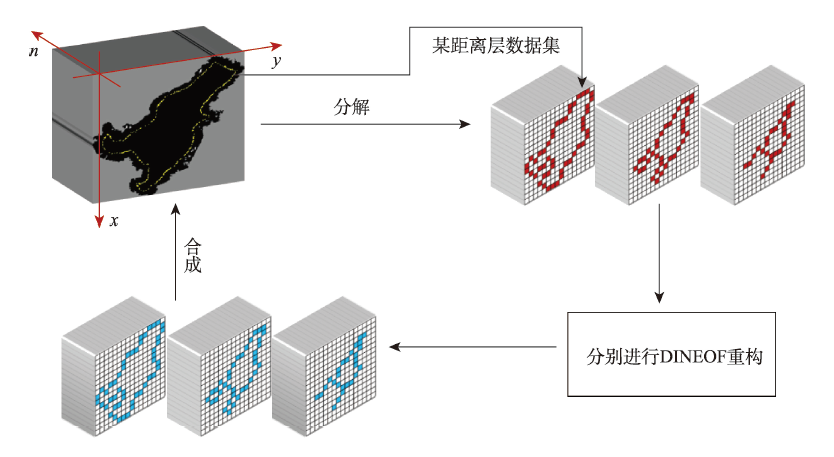
Chlorophyll a (chl-a) is an important parameter of water color in marine environment. Quantitative observation from satellite remote sensing is the main way to obtain large-scale oceanic chl-a. However, due to the influence of cloud and fog coverage, data missing is a common phenomenon in satellite remote sensing chl-a products, which greatly reduces the application effect of data. The data-interpolating empirical orthogonal function (DINEOF) method is currently the most widely used data interpolation and reconstruction method for time series data. In this study, a layered reconstruction method for Bohai Sea chl-a (SDS-DINEOF) is designed to address the shortcoming of excessive smoothing at fine scales using the DINEOF method. This method utilizes the distributional characteristics of Bohai chl-a, that is high values in the nearshore and low values in the central water, and divides the Bohai Sea into 32 equidistant regions. We reconstruct the missing data of the daily Bohai GOCI satellite chl-a products at 10:13 a.m in each region separately using this method. The reconstructed results were compared with the DINEOF results. The results show that: (1) Both the SDS-DINEOF and the DINEOF methods can reconstruct missing data completely. The reconstruction results of the former have more detailed information than the latter. The seasonal average results of SDS-DINEOF show that the value of chl-a in the Bohai coastal waters is generally high, while the value of central water is low in summer and autumn, and high in winter and spring; (2) The SDS-DINEOF has a higher overall reconstruction accuracy and reconstruction efficiency compared with the DINEOF. The average accuracy is increased by 3.52%, and the reconstruction time is saved by 125%. The reconstruction accuracy of each layered region has been improved, with the most significant improvement in the 31st and 32nd floors located at the central water in Bohai Sea. The reconstruction accuracy of most single images in the time series has been improved. The reconstruction results of chl-a images in July and August 2019 are significantly improved; (3) As the data missing rate increases, the reconstruction accuracy and efficiency of DINEOF and SDS-DINEOF will both decrease, though the reconstruction accuracy and efficiency of the SDS-DINEOF method are always higher than that of the DINEOF method; (4) During the construction process, the interpretation rate of the data and the reconstruction time by the best model of each layer are restricted and affected by the reconstructed sub-data set itself. The results obtained in this paper have important theoretical and practical significance for improving the quality of marine remote sensing data products.
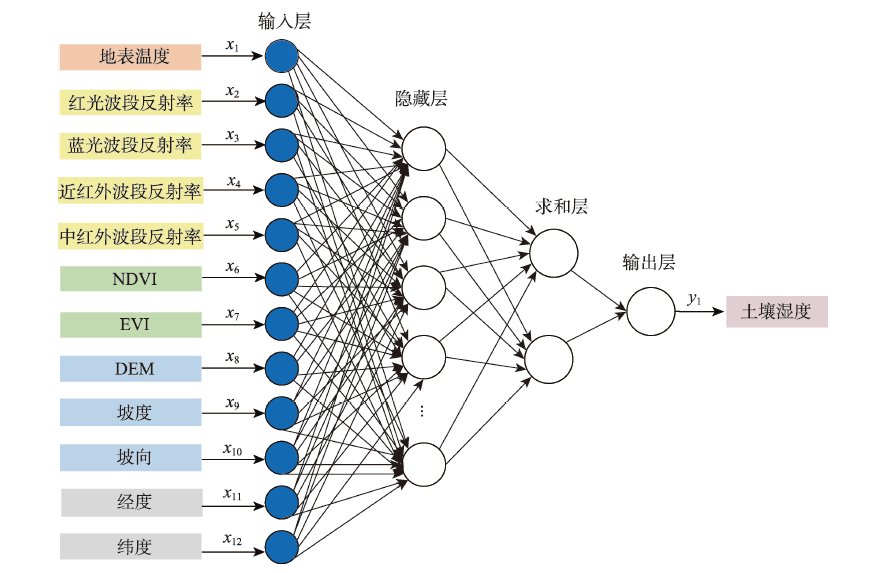
Surface Soil Moisture (SM) plays an important role in the land-atmosphere interaction and hydrological cycle. Low spatiotemporal resolution (i.e., 25~40 km and 2~3 days) microwave-based SM products such as the Soil Moisture and Ocean Salinity (SMOS) and the Advanced Microwave Scanning Radiometer for EOS (AMSR-E) limit their application in regional scale studies. The Soil Moisture Active Passive (SMAP) and Copernicus Sentinel 1A/B microwave active-passive surface soil moisture product (L2_SM_SP) has a higher spatial resolution (3 km), but its temporal resolution is coarse from 4 to 20 days due to the narrow overlapped swath width. In this study, we developed a machine learning algorithm using the General Regression Neural Network (GRNN) to improve the spatiotemporal resolution of the L2_SM_SP product based on multi-source remote sensing data. Land Surface Temperature (LST), Multi-band Reflectance, Normalized Difference Vegetation Index (NDVI), Enhanced Vegetation Index (EVI), Elevation, Slope, Longitude (Lon), and Latitude (Lat) were selected as input variables to simulate the L2_SM_SP soil moisture in GRNN model. Results show that: (1) GRNN-estimated soil moisture and the original estimates of L2_SM_SP were strongly correlated (r=0.7392, RMSE=0.0757 cm3/cm3); (2) the correlation between GRNN estimates and original L2_SM_SP product at typical dates of different seasons varied a lot. The correlation in spring was the lowest (rSpr=0.6152, RMSESpr=0.0653 cm3/cm3). While the correlation in winter was the strongest (rWin=0.8214, and RMSEWin=0.0367 cm3/cm3). The correlation in summer and autumn was close to each other (rSum=0.6957, rAut=0.7053, RMSESum=0.0754 cm3/cm3, and RMSEAut=0.0694 cm3/cm3); and (3) in 2016, the soil moisture in summer and autumn of the study area was significantly higher than that that in other seasons. In terms of spatial distribution, the soil moisture in the Bashang plateau area was low, while the soil moisture along coastal areas was obviously higher. In this study, we successfully improved the spatiotemporal resolution of L2_SM_SP product over Beijing-Tianjin-Hebei region from 3 km, and 4~20 days to 1 km, and 1 day. Its spatial coverage was also extended. The improved soil moisture product is of great significance for future eco-hydrological assessment, climate prediction, and drought monitoring in Beijing-Tianjin-Hebei region.