The most direct and effective way to distinguish geographical entities is to delineate their boundaries. At present, the delineation of the geomorphic boundary of the Loess Plateau is mostly based on classification boundaries and natural division boundaries. Based on different data sources and their expressions, this article reviews the previous research progress on the demarcation of the natural geographic boundary of loess landform types and summarizes the connotation of loess landforms boundary from morphological genetic geomorphic classification, digital geomorphic classification, and other classification systems. The advantages and disadvantages of quantitative description based on natural language and digital environment are analyzed. Besides, we sort out the quantitative identification and classification methods of the Loess Plateau landform types based on digital terrain analysis. Furthermore, we discuss and prospect the geomorphic boundaries from three aspects: (1) the relationship between the determination of the landform boundary and the classification system; (2) the reference of the delineation of the landform boundary; (3) the scale effect of the landform boundary. This review summarizes the background of the relevant theoretical studies on loess geomorphic regionalization and provides the theoretical basis and support for local practical work.
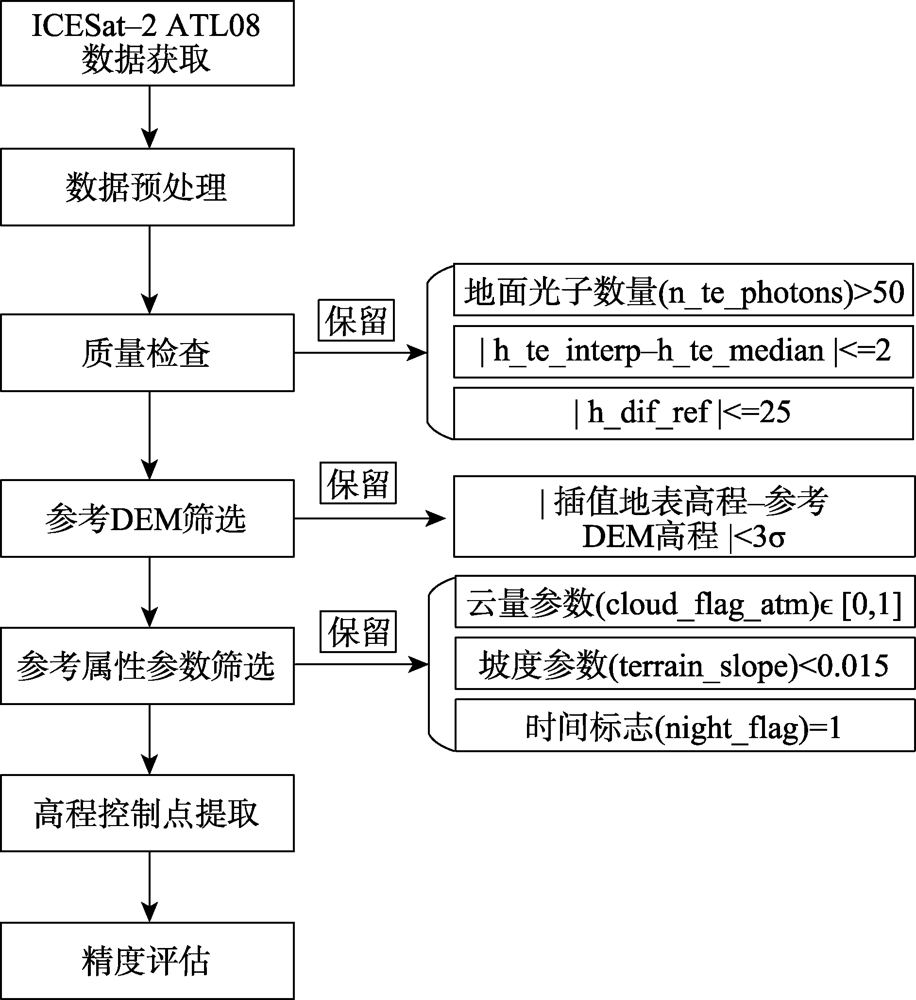
The horizontal positioning accuracy of ICESat-2 (Ice, Cloud, and land Elevation Satellite-2) data reaches the meter level, and the plane positioning accuracy reaches the sub-meter level. Nevertheless, it is inevitable that poorly accurate laser footprint cannot be used as elevation control point due to various external factors. Therefore, this paper proposes a technique that employs multiple parameters to extract high-precision elevation control points from ICESat-2 data. At first, this method utilizes the built-in parameters to check the quality of the laser footprint point data, eliminating abnormal laser footprint points. The second step is to remove the elevation error in reference to the built-in Digital Elevation Model (DEM) data. The final step aims to set thresholds for fine screening to reserve the elevation points that meet the criteria of quality inspection, small slope, and low cloud cover based on attributes parameters such as cloud cover marker, slope parameter, and a time marker. Moreover, high-precision reference elevation data are also used to verify the selected elevation control points. To verify the effectiveness of the proposed technique, we employed the ICESat-2 laser data from western Zhengzhou, southwestern part of North Kodata, and northern Indiana (mean absolute height elevation is 3.711 m, 0.582 m, and 0.333 m, respectively) to extract elevation control points. Experimental results show that the mean absolute errors of laser footprints were 0.827 m, 0.393 m, and 0.131 m after screening, respectively. The extraction method can extract a certain number of high-precision elevation control points in multiple terrain scenarios. It also provides data support for 1:50 000 and 1:10 000 stereo mapping and offers references to the elevation control points extraction and elevation control point database construction throughout China or around the globe.
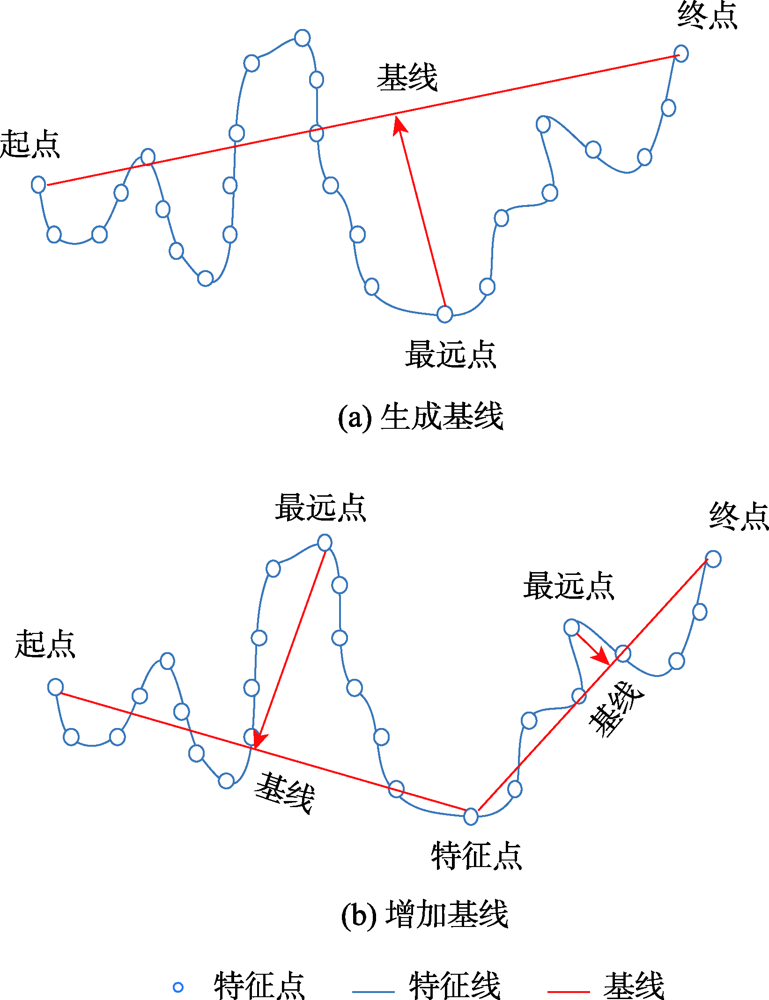
The purpose of terrain simplification is to use the least effective terrain information to express multi-scale terrain, in order to solve the contradiction between massive terrain data and computer hardware and meet the needs of multi-scale terrain applications. Most of the existing terrain simplification algorithms can hardly take into account both the local detailed features and overall features of the terrain. In order to keep the main features of the terrain at different scales, it is necessary to select a suitable terrain simplification method to extract the structural feature information of the terrain. The traditional 3D Douglas-Peucker algorithm, which is a commonly used algorithm, simplifies terrain by setting distance threshold parameters. However, only main terrain features such as ridgelines and valley lines are retained, areas with obvious local terrain undulations have not been taken into consideration in the simplified terrain. The Centroidal Voronoi diagram, which is an important data structure, can use the terrain factor as the density function and drive the seed points to the areas with large terrain undulations through iteration, but it has deficiencies in the representation of major topographic features. To address these deficiencies, an optimized algorithm that combines the advantages of 3D Douglas-Peucker algorithm and centroidal Voronoi diagram is proposed in this paper. Firstly, overall terrain feature points, which form the main frame of the terrain, are extracted at different scale by changing the distance threshold parameters of traditional 3D Douglas-Peucker algorithm. Then, points with large local undulations that reflects local topographic undulations are acquired by setting terrain undulations as density function while generating centroidal Voronoi diagram using Lloyd’s algorithm. Also, different amount of seed points are set to satisfy the demand of different simplification level. Meanwhile, the proportion of the two types of feature points can be modified to fulfill different level of attention to the overall and local terrain information. Combining the overall terrain feature points obtained by the traditional 3D Douglas-Peucker algorithm with the points with large local undulations obtained by centroidal Voronoi diagram, the proposed algorithm simplifies terrain by considering both the main structural features and local undulations. Finally, comparison analysis is designed and conducted at different simplification levels. Results show that, compared with the traditional 3D Douglas-Peucker algorithm, the proposed algorithm that is optimized using centroidal Voronoi diagram approximates the original terrain better and has a higher accuracy of terrain representation. The optimized algorithm reduces the simplification error by more than 13.6% at each simplification level.
POI (Point of Interest) identifies geographic objects by location and name. Its quality is the basis for ensuring the accuracy of map services such as path planning and navigation, including location accuracy, semantic integrity, logical consistency, etc. Normally, the spatial positional accuracy of point elements obtained by traditional surveying and mapping methods is high and the attributes are complete, but the update cost is high, and the cycle is long, which makes it difficult to meet the requirements of current data. The POI data obtained by the crowdsource method has a strong current situation. However, it has the characteristics of disorder and lack of standard, which can lead to inaccurate spatial position, lack of semantic attributes, inconsistent spatial relationships, and so on. There is an urgent need for effective optimization methods to solve the quality problems of POI data e. This paper analyzes the influencing factors of POI location labeling from the perspectives of space, topology, and semantics, puts forward the POI location labeling principle considering the spatial and semantic correlation, designs a location optimization method with multi-stage constraints, and conducts a verification analysis. Compared with the manual correction method, the optimization method based on the location labeling principle proposed in this paper reduces the influence of manual experience differences on the optimization results and ensures the consistency of the optimization standards. The POI location optimization experiment is carried out using a street area as the analysis area. The results show that the location optimization method proposed in this paper can effectively reduce the mislabeling rate (19.3%), improve the identifiability (6.7%), and effectively improve the sub-region POI distribution and roads. The consistency of distribution can effectively improve the recognition speed of different semantic POIs. However, there are still many processes that need to be carried out manually, such as the completion of POI classification features, road and building data cleaning, etc., making the method in this paper difficult to be applied on a large scale, which would be an research issue for follow-up researches.
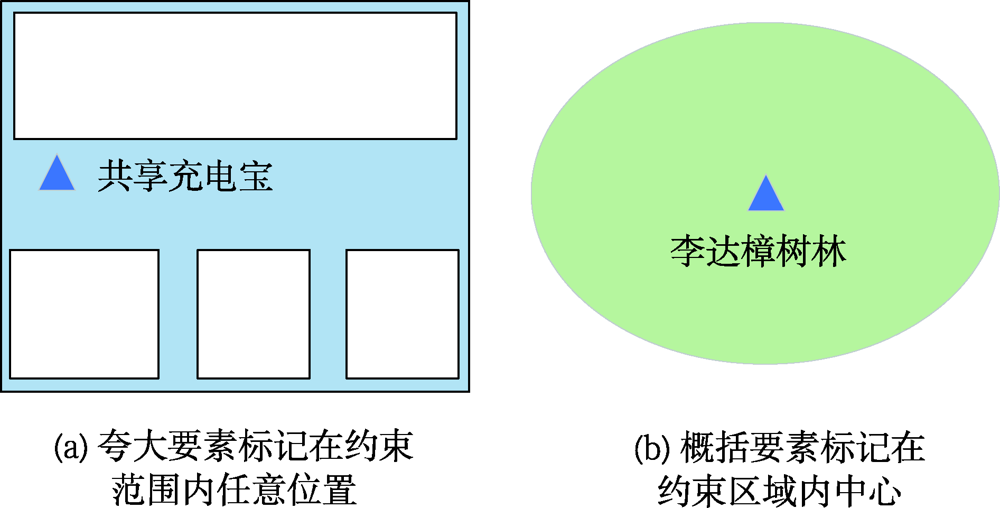
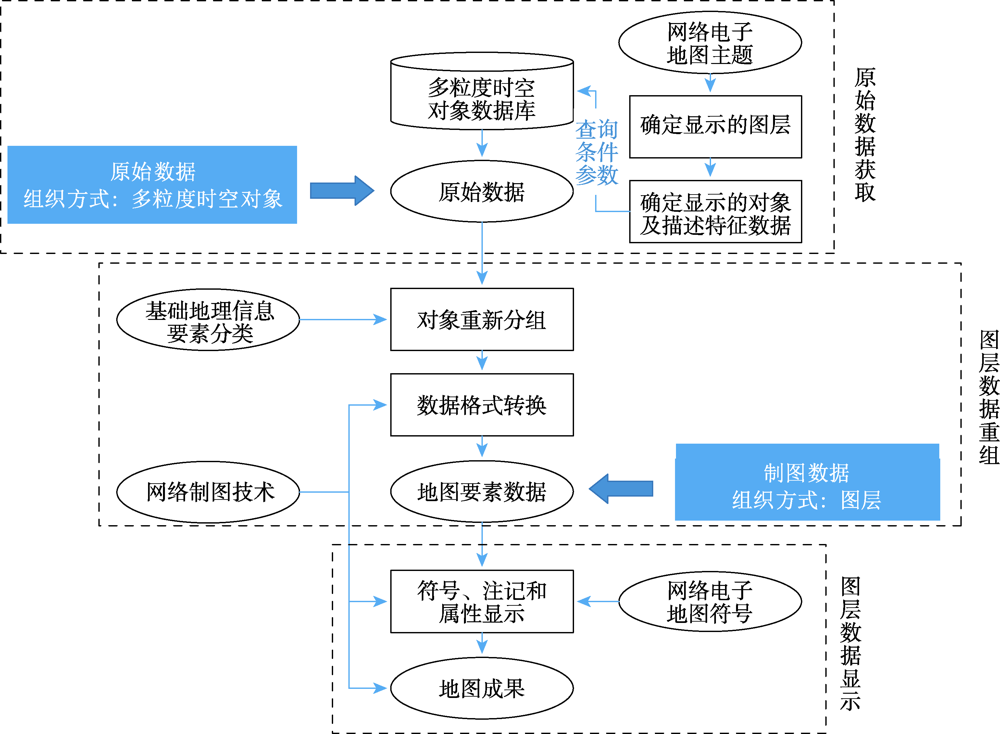
Traditional web electronic map is a composition of several layers containing geometry elements, which rely on an object-oriented model. However, this model is too abstract to map a more complex world. So the maps based on this model have limitations in expressing the characteristics of dynamic changes and correlation of geographical entities. Domain experts have proposed the data model of Multi-Granularity Spatio-Temporal Object (MGSTO) in recent years, aiming to solve problems of mapping the real world to the “thing space” which is full of “objects”. This inspires new visualizations on the spatio-temporal phenomenon, at the same time, changes the way of map making. Visualizations or maps based on this data model have access to data that are more reliable. The problem is that there is no such map making technique or tool that can deal with it. Therefore, we propose two map marking methods that can make full use of this data model. Firstly, we think it is necessary to bridge existing web cartography platforms and the MGSTO database, so we propose the layer-reconstruction method. In this way, all the online mapping platforms have the ability to understand the data model of MGSTO and make maps depending on it. This method looks like a "middleware" of online mapping tools. Secondly, we propose a method that binds MGSTO onto HTML DOMs, for example, Scalable Vector Graphic(SVG) objects. The MGSTO data is visualized directly into graphic elements (or symbols) and its changes and transforms can be easily reflected onto symbols. The advantage of this method is that updating maps is synchronized with database updates. Maps made by this method can be linked to the real world due to the data model of MGSTO, which has the ability to manage multi-scale features. More complex information such as relation and composition can be easily extracted from the data model of MGSTO, which can be further mapped as thematic maps. Multi-granularity features can be shown by this method. Each of these two map making methods has distinct characteristics. The first method provide mature and stable style of geographic data visualization, and it can be published online easily because it use online infrastructure provided by online mapping platforms. The second method provide map makers more freedom in map design. Users can perfect the data model of MGSTO targeting certain map making objectives. However, more algorithms such as generalization need to be developed for the data model of MGSTO. In addition, this research carries out two experiments using the same dataset to verify our methods, which demonstrates the feasibility our proposed methods.
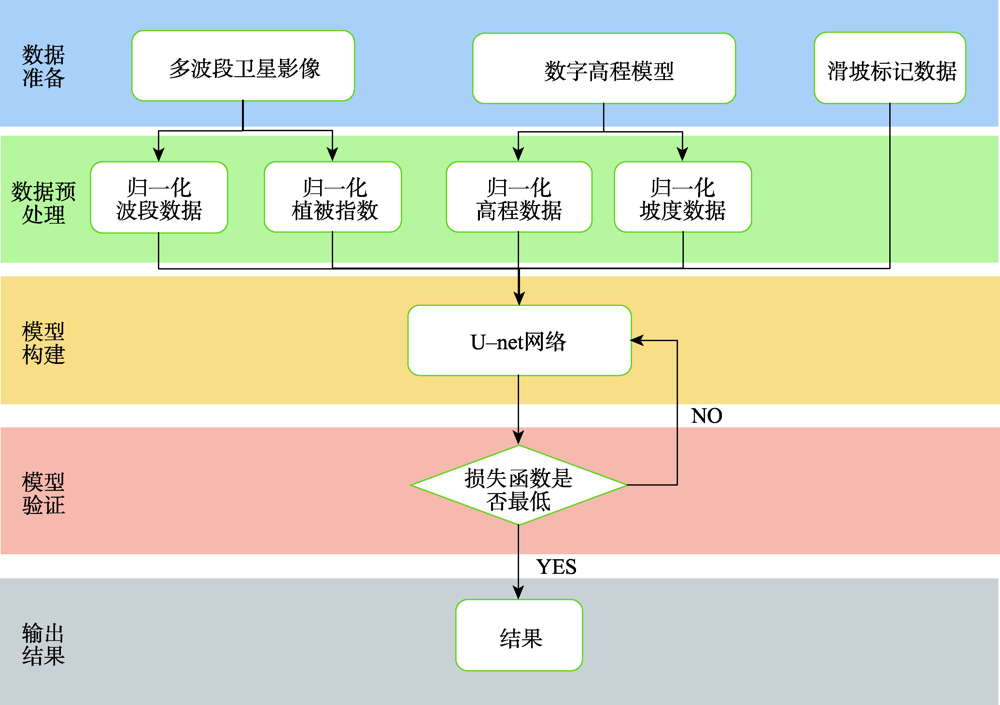
Landslide identification is a fundamental work in geological survey. Characterizing the distribution of earthquake-induced landslides can help define where areas are prone to landslides and where areas are safe, which is important for subsequent post-earthquake reconstruction. At present, the co-seismic landslide is usually identified by remote sensing interpretation and field survey based on color changes and textual characteristics such as crown cracks, accumulation, and flank. However, the identification and segmentation of large-area earthquake-induced landslides often takes a lot of time and resources, making it difficult to provide timely relevant data to rescuers in disasters. Recently, the combination of Google Earth Engine (GEE), Colab, and Cloud storage provides new technique support for post-earthquake landslide interpretation. Remote sensing images can be quickly extracted in GEE, learned in the Colab platform, and stored in Cloud storage. Based on these technologies, a U-net model built on Tensorflow was integrated in the GEE to identify co-seismic landslides of Wenchuan. We tested three combinations of different remote sensing data to identify landslides, namely Landsat 5 (LT05), LT05+slope+DEM, and LT05+slope+DEM+NDVI. The results showed that all these three combinations had an accuracy of 0.71~0.87, precision of 0.66~0.75, recall of 0.29~0.57, and mIoU of 0.50~0.64. Due to the complexity of landslides in remote sensing images, the U-net model still resulted in misclassification and cannot replace human interpretation completely. However, this model can help us in interpreting earthquake-induced landslides to some extent. From the detailed images, there is a high possibility for areas that have been marked as landslides, but there may also be a large number of landslides for areas that are not marked as landslides. The accuracy and precision increased about 1% in all three data combinations with the increasing number of parameters, but the number of false positives also increased with the increasing number of parameters. The NDVI, a derivative image from LT05, enhanced learning efficiency and accuracy, which indicated that the prior knowledge was very important in a neural network model. By comparison, the model can segment large-scale landslides well in the case of using the combination of LT05+NDVI+DEM+slope. However, due to the limited image resolution, the segmentation accuracy of small landslides was still not good. We need higher spatial resolution images to improve segmentation accuracy. This study demonstrates the computation efficiency of the GEE+Colab+Cloud storage platform, which provides a technique support for researchers to conduct object recognition quickly using remote sensing data based on neural networks.
High Density Lipoprotein Cholesterol (HDL-C) can effectively promote the metabolic efflux of cholesterol in human body, and its level is negatively correlated with the risk of cardiovascular disease, which is a preventive and protective factor of cardiovascular disease. It is of great significance to clarify the geographical characteristics and environmental factors of HDL-C level in middle-aged and elderly population in China. Based on the longitudinal survey of middle-aged and elderly people in China, this paper uses global spatial autocorrelation and cold hot spot analysis to explain the spatial characteristics and trends of HDL-C levels in middle-aged and elderly people in China. At the same time, the random forest regression model and multiple linear regression method are compared to explore the environmental factors influencing the spatial distribution of HDL-C level. The results show that the HDL-C level of middle-aged and elderly population in China is higher in females than that in males, and higher in rural areas than that in urban areas, with obvious regional differences. The overall distribution pattern is "low in the north and high in the south, with transition in the middle". In addition, there are low value aggregation areas in Inner Mongolia, Hebei, and Liaoning in the north and high value aggregation areas in Guangdong, Guangxi, and Yunnan in the south. The SO2, NO2, precipitation, air pressure, PM10 and PM2.5 are the main environmental factors affecting the different distributions of HDL-C level in middle-aged and elderly population. Among them, high concentration of air pollutants is the risk factor of low HDL-C value, while abundant precipitation and low-pressure environment are the protective factors to prevent and control low HDL-C value. Therefore, the prevention and control of HDL-C dyslipidemia should pay attention to its spatial distribution throughout the country in the future, focusing on strengthening the monitoring of HDL-C low value areas, so as to achieve the purpose of adjusting measures to local conditions and accurate prevention and control.
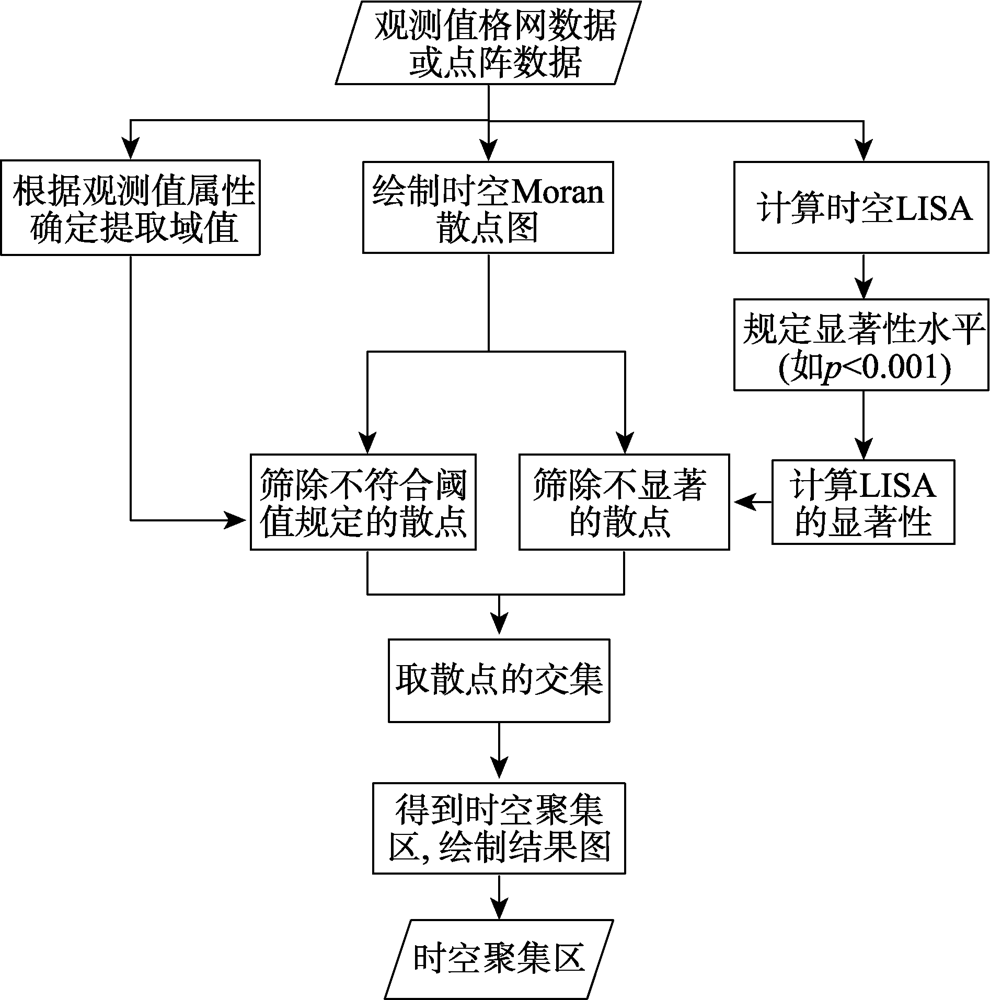
Drought, as one of the most difficult natural disasters to identify, causes the most serious economic losses in the entire natural disaster system. Drought in spatio-temporal aggregation areas deserves more attention than its changes and patterns because it usually causes greater damages. SaTScan provides a method for identifying spatio-temporal aggregation areas of disaster. However, there are also some defects, such as difficulty in parameter setting and inefficiency in boundary identification. For instance, the maximum scanning window in SaTScan needs to take many attempts to get a fine result. Moran scatter plot provides a method for the identification of spatio aggregation areas, which could solve problems that SaTScan faces above, but it could only identify aggregation areas in space. In this study, we proposed a method named Spatio-temporal Moran Scatter Plot based on Moran scatter plot and Local Indicators of Association (LISA), which could select scatters according to the threshold of concerned phenomenon and the LISA confidence level required by the researcher. This method plotted scatters in spatio-temporal coordinate system to get the spatio-temporal aggregation areas. This study took droughts in China from 2009—2014 as an example to identify the spatio-temporal aggregation areas, the results showed that:(1) Spatio-temporal drought aggregation areas identified by the proposed method were almost consistent with the truth, which demonstrated the effectiveness of the method. Besides, compared with the spatio-temporal scanning method, the method proposed in this study was not only easier in parameters setting but also clearer and more accurate in boundary identification; (2) The large-scale, strong drought spatio-temporal aggregation areas occurred in 2009 and 2011. In 2009, the main aggregation areas concentrated in Shanxi, Shaanxi, Beijing-Tianjin-Hebei, eastern Tibet, northeastern Inner Mongolia, Liaoning, Jilin, and Yunnan-Guizhou-Sichuan area; in 2011, the main aggregation areas concentrated in Huanghuai area, the middle and lower reaches of the Yangtze River, and Yunnan-Guizhou-Sichuan area. The local-scale, strong drought spatio-temporal aggregation areas occurred in 2010 and 2014. In 2010, the main aggregation areas concentrated in Yunnan-Guizhou-Sichuan area; in 2014, the main aggregation areas concentrated in Eastern Inner Mongolia, Liaoning, and other areas in Northeast China. The slight drought spatio-temporal aggregation areas occurred in 2012 and 2013. In 2013, some mild drought clusters occurred in western Inner Mongolia, southern Gansu, Ningxia, southern Shaanxi, and northern Henan. In general, the spatio-temporal drought aggregation areas concentrated mainly in Yunnan-Guizhou-Sichuan, Northeast China, Huanghuai Region, and the middle and lower reaches of the Yangtze River.
Urban traffic violation behavior plays an important role in traffic accidents. Analyzing the spatial and temporal distribution of traffic violation behavior can support related decision makings for traffic management and the optimization of the surroundings of the hotspots. Due to the limitation in data acquisition, existing studies paid little attention to the variation of the spatial and temporal patterns between different violation behavior types. There is a lack of analysis framework to support the decision makings in traffic violation behavior treatment. In this study, we propose a traffic-violation-behavior treatment-oriented analysis framework based on the spatial and temporal hotspot approach. Two analyses are designed and conducted to support the traffic violation behavior treatment: (1) analyzing the temporal pattern of each spatial hotspot to support the reasoning analysis and precise treatment policy makings at the local scale; (2) analyzing the spatial pattern of the hotspots during typical periods (e.g., morning and evening rush hours) to support the reasoning analysis and the optimization of the allocation of police resources on a global scale. We use a dataset of Fuzhou city acquired in 2017 to verify the proposed method. The spatial and temporal patterns of the motor traffic violation behavior and the non-motor type are analyzed and compared. We find that: (1) the traffic violation behavior exhibits a double peak hourly pattern at 9:00 am and 4:00 pm during a day, respectively. The morning peak is obviously higher than the evening peak. The traffic violation behavior more likely happens during weekdays than weekends; (2) the traffic violation behavior mainly concentrates at the core-built area within the second ring highway and several hotspots in the suburban area including the shopping mall of Cangshan Wanda and the exit of the Kuiqi tunnel oriented to Mawei; (3) motor and non-motor traffic violation exhibit different temporal and spatial patterns. Non-motor traffic violation frequencies exhibit both larger hourly and weekday-weekend differences, and mainly concentrates at the road crosses with big traffic volume of both motor cars and e-bikes/pedestrian. While the motor traffic violation exhibits more stable patterns across the hours in a day and the days in a week, and mainly happens around the critical places such as large hospitals, shopping malls, and complex overpasses; (4) the spatial scales affect the patterns of the spatial hotspots of the traffic violation behavior. The spatial autocorrelation of the traffic violation increases with the scale size rapidly before 1500 m and keeps around 0.6 afterward. Motor traffic violation exhibits lower spatial autocorrelation than the non-motor. The above findings validate the effectiveness of the proposed method. It can help to guide the construction of the traffic violation behavior treatment platform and further optimize the allocation of the police resources and improve the effectiveness of the law enforcement for the traffic violation behavior.
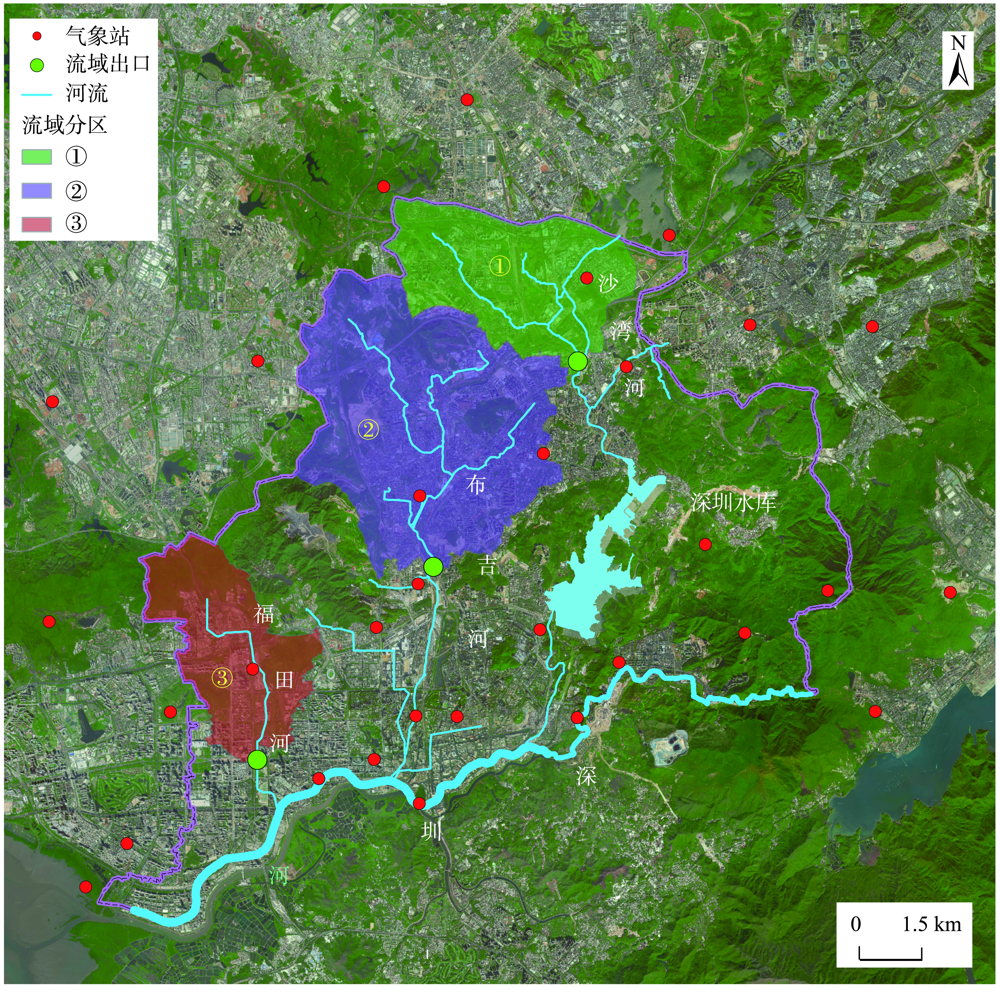
Due to climate change and urbanization, rainstorms are becoming more and more frequent and highly unevenly distributed in urban areas. However, it is difficult to have sufficient monitoring data for rainfall events because of insufficient installments of monitoring stations. Usually, the spatial resolution of meteorological forecast data is still coarse, which leads to the low accuracy of simulation and prediction results from urban flood models. Therefore, it is necessary to improve the spatial resolution of rainfall data to enhance the accuracy of urban flood simulation. In this paper, three catchment basins in Shenzhen River Basin are selected. Analytical data are extracted from 118 rainfall events lasting no less than 5 minutes from 31 meteorological stations within and around the study area during 2018—2020. The discrete observation data from meteorological stations are interpolated into continuous grids. According to the drainage zoning area, the grid size is initially set as 200 m×200 m.The gridded data is then aggregated into 400 m×400 m, 800 m×800 m, 1600 m×1600 m, 3200 m×3200 m, and 6400 m×6400 m to achieve coarser spatial resolution rainfall datasets. The basin boundary is used during the aggregation to ensure that the average rainfall in the basin remains constant. The gridded rainfall data at different spatial resolutions are used as the input of an urban flood model to simulate the flooding processes of outlet sections in three watersheds. The model results of three watersheds are compared finally. By comparing the changes of flood peak at the outlets of each basin, the influence of rainfall spatial resolution on river flood peak is further analyzed by combing the spatial parameters such as rainfall center and basin center. The results of three watersheds show that for 118 rainfall processes, with the decrease of spatial resolution, the amplitude of flood at the watershed outlets gradually increases. When rainfall is evenly distributed in the whole basin, the variation ranges of flood peaks in the three basins are 5.04%, 8.73%, and 7.11%, respectively, compared to the rainfall data with 200 m×200 m grid size. The influence of spatial resolution is strongly correlated with the relationship between rainfall center and watershed geometric center, which strongly relates to the direction from watershed geometric center to watershed outlet. The research provides a reference for improving the accuracy of urban flood models by involving the variable of rainfall, which enable researchers to better assess the risk of river floods.
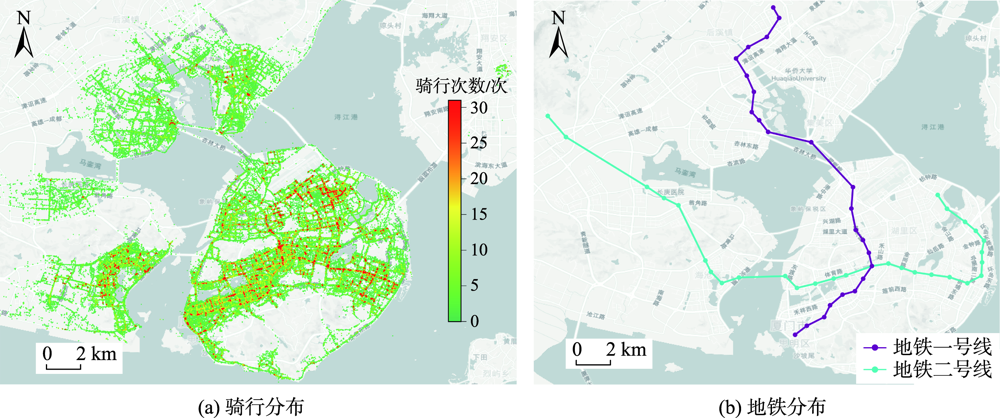
Dockless sharing bicycles are one of the most effective options for connecting to the subway. However, the uneven spatial-temporal distribution of sharing bicycles has caused great inconvenience to users and managers, especially during the morning peak period, which will greatly reduce the operating efficiency of a transportation system. Therefore, studying the characteristics of spatial-temporal distribution of dockless sharing bicycles used to connect to the subway has certain significance for improving the commuting efficiency during the morning peak period. In order to understand the spatial-temporal characteristics of feeder metro riding, this paper takes Xiamen city as the experimental area, takes the riding of feeder metro stations during the morning peak as the main research object, proposes a new method to establish the attraction area of metro stations based on travel OD, and proposes a bicycle clustering method considering metro stations based on travel characteristics. This article also analyzes the overall travel balance of each subway station during the morning rush hour from the perspective of mathematical statistics, tide ratio statistics, and the point of attraction area, and analyzes the spatial-temporal balance of cycling around subway stations at different times during the morning rush hour. Through analysis, the similarities and differences of the balance of each subway station under three perspectives are obtained. The results show that: ①According to the characteristics of the tide ratio, the connection function of the subway station for cycling can be divided into 4 categories: the start type, balanced type, arrival type, and not suitable for connecting to the subway type, reflecting the overall connection characteristics of each subway station; ②The attraction area of the subway station connecting to the riding is different from the characteristics of the tide ratio, and its main influencing factors are the geographic location of the subway station and the surrounding land use type; ③ For the analysis results of the spatial-temporal balance, the tide ratio has no significant impact on the spatial-temporal balance level, and the major influencing factor is the surrounding land use type. The analysis results can reflect the difference in the operation of sharing bicycles that connect to the surrounding subway stations during the morning rush hours in Xiamen and the efficiency of connecting to the subway, so as to support the scheduling and supervision of key areas of bicycle sharing companies.
Population aging is one of the key issues concerned by the current society. Whether the allocation of elderly care facilities is reasonable or not is very important for the improvement of urban quality and the realization of social equity. At present, there are quite a few studies on elderly care facilities, but they mostly conduct analyses from a single perspective of elderly care institutions or community elderly care facilities, and the evaluation content is also limited to the rationality of the number and spatial distribution of facilities, resulting in one-sided research results. This paper utilizes multiple data sources including the data of community-level elderly permanent residents in Wuhan in 2018, the data of elderly care facilities in Wuhan in 2020, road traffic, and other big data. We first integrates community elderly care facilities into the urban elderly care service system, and then comprehensively evaluates the relationship between supply and demand of facilities from the perspectives of elderly care facilities and elderly care services. The results show that: (1) At the regional level, the elderly care facilities in Wuhan show the characteristics of "core edge" of agglomeration in the central urban area and dispersion in the periphery. There are still some problems in the supply level, such as unreasonable quantity hierarchy and large gap in regional allocation level; (2) At the community level, using the two-step mobile search method, this paper finds the matching degree of supply and demand of elderly care facilities in Wuhan: Urban Development Area > Central Urban Area > far urban area; (3) In terms of elderly care services, the supply-demand relationship between medical care and spiritual comfort services in Wuhan is poor, and the facilities generally lack professional service supply, so it is difficult to meet the high-quality and diversified elderly care needs. In view of the existing problems of the matching degree between the supply and demand of old-age facilities and the elderly population, this paper puts forward optimization suggestions from the aspects of system construction, spatial layout, and implementation management, and uses the minimum facility point model to implement the suggestions to the spatial level in order to provide effective reference for the planning of elderly care facilities in similar areas.
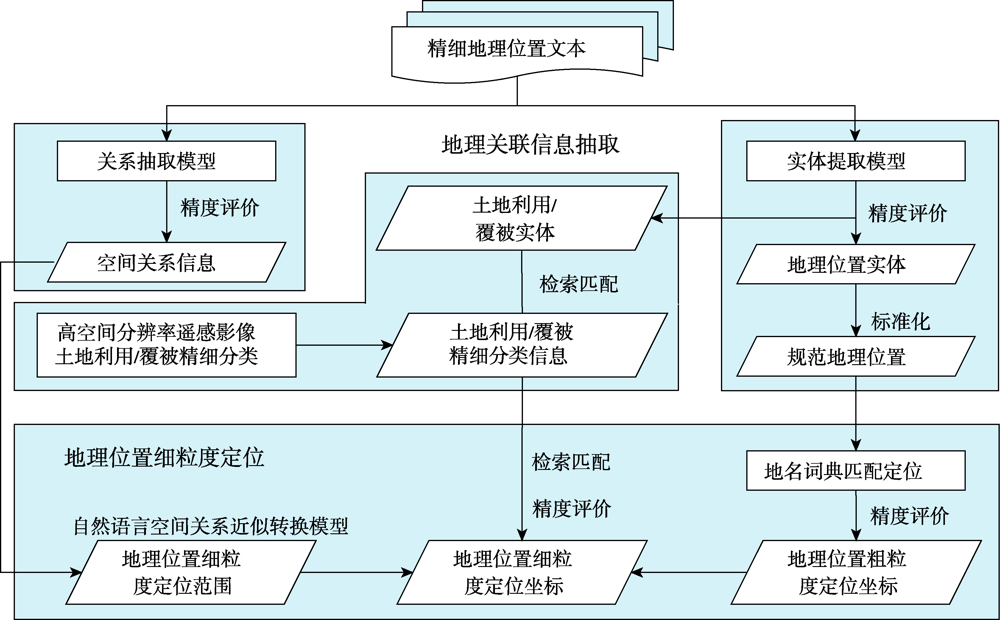
Text data contain rich geographic information. How to mine and spatialize the geographic information embedded in text data through linking the geographic location text with its spatial location in the real world is fundamental for utilizing geographic information. However, as the semantic granularity of geographic location in texts is too raw to be directly used in most cases. It becomes a major challenge for geographic knowledge services to achieve fine-grained geolocation of texts by effectively integrating geographical information with other related features such as land use/cover. The existing geolocation methods, including geocoding, place name retrieval, and fuzzy area modeling, have been widely used to decode non-urban geographic location texts without considering land use/cover information. These methods usually failed to precisely extract geolocation in texts on wildlife activities. In this study, we proposed a fine-grained geolocation method through the inclusion of land use/cover information in texts on wildlife activities. This method employed a natural language spatial relationship approximation conversion model to determine a fine-grained geolocation domain by integrating geographically relevant information (including geographic location entities, land use/cover entities, and spatial relationships), fine classification of land use/cover, and coarse-grained matching geolocation. The coordinates of fine-grained geolocation were determined by iteratively searching and matching within the fine-grained geolocation domain by combining the natural language form of land use/cover entities and fine land use/cover classification map. Our experiments were conducted using texts information of the wild Asian elephants' activities/accidents occurred in southern Yunnan Province of China. The quality of geolocation in the experiments was evaluated using matching level and location accuracy. The results show that the method proposed here can soundly mine fine-grained geolocation of texts on wild Asian elephants' activities/accidents. By mining and analyzing the texts on Asian elephants' activities/accidents in an area with frequent human-elephant conflict in 2020, fine-grained geolocation of the examined Asian elephants' activities/accidents was accurately extracted. Compared with the domestic mainstream online geocoding and place name retrieval services with or without considering spatial relationships, the proposed method greatly improved the quality of fine-grained geolocation. The exact matching ratio of experimental location points reached to 81.51%, and the mean value of the location error distance between location points and real points was 65.97 m, with a proportion of the location error distance below 50 m of 70.50%. The significant outperformance of this method in mining and spatializing geographic information of texts on Asian elephants' activities/accidents sheds new light on wildlife monitoring and early warning, and human-wildlife conflict emergency management based on the fine-grained geolocation derived from multi-media texts on wildlife activities.
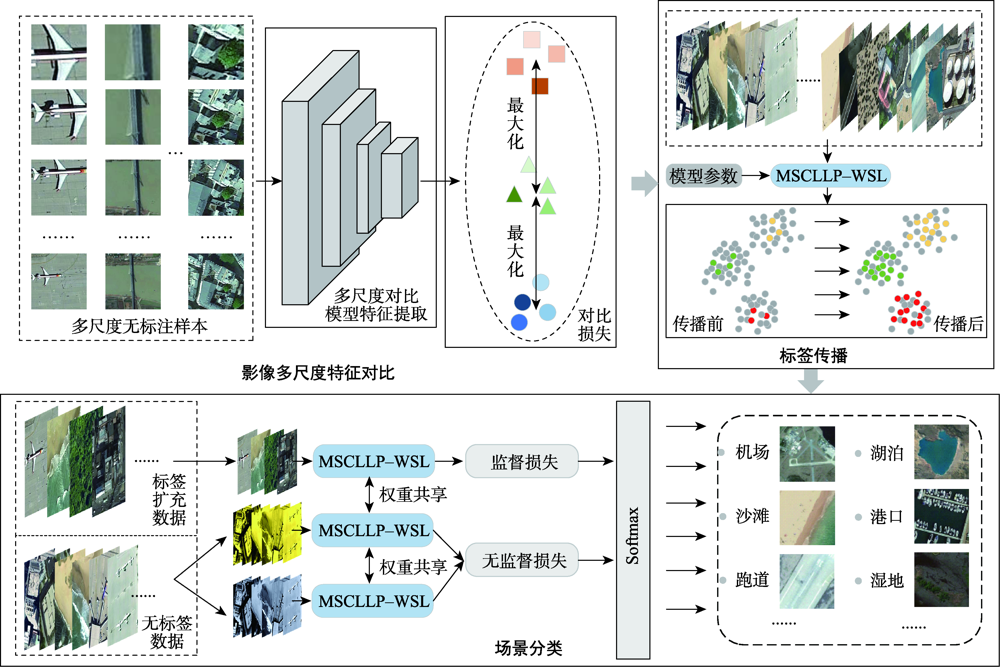
Remote sensing scene classification is a significant approach to comprehending remote sensing images and has several applications in the areas such as target recognition and quick image retrieval. Currently, although many deep-learning-based scene classification algorithms have achieved excellent results, these methods only extract deep features of scene images on a specific scale and ignore the instability of extracted scene image features at different scales. Furthermore, the shortage of annotation data limits the performance improvement of these scene classification methods, which remains unsolved. As a result, for multi-scale remote sensing scene classification with limited labels, this article proposes a Multi-Scale Contrastive Learning Label Propagation based Weakly Supervised Learning (MSCLLP-WSL) approach. Firstly, a multi-scale contrastive learning method is utilized which effectively improves the ability of the model to obtain invariant features of scene images at different scales. Secondly, to address the problem of insufficient reliable labels, inspired by the Weakly Supervised Learning (WSL) method which supports a small number of labeled data and unlabeled data for training at the same time, this research further introduces WSL methods to make full use of the limited labels that exist in the data usage and production process. Label propagation is also used in this study to complete the tasks of annotating unlabeled data, which improves the performance of the proposed scene classification model even further. The proposed MSCLLP-WSL method has been extensively tested on the AID dataset and the NWPU-RESISC45 dataset with limited annotated data and compared with other benchmark algorithms named finetuned VGG16, finetuned Wideresnet50, and Skip-Connected Covariance (SCCov) network. Experiments demonstrate that multi-scale comparative learning enhances label propagation accuracy, which further improves the classification precision of complicated scenes with limited labeling samples. Hence, we set 1%, 5%, and 10% annotated data to represent the case of limited labels, accordingly. The results demonstrate that the proposed MSCLLP-WSL method in this study achieves an overall accuracy of 85.85%, 93.94%, and 95.65% on the AID dataset using 1%, 5%, and 10% labeled samples, respectively. Similarly, on the NWPU-RESISC45 dataset, the overall classification accuracy of 1%, 5%, and 10% annotated samples reaches 87.83%, 93.67%, and 95.47%, respectively. Although the overall accuracy of the latter dataset is lower than the former, the smaller amount of misclassification also indicates the stability of our proposal in the scene classification of large-scale datasets. The experiments results show that our proposed method achieves impressive performance on these two large-scale scenes datasets with limited annotated samples, which outperforms the benchmark methods in this article.
The assessment of hazard changes of high temperature can provide decision basis for regional high temperature risk management and disaster reduction measures. Based on the daily maximum temperature data from 1961 to 2020 and the future climate predictions provided by the 12 climate models in the SSP2-4.5 scenario in the CMIP6 from 2031 to 2099, three indicators were calculated and used to assess the hazard of high temperature, including the number of high temperature days, maximum temperature, and average high temperature intensity. We used the kernel density estimation to calculate the values of the three indicators under four return periods (5, 10, 20, 50 years) of historical and future climate scenarios, and then evaluated the hazard changes of high temperature. The results show that: (1) Under the SSP2.4-5 scenario, the number of high temperature days in China presented four risk centers, including the central part of the arid (semi-arid) area of Northwest China, the intersection area of North China and Central China, the central part of Southwest China, and the southern part of South China. The number of high temperature days gradually decreased outward from these four centers. The spatial distribution of the maximum temperature in the north China was greater than that in the south China, and this distribution in the east China was greater than that in the west China. The distribution of average high temperature intensity showed a decreasing trend from the southern part of North China, the western part of the arid (semi-arid) region of the Northwest China, and the western part of the eastern region to other regions in China except the Qinghai-Tibet Plateau; (2) Under the scenario of SSP2.4-5, with the increase of the return period, the three high temperature indicators in China all showed an increasing trend. The area affected by high temperature expanded, and the values of the three high temperature indicators increased significantly; (3) The changes of the three high temperature indicators showed obvious spatial aggregation. The hotspot areas jointly displayed by the three indicators were: the northern and southern parts of the Southwest China, the central part of the arid (semi-arid) area of the Northwest China, and a small part of the northern and central parts of China, which were most likely to have high-temperature disasters. The change of high temperature days and maximum temperature indicated that high temperature disasters in the western part of the eastern region may also be large. The cold spot areas shown by the three indicators were: the southeast of the Qinghai-Tibet Plateau, the western part of the arid (semi-arid) northwestern region, the western part of the Tibetan Plateau, and the southeast coastal areas of China. There was little risk of high temperature in these areas.
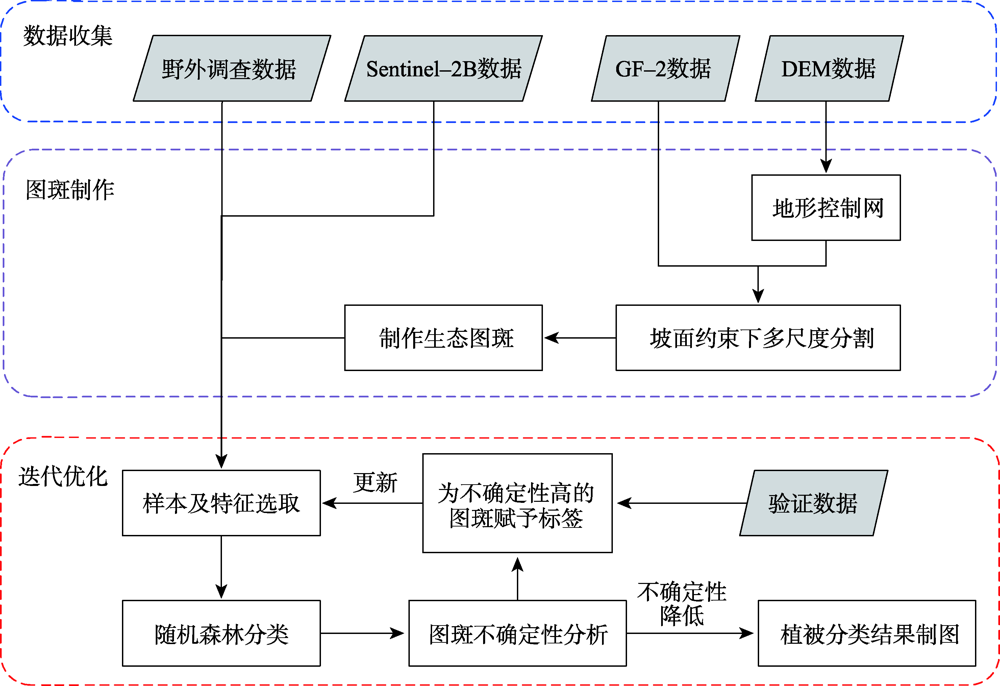
Mountain area is an important part of terrestrial ecosystem and contains valuable ecological values. Due to its high heterogeneity and special environmental characteristics, there are many problems and challenges in remote sensing classification for mountainous areas. The traditional classification method based on vegetation index usually uses remote sensing data from a single source, which is effective in some scenarios, but severely limited in mountainous areas with fragmented landscape and complex topography. In order to achieve accurate mountain vegetation information, the mountainous areas in northwestern Yunnan were selected as research areas to carry out method experiments in this paper. This study used high resolution remote sensing image data and Digital Elevation Model(DEM), combined with the idea of zoning-stratified perception, and proposed a classification method for vegetation types in mountain areas based on uncertainty theory. Firstly, the images of the study area were segmented at multiple scales to make geo-patches under the constraints of the slope units, which were implemented by use of ridge lines and valley lines that were generated by hydrologic analysis based on DEM. Secondly, spectral, textural, and topographic features were selected for classification using random forest model. The experiment took the Mahalanobis distance as the similarity metric between the classification results and the samples of corresponding class as the optimization objective. Then the mixing entropy model was constructed to quantitatively calculate the uncertainty of speckle speculations caused by randomness and fuzziness, which depends on the membership degree of different vegetation types and the area proportion of different vegetation types. Finally, an automatic targeted sample supplement and iterative optimization of the model based on historical interpretation data, uncertainty theory, and similarity measurement were conducted. The model was updated accordingly every time the sample was supplemented. The iteration stopped when the Mahalanobis distance decreased to a convergence. This study also generated the variation trend of uncertainty in iteration and space. The overall classification accuracy of the experiment reached 90.8%, 29.4% higher than that before iteration, and the Kappa coefficient reached 0.875. In the high uncertainty region, the accuracy of this method was 17% and 13% higher than that of one-time and random sample supplement methods, respectively. The experimental results show that the method of iterative optimization, which integrates incremental information through human-computer interaction and imports high uncertainty and low confidence patches into the sample library, can effectively classify the vegetated mountain surface and has higher efficiency and lower uncertainty than the traditional sample selection methods.