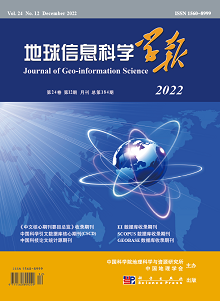
Multi-scale representation is one of the important research contents of geospatial data. This paper summarizes the research status of multi-scale representation of geospatial data from three aspects: geospatial data management, geospatial data scale transformation, and multi-scale representation of the map, and makes a systematic analysis and prospect of current research results. The main conclusions are as follows: ① In terms of multi-scale database and multi-scale spatial index of geospatial data management, three kinds of multi-scale database can provide better data support for multi-scale representation methods, and the hierarchical multi-scale index is the mainstream construction structure for the multi-scale database. However, at present, multi-scale database and multi-scale spatial index still have limited integration and matching ability of data at different levels, and the real-time consistency adjustment ability of data at different scales is also insufficient; ② In terms of the multi-scale transformation of geospatial data, automatic map generalization can be well combined with artificial intelligence technology. But due to the limitation of knowledge acquisition, there is still a long way to achieve automatic map generalization. The relevant achievements of intelligent automatic generalization research are mainly used to assist decision-making now, and the autonomous learning of comprehensive knowledge needs further research. Currently, most of the research is based on a discrete scale transformation model, which is incapable of continuous scale transformation. And due to the lack of a strong quality control mechanism, the results of automatic scaling have great uncertainty; ③ In terms of multi-scale representation of the map, map data types are multi-source, diverse, and flexible to use, and the multi-scale display is highly complex. Currently, the phenomena of hidden geographic information in map visualization need to be further explored. Finally, the future prospect of research on geospatial data presentation is proposed from the aspects of intelligent automatic generalization method, continuous multi-scale representation model, deep learning and cartographic synthesis, and multi-scale representation in the "new" era.
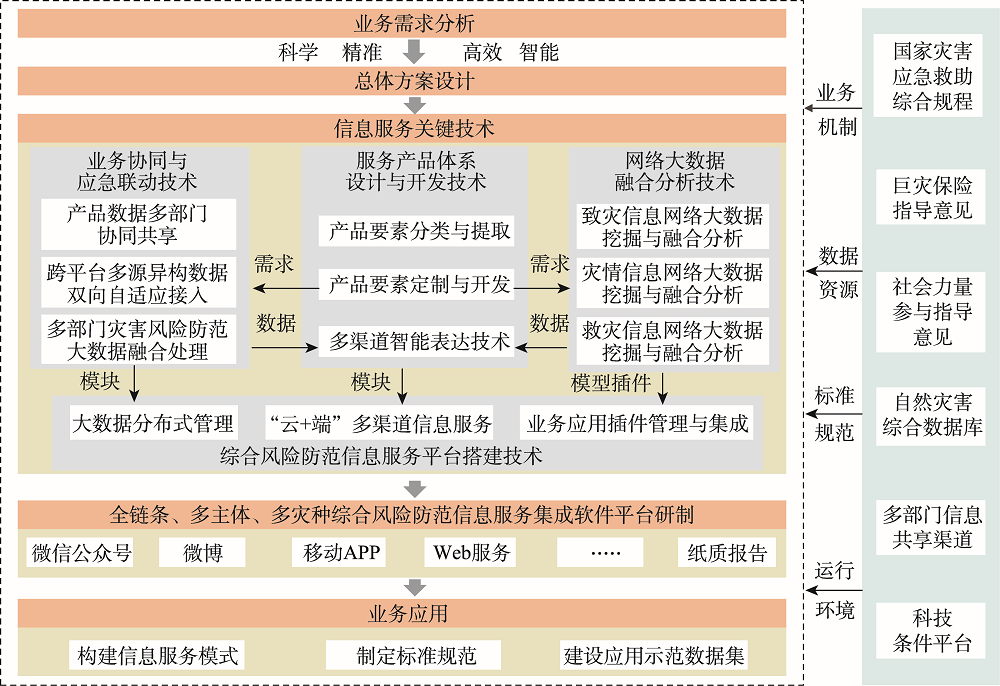
To build a operational technological system of information service for comprehensive risk prevention of natural disasters is an inevitable requirement to support disaster prevention, mitigation and relief in the new era. Aiming to the demand for comprehensive risk prevention information service of the whole chain, multi-agent and multi disaster, this paper establishes the technical system framework of comprehensive risk prevention information service of natural disasters. We construct the comprehensive risk prevention information service product system covering the whole process of normal disaster reduction and abnormal disaster relief (such as, pre disaster prevention, in disaster rescue, post disaster recovery and reconstruction) and breaks through four key technologies, including the information product development, industry data collaboration, network big data mining Information and service platform integration. In terms of information product development, we have developed disaster information product production, expression and dynamic customization technology based on three standard disaster information elements: disaster causing, disaster situation and disaster relief. In the aspect of industry data collaboration, we have developed a new mechanism of two-way adaptive departmental micro service data sharing and multi-department and multi-source heterogeneous data access and fusion processing technology. In the field of network big data mining, we have developed information mining and fusion analysis technology of disaster causing, disaster situation and disaster relief elements based on Web pages, mobile communications, social networks, Internet of things and other network big data. For building information service integration platform, we have developed spatiotemporal distributed big data management, business tool model integration and "cloud + end" multi-channel information service technology based on cloud service architecture. The technical system solves the problems of low timeliness and insufficient completeness of disaster information services, and provides technical support for opening up a second way to obtain disaster information data distinguished from government statistics.
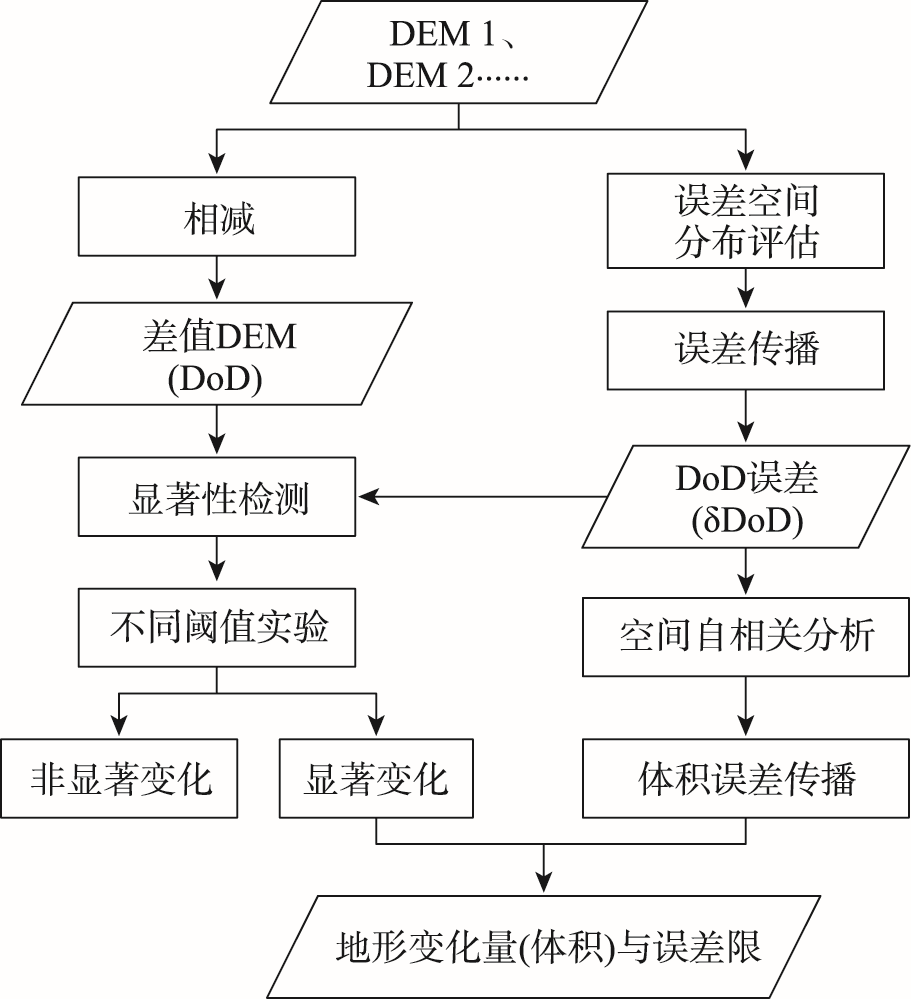
Traditional topographic change detection methods often ignore the spatial autocorrelation of DEM errors. To solve this problem, a topographic change detection method that considers the spatial autocorrelation of DEM errors is proposed in this paper. Firstly, the DEM of Difference (DoD) is obtained from two original DEMs, and the spatial distribution of DEM errors is evaluated by the Monte Carlo method. Secondly, based on spatially distributed DEM errors, DoD errors are calculated by error propagation and their spatial autocorrelation degree is analyzed using the semi-variance function. Finally, topographic changes (erosion, deposition, and net changes) are calculated based on the spatial autocorrelation analysis and significance detection. The results in four small catchments show that the elevation errors of UAV-photogrammetry DEM are spatially autocorrelated, which can be simulated by the Monte Carlo method. The use of spatially distributed error instead of RMSE for topographic change detection effectively reduces the sensitivity of the detection results to the significance threshold. When the significance threshold is increased from 68% to 95%, the loss of observations using the spatially distributed error is 5.39%~6.75% lower than that using the RMSE. The proposed method can be effectively used in the fields of surface deformation monitoring, erosion monitoring, sediment transport assessment, and so on.
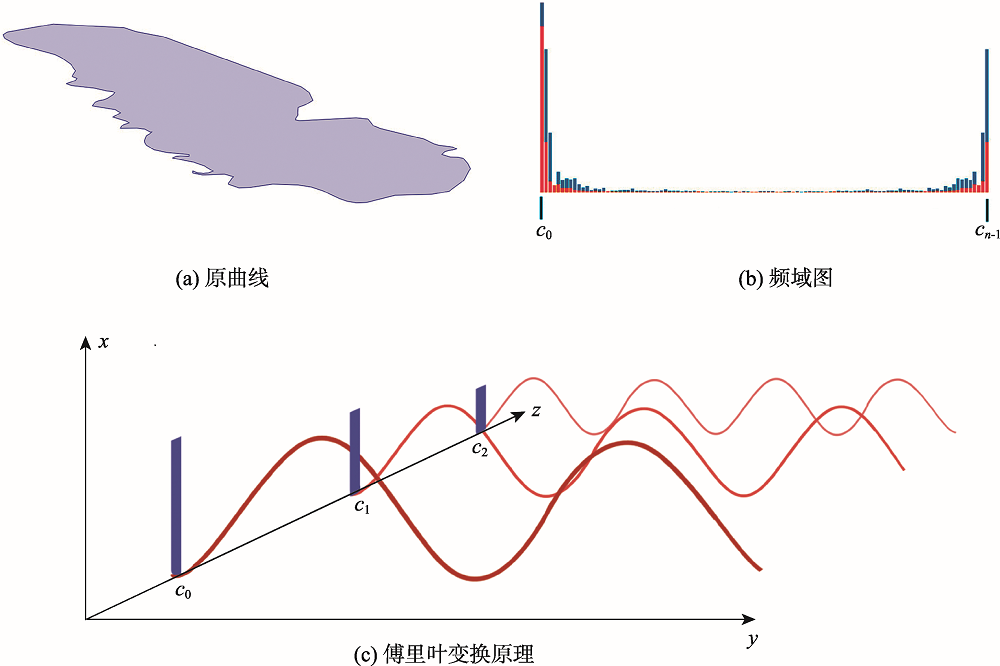
Compared with traditional polyline generalization methods via deleting vertices, the line generalization based on Fourier transform can better retain the global characteristics of the polyline. However, the existing Fourier-based methods are more suitable for curve smoothing and multi-scale representation, and are not able to automatically control the targeting number of points on polylines. Therefore, a polyline generalization method using discrete Fourier transform is proposed in this paper. The discrete Fourier transform is first performed on the polyline to obtain a Fourier descriptor with finite terms. The Fourier descriptor then is truncated according to the desired compression ratio. Finally, the simplified polyline is obtained by inverse discrete Fourier transform based on the truncated descriptor. In this paper, a Fourier method which can reduce the number of vertex points of the simplified curve is proposed, which can be applied to the field of map generalization. In this paper, the feasibility of the proposed algorithm is verified by four groups of experiments, and its advantages are shown as follows: (1) it can simplify and express linear features smoothly and gradually on the corresponding scale; (2) it can retain the original vertices of the curve on the basis of the existing Fourier transform method; (3) the number of vertex points is taken as the generalization parameter, and the number of vertex points of the curve can be automatically reduced; (4) compared with the traditional node compression method, it pays more attention to the simplification of the overall shape, and can better retain the overall characteristics of the curve in generalization; (5) in the generalization process with large conversion scale, the geometric accuracy retained in this study is higher than that of the traditional node compression method.
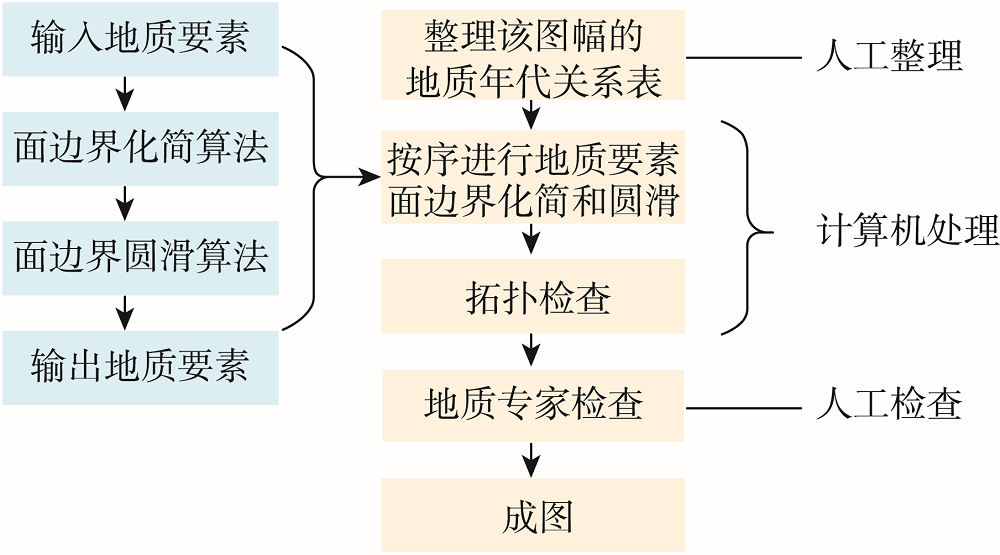
The intelligent generalization of geological maps has the advantages of repeatability and high efficiency. Area geological features are the main elements in the geological map. It is very necessary to realize the intelligent generalization of area geological features through algorithm research in the process of downsizing of geological maps. Therefore, this paper is based on the industry experience of geological map downsizing technology, computer software development specifications, and the theoretical basis for the generalization of area geological features such as the relationship of time and geological body, the contact relationship of the geological body, and the topological rules of the area geological features. This paper designs the logical flow of the intelligent generalization algorithm based on the ArcEngine and C# development environment, designs and realizes the intelligent algorithm of the area geological features in the process of geological map generalization. The intelligent generalization algorithm first thins out the boundary point sets of the area geological features in the order from new to old, and then performs boundary smoothing on the thinned boundary point sets, and performs automatic topology inspection on the results of the generalization area geological features. Finally, the final intelligent generalization result is obtained. Take 4 geological maps of Zhengzhou, Luoyang, and surrounding areas from 1:250 000 to 1:500 000 scale as an example to generalize the area geological features, and the generalization effect of the area geological features in the geological map (1:500 000) after downsizing has been evaluated and recognized by geological experts. The general results conform to the capping relationship and topological rules of geological features. At the same time, intelligent generalization of geological features can be realized efficiently, batchwise, and accurately. The overall efficiency is greatly improved, and more than 80% of the workload can be saved. In the process of downsizing of geological maps, the intelligent generalization algorithm of area geological features has practical application value. It can realize the production transformation of theory and technology, improve the traditional work mode of geological generalization, promote the improvement of the efficiency of the geological maps downsizing, and promote the progress of industry technology. Therefore, the intelligent generalization algorithm can be used in large-scale geological map downsizing work.
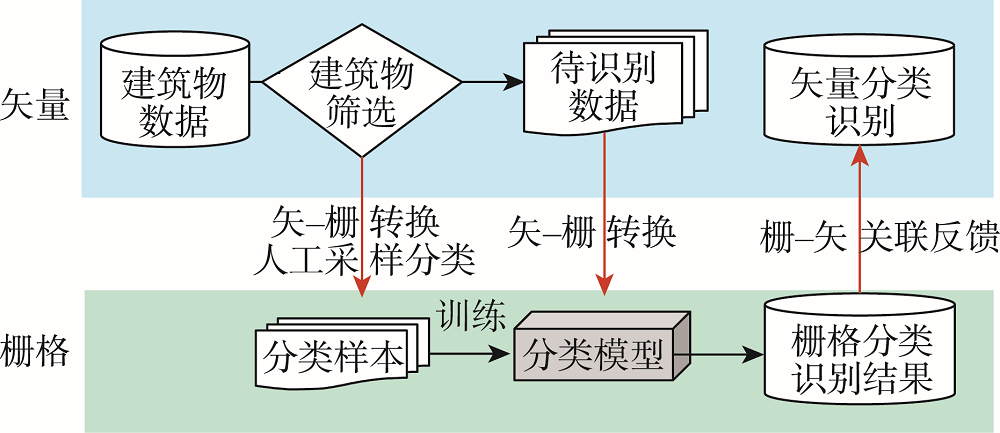
Shape of map objects plays an important role in the study of map generalization and spatial query. As the basis of simplification and typification of building, the recognition and classification of map building shapes has always been a hot issue in cartographic generalization research. At present, the traditional building shape recognition methods mainly rely on the description of the building boundary and a specific shape similarity calculation, which can only be applied to buildings with conventional shapes. The traditional methods have a strong dependence on the morphological characteristics of map surface elements such as buildings, and usually only play a good role in dealing with specific types of regular contours or rectangular contours, but has poor shape recognition ability for buildings with complex or unusual shapes. This study proposes a new method of map building shape classification method based on AlexNet. The shape classification problem of building data in vector map is transformed into the classification problem of building raster images, and the shape recognition of building is realized by completing the graphic classification of convolutional neural network. Firstly, this method constructs a series of typical shape types based on spatial cognition. Secondly, the raster images of individual buildings are sampled from OSM data by vector-raster transformation method, and the training samples of building shape classification are obtained through manual identification. Based on this, the classification model of AlexNet convolutional neural network is trained. Thirdly, this method uses the trained model to perform intelligent shape classification and recognition on large-scale building data. In this paper, the OSM building data of Beijing and Hong Kong were used as samples to train the building shape classification model, and the proposed method was verified using the OSM building data of some urban areas in Guangzhou. Compared with the traditional shape similarity measurement method, the recall rate of the proposed method increased by 2.48% (92.32%) for the classification of buildings in the experimental area. The precision rate of more complex shapes such as T shape and cross shape was also higher, which increased by 13.83% and 24.53%, respectively. The experimental results show that the proposed method can significantly improve the classification accuracy of building shapes, and can effectively classify common building shapes, which lays a foundation for the next step of the map generalization such as the simplification and topicalization of buildings.
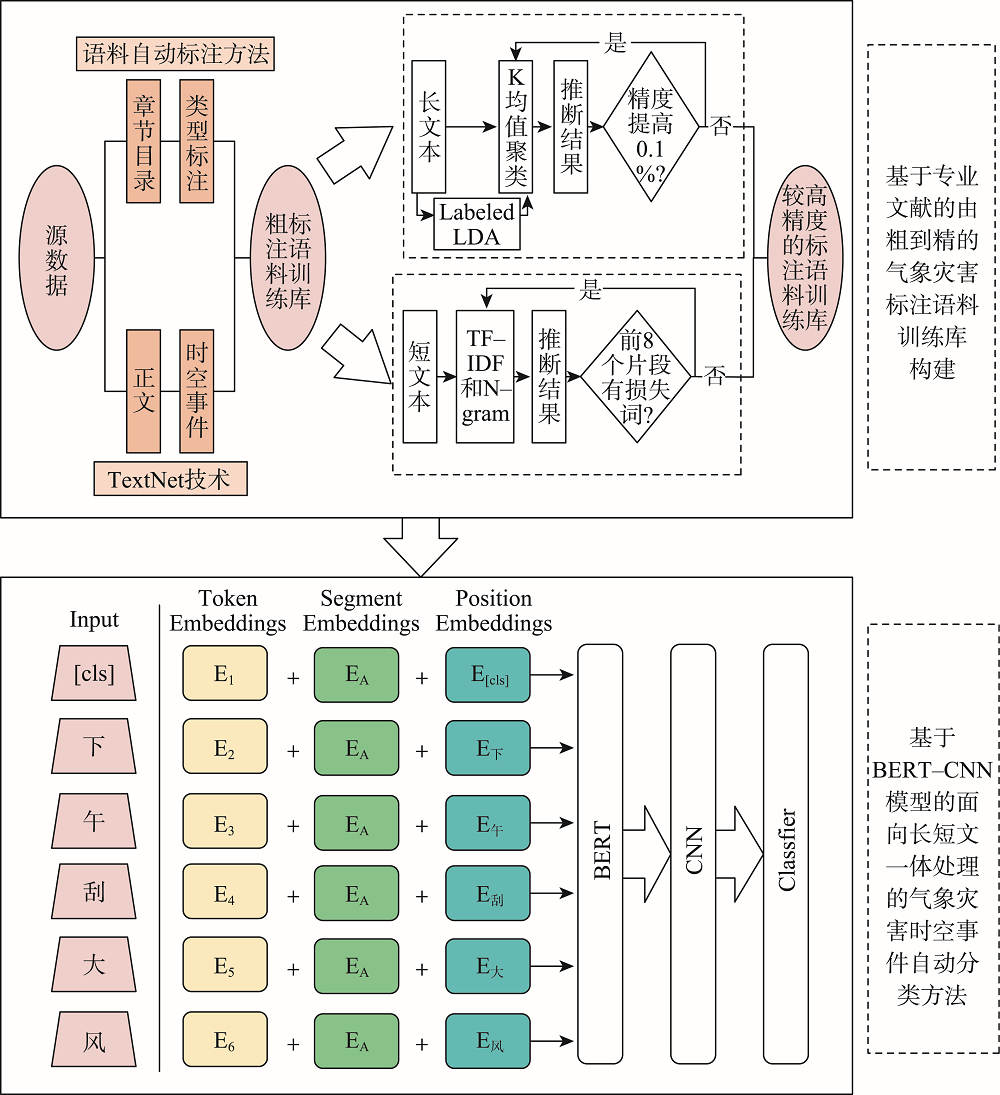
With global warming, the frequency of extreme weather events and major meteorological disasters is increasing globally. It is important to study the relationship between climate change and the frequency of meteorological disasters for disaster prevention and mitigation in the context of climate change. In this paper, a method is proposed for automatic extraction of spatial and temporal events of meteorological disasters based on natural language processing technology. Because there is a huge amount of spatial and temporal information of meteorological disasters available in literature and web data. Specifically, (1) A coarse-to-fine method was proposed to build a training corpus of meteorological disaster annotations based on professional literature. Firstly, a unified meteorological disaster knowledge system oriented to textual events is constructed to address the problems of ambiguity and incompatibility of different literature materials. Then a coarse annotation method based on chapter structure was constructed, and a Labeled LDA model-based and a fine-grained annotated corpus screening method based on TF-IDF and N-gram models were developed for long texts (modern texts) and short texts (literary texts), respectively, solving the problem of rapid corpus construction; (2) A method for automatic classification of spatiotemporal events of meteorological disasters based on the BERT-CNN model, which integrates contextual semantic features and local semantic features at multiple granularities, was developed for the integrated processing of short and long texts; (3) Using this method, the spatiotemporal events of meteorological disasters were automatically extracted from the textual and web data, and their macro F1 values reached 89.09% and 80.06%, respectively. The spatiotemporal distributions of major events of meteorological disasters were highly correlated with professional statistics; (4) Based on the above results, the spatiotemporal evolution of disasters in various historical periods in China was also reconstructed. We found that the overall volume of disaster data in each period showed a gradual increasing trend, with heavy rainfall disasters, floods, and droughts being the main types of disasters in China. Our method enables both the automatic extraction of long text events from the web and the automatic detection of short text events from literatures, providing a new technique for application of text data to meteorological disaster research and monitoring.
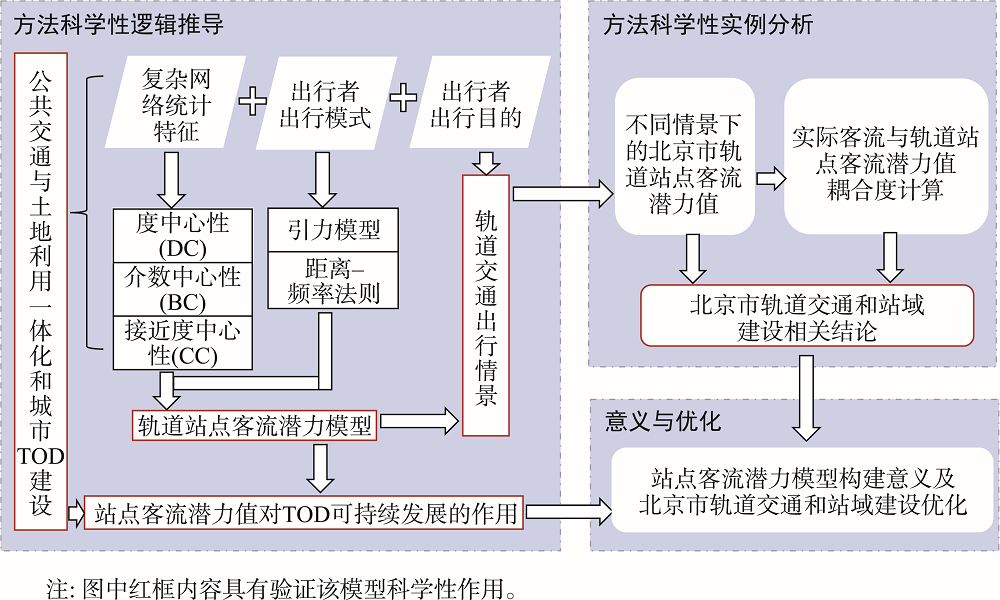
Rail transit is an important facility to alleviate urban traffic problems, and increasing the probability of passengers choosing rail transit to travel is conducive to the coordination of transportation and land use and the sustainable development of TOD. This paper proposes the concept of rail transit station passenger flow potential and constructs a station passenger flow potential calculation model based on the connotation of complex network eigenvalues and travel patterns, which provides a new perspective for TOD research by coordinating potential values with actual passenger flows. The Space-L model is constructed using POI data of Beijing railway stations, and the passenger flow potential of 364 stations in Beijing is calculated based on the station passenger flow potential model. The results show that 1) The station passenger flow potential values proposed in this paper have the dual connotation of attractiveness and carrying capacity, and can be used to quantitatively analyse the coordination between the Station Space and Station Area Traffic; 2) The spatial distribution of station passenger flow potential values in Beijing shows a "core-edge" pattern, with the most compact circles in non-work travel scenarios. The probability of the interval shows an exponential distribution for the isometric classification and a normal distribution for the isometric classification; 3) Four travel scenarios are set up according to the purpose of travel. The probability of travellers choosing rail travel differs in different scenarios. The probability of choosing rail travel is higher in the morning peak and evening peak scenarios and is less influenced by the potential value, while the probability of choosing rail travel is lower in the non-work travel scenario and is more influenced by the potential value, which is in line with reality. The verification example shows that the potential value has better interpretability and scientific validity than simply considering complex network features; 4) The coupling degree of C< 0.5 identifies the station as out of tune, where the ratio of actual passenger flow to potential value Z
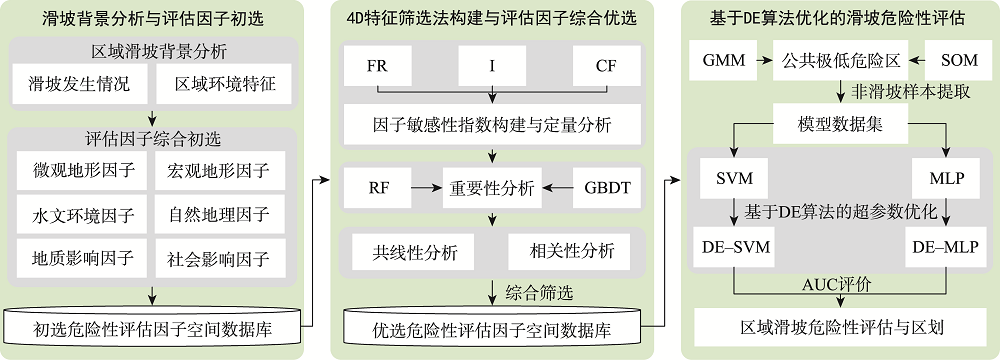
Hazard assessment of sudden geological disasters is of great significance for disaster prevention and risk management. Due to different factors affecting the occurrence of disasters in different regions, it is difficult to select appropriate factors comprehensively and objectively in an actual evaluation process. Machine learning has unique advantages in dealing with high-dimensional nonlinear problems of disaster systems, but its evaluation performance is limited because the model is difficult to tune. This paper attempted to propose a two-way optimization method for landslide hazard assessment. Based on a factor sensitivity index built for quantitative sensitivity analysis, combining importance analysis, correlation analysis, and collinearity analysis, and following the principle of “guarantee sensitivity, retain importance, eliminate correlation, and avoid collinearity", a four-dimensional (4D) feature screening method was constructed to evaluate the comprehensive optimization of factors. In order to overcome the problem that the model is difficult to tune, the Differential Evolution (DE) algorithm was further introduced. Two machine learning models with strong generalization ability, i.e., Support Vector Machine (SVM) and Multi-Layer Perceptron (MLP), were optimized. Finally, we took the landslide in Fujian Province as an example to verify the proposed evaluation method. We found that the 4D feature screening method can more objectively and comprehensively select suitable hazard assessment factors, thereby reducing the data dimension and reducing information redundancy to improve the performance of the assessment model. Ten suitability assessment factors were finally used for landslide hazard assessment in Fujian Province including aspect, variance coefficient in elevation, land use type, average annual rainfall, surface cutting depth, distance to river, distance to road, engineering geological rock group, topographic wetness index, and stream power index. The DE algorithm can obtain better hyperparameters from global search and has a significant optimization effect on SVM and MLP, which is beneficial to improve the evaluation accuracy of the landslide hazard of the model. Compared with the unoptimized models, the AUC values of DE-SVM and DE-MLP increased by 4.43% and 4.37%, respectively. The results of landslide hazard assessment based on two-way optimization show that rainfall and land use types have an important impact on the occurrence of landslides in Fujian Province. Terrain curvature elements, terrain variability elements, and fault structures have little impact on landslide occurrence. The extremely high-hazard areas generally have high annual rainfall and complex and changeful terrain. The extremely low-hazard areas are mainly located along the southeast coast and on both sides of the Minjiang River Basin. This research provides some ideas for objective selection of influencing factors in landslide hazard assessment and machine learning model tuning.
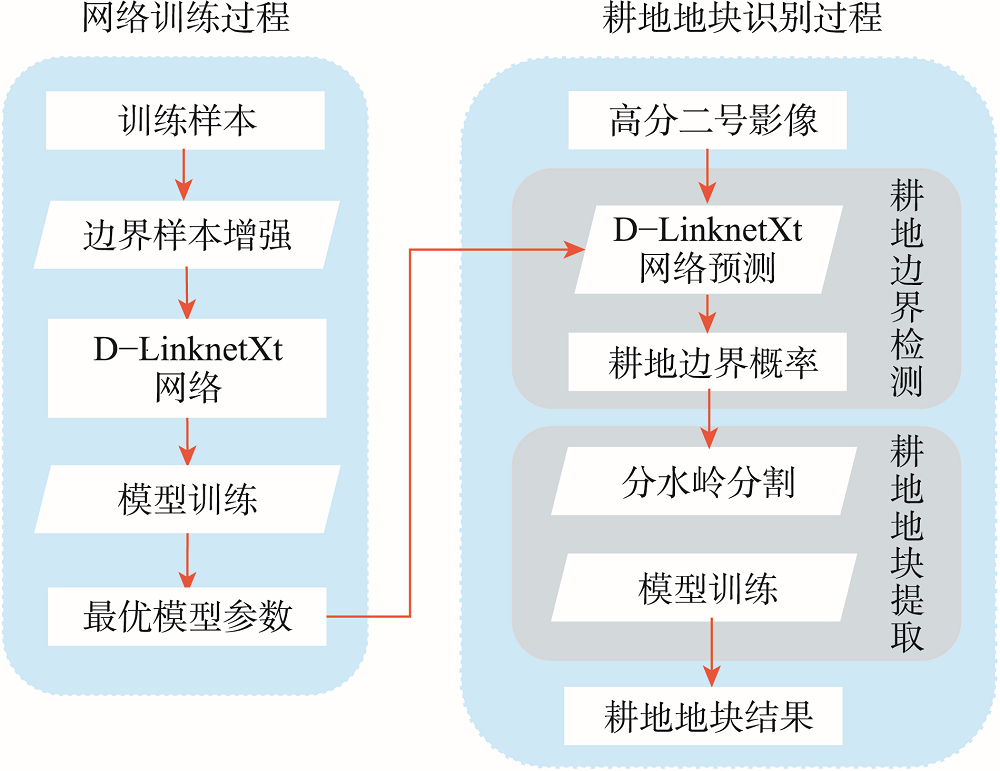
As an important support for precision agriculture, the acquisition of agricultural parcels mostly relies on extensive manual delineation. With the development of remote sensing technology, automatic extraction of cropland parcels based on remote sensing images has become the main research direction. In particular, the method based on deep learning has been widely used and can overcome the limitation of traditional detection methods that are difficult to adapt to complex scenes. However, there are still problems in existing deep learning methods, e.g., direct identification of cultivated areas based on deep learning models results in loss of internal boundaries, and identification of cultivated areas based on edge detection models results in inclusion of irrelevant boundaries. In addition, the extracted parcels using existing strategies based on thresholds are usually irregular and has the problem of inward trapping. To address the above problems, this study proposes a method of extracting cropland parcels based on deep convolutional neural network and watershed segmentation, which improves both information detection and parcel extraction. First, we treat cropland boundaries as a type of feature category and perform category probability detection in deep convolutional neural network to help achieve semantic recognition of cropland boundaries. Second, we perform parcel boundary detection based on the modified D-Linknet network, whose architecture is suitable for extraction of linear targets such as cropland boundaries, and the replacement of residual blocks can help improve the feature extraction capability of the network. Third, we extract agricultural parcels based on watershed segmentation, using the region segmentation method to obtain the closure of boundaries. The way of segmenting and merging parcels using region as a unit overcomes the limitation of parcel inversion in traditional methods based on thresholds at the pixel level. The performance of our proposed method is evaluated by two types of accuracy indicators: global boundary accuracy and parcel geometry accuracy. The experimental results show that the accuracy of our method is better than three comparison methods, and the F1 score representing the boundary accuracy is 0.933 and the parcel geometry accuracy is 0.829. Our proposed method can extract the agriculture parcels more accurately and is suitable for future practical applications.
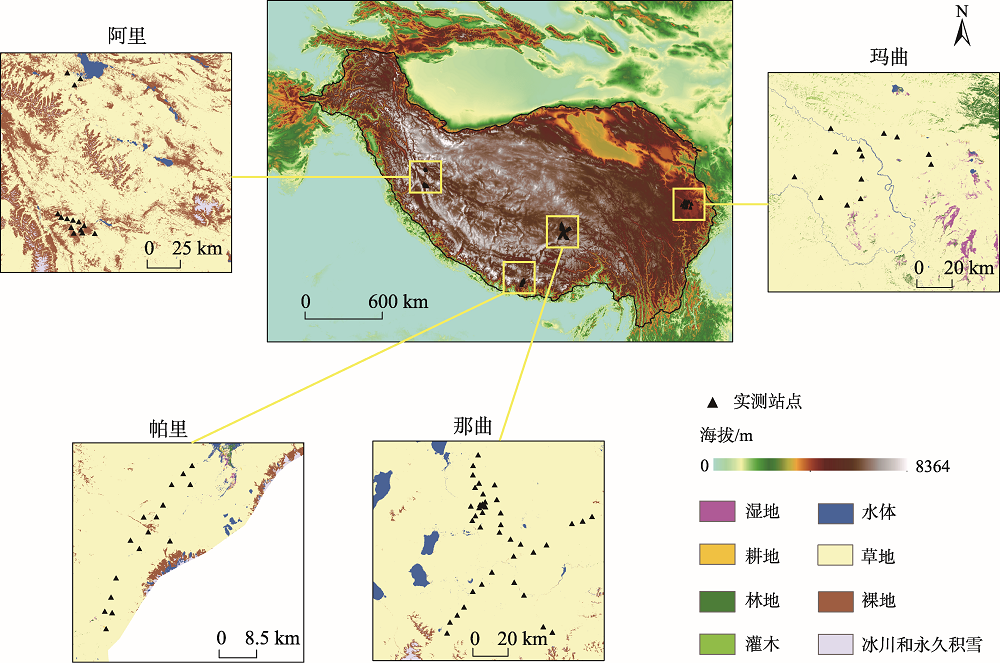
As the largest alpine permafrost area in the middle and low latitudes, permafrost and seasonally frozen soil are widely distributed in the Tibetan Plateau (TP). Accurate spatiotemporal observation of surface freeze/thaw state in the TP is important for quantifying surface energy balance, carbon and nitrogen exchange, and soil freeze-thaw erosion. However, land surface freeze/thaw state can hardly be detected in this area because of its harsh and complex geographical environment. This study aimed to employ the LightGBM algorithm and random forest algorithm to identify near-surface freeze/thaw state, based on four soil temperature & moisture observational networks. Previous studies have shown that soil moisture could significantly affect the seasonal variation characteristics of near-surface soil freeze-thaw cycles. In this study, soil moisture was introduced as a discriminant feature. In order to illustrate the contribution of microwave brightness temperature, discriminant index, and soil moisture, four different feature combination schemes were designed. We utilized AMSR2 brightness temperature data and ERA5-Land soil moisture data to identify the surface freeze/thaw state using these two machine learning algorithms. By evaluating the importance of different features based on the training set, we found that the importance score of soil moisture was high in both LightGBM and random forest algorithms, which indicates that soil moisture is a very important feature that affects freeze-thaw discrimination. To evaluate the performance of our algorithms, we compared LightGBM and random forest algorithms with a traditional freeze-thaw discriminant algorithm. Results show that the accuracy of the two machine learning algorithms was higher than that of the traditional method, and the overall rate of correct classification for daytime and nighttime was increased by 12.09%, 14.45%, respectively using LightGBM, and 13.23%, 14.96%, respectively using random forest. Nearly 80% of the misclassification occurred when the surface soil temperature was between -4.0 ℃ and 4.0 ℃. So the two machine learning algorithms are able to identify stable soil freeze/thaw state. In addition, the average RMSE of the freeze-thaw conversion days obtained by the LightGBM algorithm and the random forest algorithm decreased by 112.82, 117.00, respectively; the average RMSE of the frozen days decreased by 47.87, 53.96, respectively; and the average RMSE of the thawed days decreased by 37.10, 39.80, respectively. Based on random forest algorithm, we calculated the number of frozen days, number of thawed days, and number of freeze-thaw conversion days from July 2014 to June 2015. The accuracy assessment was carried out using the map of permafrost classification as the reference, and the total classification accuracy of frozen days within the permafrost zone was 96.78%.
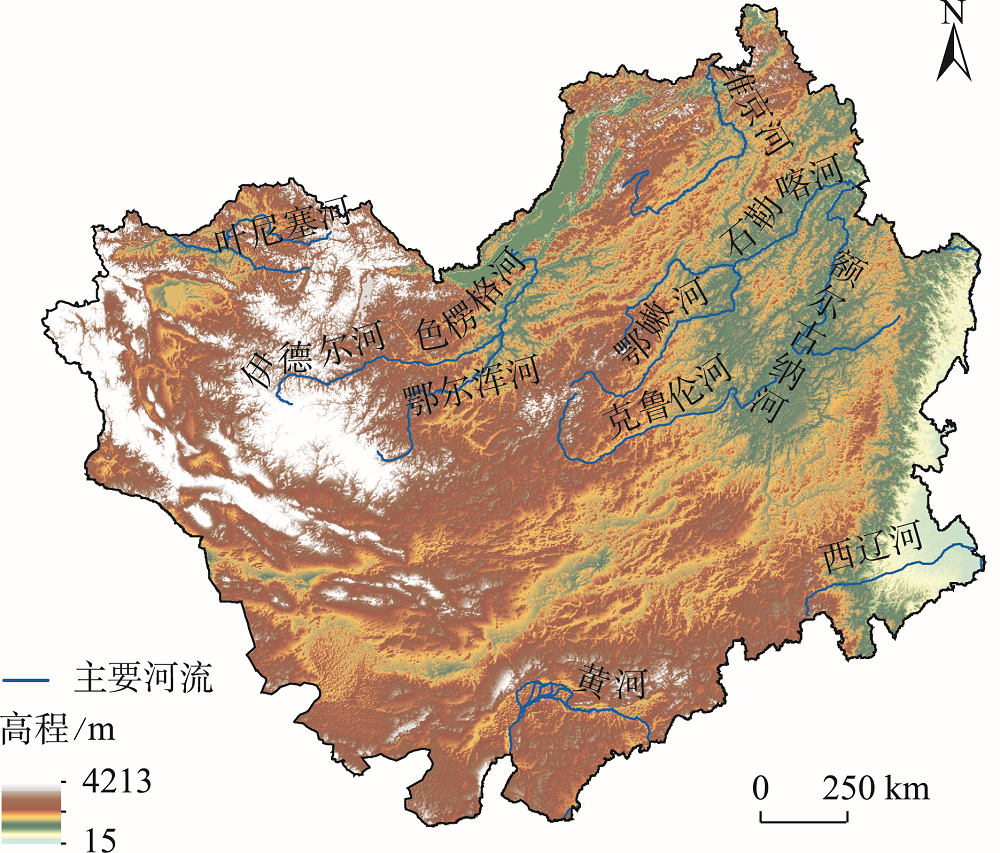
Land cover changes over the Mongolian Plateau is a key indicator of local ecological environment changes in the region. Numerous of environmental research relies on accurate land cover information. With the vigorous development of geographic information technology and remote sensing technology, a variety of land cover datasets of different resolutions at global scales have emerged, and the free and open sharing of these datasets provides a strong data support for scientific research on global change and regional sustainable development. Therefore, it is important to assess the accuracy of current global land cover datasets at a regional scale. In this study, we analyzed the consistent analysis and accuracy of three 30m global land cover datasets (GlobeLand30 dataset, GLC_FCS30 dataset, and FROM_GLC dataset) from the similarity of composition type, the degree of type confusion, spatial consistency, and absolute accuracy. The results show that: (1) The consistent analysis of three land cover datasets show that grassland and bare land are the main land cover types over the Mongolian Plateau, and the area sequence correlation coefficient of any two datasets is better than 0.95. (2) the areas that are completely consistent among the three land cover datasets account for 61.87% of the total area of the Mongolian Plateau, mainly in areas with low land surface heterogeneity. (3) The overall accuracy of GLC_FCS30 dataset (78.33%) is the highest, the overall accuracy of GlobeLand30 dataset (76.85%) is the second, and the overall accuracy of FROM_GLC dataset (75.86%) is the lowest. The accuracy of forest, grassland, water area, and bare land in the three kinds of land cover datasets is generally higher (more than 75%), and the accuracy of shrubland, wetland and other land types is low (less than 50%). Therefore, GLC_FCS30 dataset with the highest overall accuracy can be comprehensively considered when studying the all types of land cover over the Mongolian Plateau. For users who have specific land type research needs, they can refer to the consistency and classification accuracy of abovementioned three land cover datasets to make targeted selections. Our findings in this study can provide a basis for selecting suitable land cover dataset in related research on the Mongolian Plateau. In addition, this study can also provide the necessary information for the ecological management of the region, provide data reference for promoting the prevention and control of land desertification on the Mongolian Plateau and assisting in the research on sustainable development of the Mongolian Plateau.
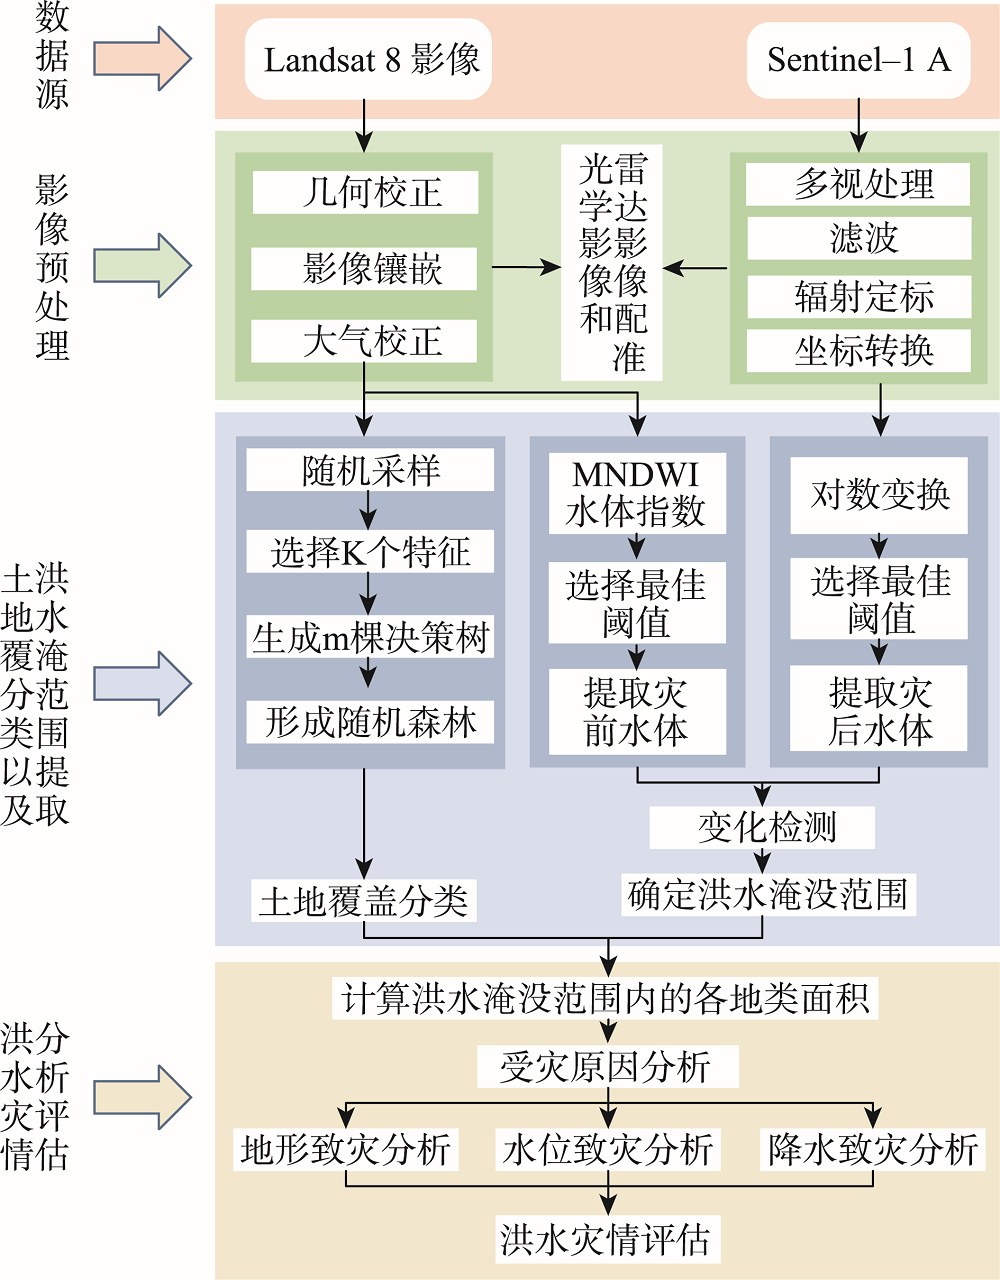
In the summer of 2020, heavy rains made the Poyang Lake region witnessed a big flood event. Remote sensing earth observation technology can help to map and assess the flood hazard quickly and efficiently. Therefore, two 2020 satellite images acquired on April 15 (Landsat-8 OLI) and July 14 (Sentinel-1A SAR) were selected in this study to represent the dates before and after the flood to evaluate the disaster. Using remote sensing thematic information extraction, Random Forest classification and change detection technology, the inundation area and the area of major land cover types within the inundation areas were revealed. Associated with the hydrological, meteorological and topographical data, the specific flooded sites and the factors causing the disaster were identified and analyzed. The results show that the flood-inundation extent in the Poyang Lake region in 2020 is 1961.95 km2, including 760.54 km2 of farmland, 71.59 km2 of forest, 992.02 km2 of grassland, 26.97 km2 of soil, and 110.83 km2 of built-up land. Poyang County was most severely affected in this flood event, with a total inundated area of 514.35 km2. The next two are Xinjian County with 330 km2 and Yugan County with 310 km2. The main hydro-meteorological and topographical factors that caused the flood are considered to be: (1) higher water level than that in the 1998 flood; (2) failure of timely discharge of water due to backflow of the Yangtze River; (3) breach of the embankments.
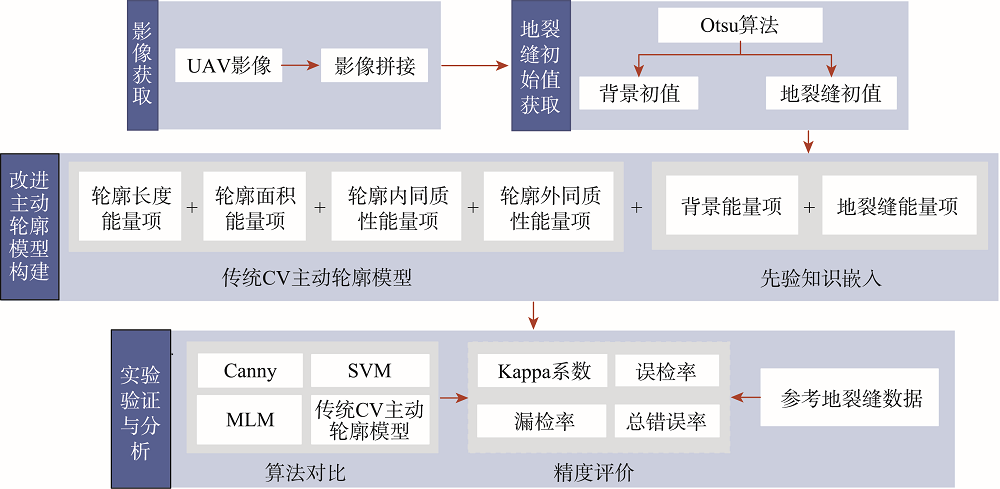
Accurate identification of ground fissures in mining areas is significant for disaster prevention, mitigation, and ecological environment restoration. In this study, a ground fissure extraction method is proposed based on the improved active contour model for UAV images in mining areas, aiming at accurately extracting ground fissures from high-resolution UAV images. Firstly, the Otsu algorithm was used to calculate the background and initial values of ground fissures as prior knowledge. Secondly, the extraction energy functions of the background and initial values of ground fissures were constructed and introduced into the traditional CV active contour model to enhance the pertinence of ground fissures extraction. Finally, ground fissures were extracted through the continuous evolution of the contour. Based on UAV images obtained in Dalai Nurg mining area, Inner Mongolia, the improved active contour model was used to extract ground fractures, and compared with traditional Canny edge detection algorithm, Support Vector Machine (SVM), Maximum Likelihood Method (MLM), and traditional CV active contour model methods for analysis and accuracy evaluation. The results show that the traditional Canny edge detection algorithm and traditional CV active contour model had the poor extraction in a small area with a single type of land cover. The improved active contour model, SVM, and MLM had achieved good results, and the improved active contour model method had the highest accuracy. In addition, in a large area with relatively complex land cover types, the traditional methods such as Canny edge detection algorithm, SVM, MLM, and CV active contour model had many omissions and errors, and the kappa coefficient was lower than 0.7. However, the improved active contour method still achieved better results, and the Kappa coefficient was about 0.9. Therefore, the proposed method could effectively improve the accuracy and stability of ground fissure extraction by introducing prior knowledge.