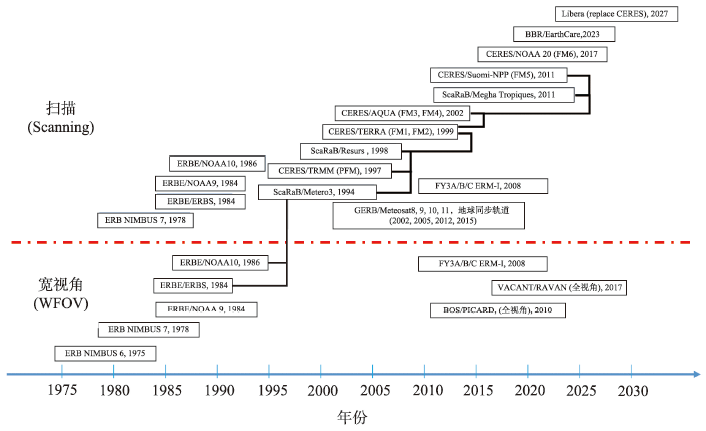
Monitoring the spatiotemporal variations of the Earth Radiation Budget (ERB) could help to improve our understanding of global climate change. The Earth's reflected shortwave and emitted longwave radiation are important components of energy exchange between the Earth-Atmosphere system and outer space, and are main parameters to be measured by ERB sensors. The Earth radiation radiometer is intended for measuring the parameters of Earth radiation budget. The Angular Distribution Models (ADMs) refer to a series of factors for correcting the anisotropy of the Earth-Atmosphere radiation at the Top-of-Atmosphere (TOA), and it is an effective way to convert the broadband radiance measured by satellite-borne or Moon-based Earth radiation sensor to the Earth radiant flux. Therefore, the consistency between ADMs anisotropic factors and the anisotropy of TOA radiances would directly determine the accuracy of derived flux. This paper focused on the ADMs, reviewed the development progress of the ADMs over the past decades, introduced the current operational ADMs applied by the Clouds and the Earth's Radiant Energy System (CERES) onboard the Terra and Aqua satellites, and analyzed the advantages, problems, and potential of geostationary satellites and Moon-based Earth observations in the development of ADMs. Based on above reviews and analyses, the determinant factors for further improving the ADMs for satellite-borne and Moon-based Earth radiation measurements were discussed.
In the era of big data, the spatio-temporal category, information content, and application scenarios of Geographic Information Systems(GIS) have expanded unprecedentedly. GIS needs to transform from the passive adaptation mode of exception processing into an active kernel-supported mode, forming a new generation of spatio-temporal information system. Given that the essence of GIS is an information system with cartographic data model as the core, this paper summarizes the research paradigm of GIS from three aspects: research objects, basic principles, and technical methods, and analyzes the new requirements of spatio-temporal information expansion on the GIS research paradigm. Secondly, by analyzing the cognitive model of Pan-Spatial Information System (PSIS) and the multi-granularity spatio-temporal object data model, the theoretical and technical routes of the PSIS based on spatio-temporal entities are concluded, and its practice and application in many fields are summarized. Then, it systematically analyzes the specific extension mode of PSIS in GIS research object, basic principles, and technical methods, respectively, and proposes the PSIS research paradigm. Finally, this paper summarizes the basic content of the PSIS research paradigm, compares the core content with the GIS research paradigm, and looks forward to the impacts and changes that the advanced research paradigm of GIS would bring.

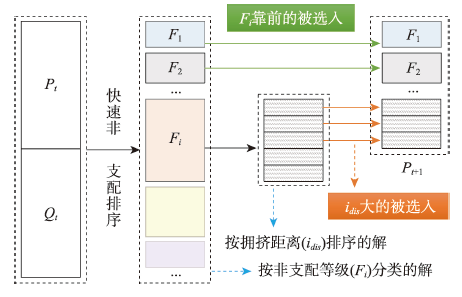
The focus of geography is shifting from qualitative descriptions and quantitative analysis to support decision-making. The process of geographic decision-making usually involves multiple factors to consider and balance to achieve an optimal solution. It is a typical process of multi-objective optimization. Thus, multi-objective optimization algorithms from the field of mathematics are fundamental and have great potential to be applied in geographic decision-making. New algorithms of multi-objective optimization serve as an important source of new methods and tools for geography. This paper reviews a series of Nondominated Sorting Genetic Algorithms (NSGA-I/II/III), which are among the cutting edge and most popular algorithms in the field of multi-objective optimization. This review summarizes the principles, applications, improvements, and problems of these NSGA algorithms. Our findings include: NSGA-II is the most popular algorithm among the series because of its low computational complexity and high usability; NSGA-III has few applications in geographic decision-making for its sophisticated principles; currently, water resource management is the most successful field in applying the NSGA algorithms, and the experiences from this field are of use to others; and land use planning is the most successful field in improving the NSGA algorithms, making the NSGA algorithms more applicable to geographic decision-making. In the future, it is necessary to reduce the difficulty of applying the NSGA algorithms by summarizing typical issues in geographic decision-making and by developing user-friendly software tools for geographers. The efficiency of the NSGA algorithms can be further improved by coupling local searching strategies. It is also recommended to deeply incorporate the NSGA algorithms into the processes of geographic simulations.
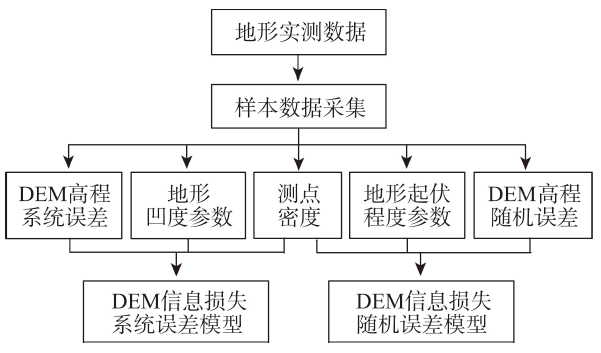
The errors of DEM derived from scattered topographic scanning data can be divided into errors propagated from topographic data to raster nodes and errors caused by information loss owing to scattered measuring data being incapable of completely reproducing the terrain surface. This study gave an analytical solution of DEM random errors propagated from data random errors in rasterizing the Triangulated Irregular Network (TIN) model by linear interpolation. Moreover, using the topographic scanning data of gullies recorded by a Terrestrial Laser Scanner (TLS), a method was derived for estimating the systematic and random errors caused by information loss in constructing DEM from the TIN model. The results show that both the mean systematic error and random error resulting from information loss are related to the density of effective measuring points which are located at the vertexes of triangles of the TIN model with at least a node of DEM inside them. Besides, the two kinds of errors are also related to terrain characteristics, among which the mean concavity has an impact on the mean systematic error and the terrain roughness affects the random error. For the DEM with a resolution of 0.1 m×0.1 m, the mean systematic error (Hd, in meter) can be estimated by
Land subsidence is an important factor that influences the sustainable development of a region. Due to the complexity of land subsidence, the uncertainty and risk caused by land subsidence disasters are increasing. Therefore, new methods need to be developed to quantify the nonlinear land subsidence processes, identify emerging risk, and improve urban resilience. In this paper, the necessity of introducing peridynamic to land subsidence modeling is discussed by analyzing the progress and shortcomings of current land subsidence modeling. For natural discontinuous structures such as fractures and faults, current deterministic models based on differential equations are insufficient to describe land subsidence. Therefore, the peridynamic theory which is suitable for discontinuous and nonlinear characteristics is introduced. The peridynamic theory (PD) describes the mechanical behavior of matter by solving integral equations and has advantages in analyzing discontinuous and multi-scale problems. The applicability of peridynamic in land subsidence is analyzed from the aspects of material properties and modeling methods, respectively. By establishing a peridynamic model of land subsidence, discontinuous disasters such as ground crack and ground collapse can be included, so as to realize the multi-field and multi-scale recognition of land subsidence under a unified framework. In the light of the “Higher-bigger-deeper” urban construction, combined with the CAS-ESM, the simulation of future evolution of ground subsidence and ground fractures can be carried out. However, there are still problems to be solved in the interdisciplinary research, such as the reasonable generalization of material properties, material structure, and the balance between operation accuracy and operation cost. Then, based on theoretical principles, the modeling method, solving process, and optimization method of peridynamic land subsidence model are given. Besides the establishment, solution and optimization of the model, a variety of spatial monitoring methods and data are also needed, e.g., subsidence data monitored by InSAR technology, the underground structure and density information obtained by Seismic Frequency Resonance Technology (SFRT), bedrock and stratified scale data, groundwater level data, building information data, and road network data. In this paper, a peridynamic land subsidence model with a range of 4km*6km and a depth of 0.2 km is established in Liyuan-Taihu -Zhangjiawan area in the eastern Beijing, and the evolution process of land subsidence is simulated by using the monthly average rate of groundwater level decline from 2007 to 2010 as the boundary condition. The mean absolute error between the simulated and the measured values is 18mm, which verifies the effectiveness of this interdisciplinary research. The peridynamic theory has superiority in the field of materials and the study of fatigue, damage, fracture, and so on. Our study provides new ideas and new methods for regional land subsidence modeling. Furthermore, with the support of big data, cloud computing platforms, and Geo-AI, new opportunities are emerging for preventing, controlling, slowing down, and avoiding land subsidence hazards.
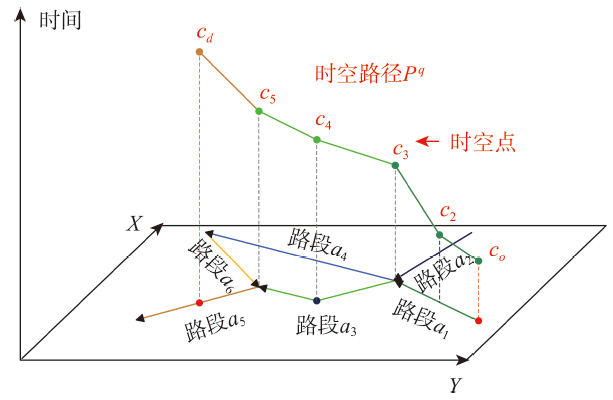
An adaptive spatiotemporal data model and a spatiotemporal index structure are proposed to support efficient storage and querying of network-constrained trajectories. The proposed adaptive spatiotemporal data model extends the hierarchical Compressed Linear Reference (CLR) data model by establishing the adaptive route-based linear datum in road network with high-frequency network routes mined from the trajectory dataset. Network-constrained trajectories can be transformed from the link-based linear datum to the adaptive route-based linear datum, and the transformed trajectories consist of fewer sub-entities that can be stored with lower storage capacity. The proposed adaptive spatiotemporal index structure is an extension of the LRS-based index structure, which is constructed based on the adaptive route-based Linear Reference System (LRS). Fewer spatiotemporal sub-entities are saved in the adaptive spatiotemporal index structure, which allows for efficient spatiotemporal querying of network-constrained trajectories. In order to verify the effectiveness of the proposed adaptive data model and index structure, adequate experiments are conducted at the end of this paper using the real open-source T-Drive taxi trajectory dataset and the synthetic trajectory dataset. The experiments take two popular spatiotemporal intersection queries as an example, and the proposed adaptive data model and index structure with the conventional hierarchical CLR data model and the LRS-based spatiotemporal index structure are compared in terms of storage efficiency and query efficiency. The analysis results show that the proposed adaptive data model and index structure can improve storage efficiency by 40% and query efficiency by 50%, which confirms that the proposed method can provide a new solution for the management of network-constrained trajectory data.
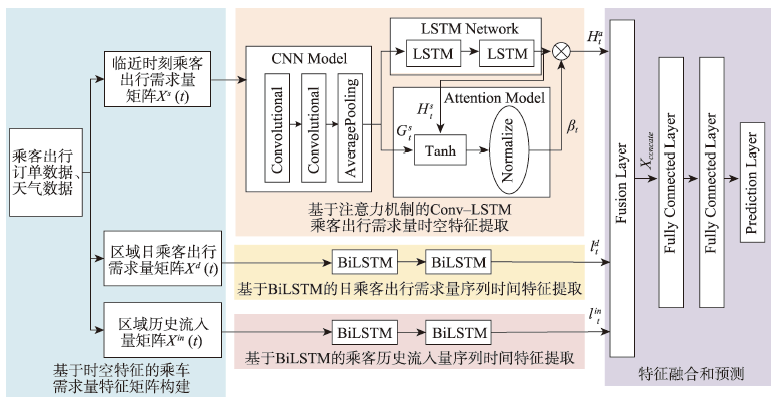
Passenger travel demand prediction is an integral part of intelligent transportation systems, and accurate travel demand prediction is of great significance for vehicle scheduling. However, existing prediction methods are unable to accurately explore its potential spatiotemporal correlation and mostly ignore the impact of historical inflow on travel demand. In order to further exploit the spatiotemporal characteristics of spatiotemporal big data and improve the accuracy of the model in predicting passenger travel demand, this paper proposes a Conv-LSTM Attention BiLSTM (CLAB) model for short-time prediction of passenger rental travel demand. The attention-based Conv-LSTM module extracts spatial features and short-term temporal features of passenger travel demand at the near moment, where the attention mechanism automatically assigns different weights to discriminate the importance of demand sequences at different times. To explore long-term temporal features, two BiLSTM modules are used to extract temporal features of historical inflow sequences and temporal features of daily passenger temporal features of the demand series. Experiments are conducted using the order data of online and cruising taxis on Xiamen Island, and the results show that: (1) the CLAB model is more suitable for predicting the future 5-min short-time passenger travel demand using 30-min historical data; (2) the overall effect error of the CLAB model is lower and has better prediction results compared with the benchmark prediction model. The CLAB model is more effective than the CNN-LSTM, LSTM, BiLSTM, CNN, and Conv-LSTM by 33.179%, 33.153%, 33.204%, 5.401%, and 5.914% in mean absolute error (MAE) and 34.389%, 34.423%, 34.524%, 6.772%, and 6.669% in Root Mean Square Error (RMSE), respectively; (3) the CLAB model performs better for weekday prediction with higher regularity than non-working day prediction, with best prediction for weekday morning peaks.
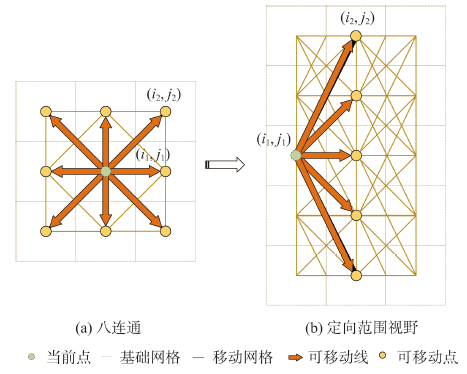
When a firefighting incident occurs in a wild complex mountain with no obvious roads or sparse roads, it is crucial to plan a safe and fast route through the complex mountain environment. Aiming at the problem that Ant Colony Optimization (ACO) is easy to fall into local optimum and the search time is long for complex mountain path planning, our study proposes an ACO algorithm for hiking emergency rescue path planning, which is suitable for fine-grained wild mountain environments. Firstly, our study analyzed the relationship between surface information and human movement speed based on existing literature and designed the objective function and heuristic function of the optimization algorithm considering two factors: surface shrub cover and terrain slope. Then, we used a combination of plane and field of view ant search combined with heuristic function and pheromone concentration to determine the next grid to be selected in the optimization process of the improved algorithm. Finally, the improved algorithm used a Laplace distribution to adjust the initial pheromone to improve the quality of the algorithm's initial solution. For the deadlock problem, the improved algorithm added isolated pheromones to prevent the next ant from falling into a deadlock dilemma. The improved algorithm used a genetic operator with grouping to update the global regular pheromone to avoid the ant colony from falling into a local optimum dilemma. In our study, we applied four ACO to the wild mountain environment of 400×400 grids, 1000 grids×1000 grids, 5000 grids×5000 grids, and 10 000 grids×10 000 grids for comparison, and set different starting and ending points for each environment. The experimental results show that each ACO using a combined planar and visual field search approach can obtain feasible paths in all four experiments, which verified the feasibility of the method. The quality of the paths using the improved algorithms was better than the other three algorithms, with improvements of 0.52%~4.95%, 4.71%~5.39%, 2.26%~13.11%, and 3.84%~9.16% in the four experiments, respectively, and the improved algorithm had shorter search time and convergence time. In addition, the combined planar and visual field search approach reduced the search space and improved the computational efficiency of the algorithm in the field 3D mountain environment. This search method was faster than the 8-connected method and reduced the average time consumption by more than 90%. Our algorithm is suitable for hiking path planning research in large 3D mountain scenes, with reduced planning time and improved path quality, providing technical support for the work of finding the best 3D mountain hiking paths without road networks.
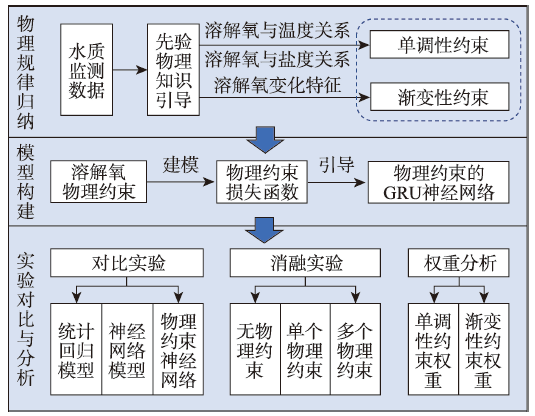
River water quality prediction plays a key role in water environment management and water pollution prevention. In recent years, artificial neural networks have been widely used in river water quality prediction. However, the lack of physical mechanism becomes a major limitation of artificial neural networks. As a result, the prediction results obtained by artificial neural networks are usually difficult to interpret and are unstable. To overcome this limitation, this study proposed a physics-constrained Gated Recurrent Unit model (PHY_GRU) for predicting dissolved oxygen in rivers. Specifically, two kinds of physical rules were identified, i.e., the rule of monotonicity and the rule of gradation. These physical rules were modeled as the loss functions of Gated Recurrent Unit (GRU). The water quality dataset in Atlanta, USA was used to evaluate the performance of the PHY_GRU. The experimental results show that: ① Compared with autoregressive integrated moving average, multilayer perceptron, and GRU model, the prediction accuracy and stability of PHY_GRU were the highest ( the root mean square error of prediction was reduced by 94.8%, 62.9% and 37.2%, respectively); ② the PHY_GRU performed best when different physical rules were considered simultaneously; ③ When PHY_GRU used 30% of the training samples of GRU, it could outperform GRU in terms of prediction accuracy and stability. The proposed PHY_GRU effectively incorporates physical mechanism into artificial neural networks and may be helpful for water management.
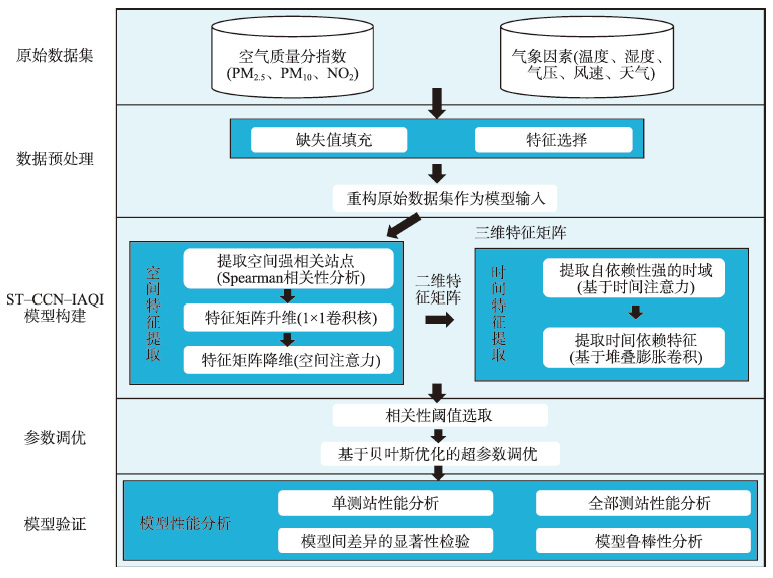
Accurate and fine-grained individual Air Quality Index (IAQI) prediction is the basis of Air Quality Index (AQI), which is of great significance for air quality control and human health. Traditional approaches such as time series modeling, Recurrent Neural Network (RNN) or Graph Convolutional Network (GCN) cannot effectively integrate spatial-temporal and meteorological factors and manage dynamic edge relationship among scattered monitoring stations. In this paper, a ST-CCN-IAQI model is proposed based on spatial-temporal causal convolution networks. Firstly, both the spatial effects of multi-source air pollutants and meteorological factors are considered via spatial attention mechanism. Secondly, time-dependent features in causal convolution network are extracted by stacked dilated convolution and time attention. Finally, multiple parameters in ST-CCN-IAQI are tuned by Bayesian optimization. In this paper, the Individual Air Quality Index (IAQI-PM2.5) data of Shanghai air monitoring station are used to carry out the experiment, and a series of baseline models (AR, MA, ARMA, ANN, SVR, GRU, LSTM, and ST-GCN) are employed to compare with ST-CCN-IAQI. Our results show that: (1) In the single station test, RMSE and MAE values of ST-CCN-IAQI are 9.873 and 7.469, respectively, which decreases by 24.95% and 16.87% on average, respectively; R2 is 0.917, about 5.69% higher than that of the baselines; (2) The prediction of IAQI-PM2.5, IAQI-PM10, and IAQI-NO2 of all stations proves that ST-CCN-IAQI has strong generalization ability and stability; (3) Shapley analysis shows IAQI-PM10, humidity, and IAQI-NO2 have a great impact on the prediction of IAQI-PM2.5. Friedman test under different data sampling conditions proves that ST-CCN-IAQI has significant performance improvement by comparisons with baselines. The ST-CCN-IAQI method provides a robust and feasible solution for accurate prediction of fine-grained IAQI.
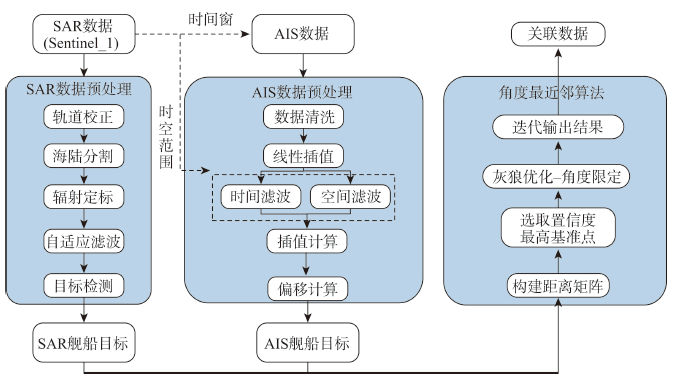
Improving maritime situation awareness is important for building an intelligent ocean. In order to solve the problems of perception blind area of single source sensor and poor performance of multi-source sensor data association in dense area, this paper proposes an angle nearest neighbor data association method with strong anti-interference based on Synthetic Aperture Radar (SAR) and Automatic Identification System (AIS) data. The spatial angle relationship between SAR and AIS is utilized to improve the accuracy of point trace correlation of ship targets in dense areas. Firstly, the spatiotemporal filtering is performed on AIS data to realize data coarse association, and a data candidate set for association analysis is constructed. Then, from the perspective of spatial relationship of spatiotemporal data, inspired by gray wolf optimization and Hungarian algorithm, the eigenvector matrix of point trace pair is operated to achieve the optimal association of multi-source spatial data. Finally, the confidence of the results is evaluated by combining the geometric relationship of the data. In this paper, five SAR images and AIS data are selected for experiments, and simulation experiments are designed based on SAR image data and the distribution density of ship trajectory points. The results show that, in the case of dense distribution, the correlation accuracy of the angular nearest neighbor data association method proposed in this paper is 3.62 and 4.61 times that of the traditional nearest neighbor algorithm and global nearest neighbor algorithm, respectively. The running time of our proposed method is 1.69 s, which is only 1.36 s longer than nearest neighbor algorithm and only accounts for 0.49 percent of global nearest neighbor algorithm’s running time. By comparison, our proposed method has stronger anti-interference ability and can achieve good correlation accuracy in dense areas with little increase in the running time.
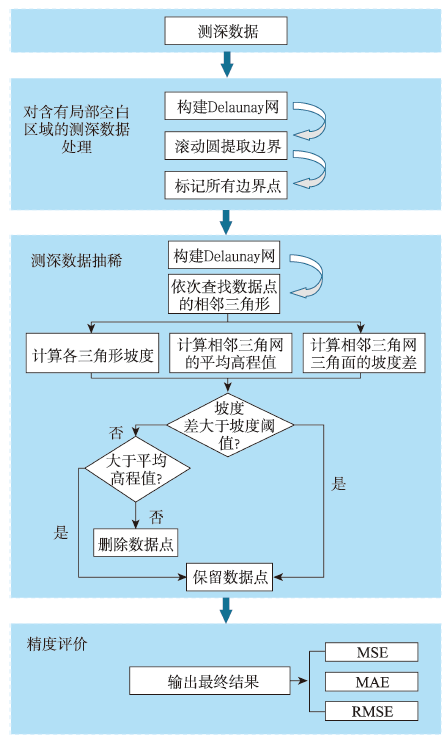
The submarine topographic data are important data source for marine scientific research and engineering construction. The bathymetric information, as the basic information of submarine topographic data, reflects the undulating changes of submarine topography. Therefore, how to effectively process bathymetric data has become a key research content of marine mapping. In order to solve the problem of data redundancy of massive multibeam bathymetry data, a multibeam bathymetry data thinning algorithm taking into account the slope and elevation is proposed, which can balance the accuracy of data thinning and the retaining of topographic feature points. Considering that the multibeam bathymetry data contain local blank areas such as cavities and concave boundaries, the Alpha Shape algorithm is first used to extract boundary points from the multibeam bathymetry data, so as to avoid the problem of losing terrain feature points due to thinning of the local bathymetry data blank areas. Then, a combination of slope and elevation thinning algorithms was used to delete redundant points and retain terrain feature points, and the boundary points of the thinned multibeam bathymetric data (containing local blank areas) are combined to obtain final thinning results. The accuracy is evaluated by using the checkpoint method. In the study area, the comparison experiments are carried out using the slope-based thinning, terrain complexity-based thinning, and system based thinning algorithms as references. The results show that: (1) The isobath derived from our proposed algorithm in the area containing local blank areas is closer to the isobath variation of the original bathymetric data compared to three reference thinning algorithms, and can more precisely express the fine features at the concave boundaries, hollows, and other areas and effectively maintain the morphological integrity of the seafloor topography; (2) The accuracy of the proposed algorithm is improved in different degrees compared with the reference thinning algorithms. Especially, as the thinning rate decreases, the Mean Square Error (MSE) of the proposed algorithm is decreased by 16%, 27%, 14%, and 10%, 36%, 2%, respectively in two kinds of terrain, and the Root Mean Square Error (RMSE) is decreased by 7%, 12%, 7% and 5%, 17%, 3% for two types of terrain, respectively, which demonstrates the effectiveness and generalizability of the proposed algorithm for thinning of multibeam bathymetric data in different types of terrains, improving the accuracy of bathymetric data thinning effectively, and meeting the needs of subsequent bathymetric data construction of high-precision seafloor topography.
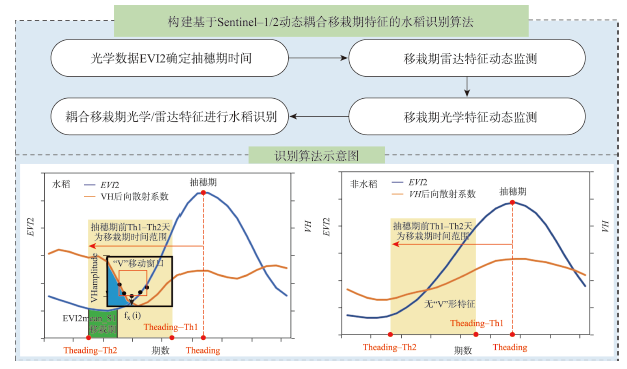
Accurate and timely spatiotemporal change information of rice planting patterns is significant for effectively preventing "no-grain" and achieving carbon peak and carbon neutrality goals. However, it is challenging to establish a rice mapping method at large spatial domain. This study developed a novel paddy rice planting mapping method based on dynamic coupling optical/radar features of transplanting period. The proposed algorithm was applied to paddy rice mapping in Jiangxi and Hunan province. The derived paddy rice planting map was evaluated using 1402 ground reference sites, and it had an overall accuracy of 92.80%. The paddy rice planting area was also highly consistent with the agricultural census data (R2 > 0.85) at the county level. Compared with rice feature extraction using a fixed window, the proposed method has strong robustness and migration ability, and provides a new idea and reference for crop mapping at large spatial domain. The result showed that the paddy rice planting area in Jiangxi province decreased by 3460 km2 (9.47%) from 2018 to 2021. The rice cropping intensity in Jiangxi province had decreased by 0.13 due to the change of double-cropping rice to medium rice. The double-cropping rice planting area decreased by 21.61%, with 84% shifted to single cropping rice.
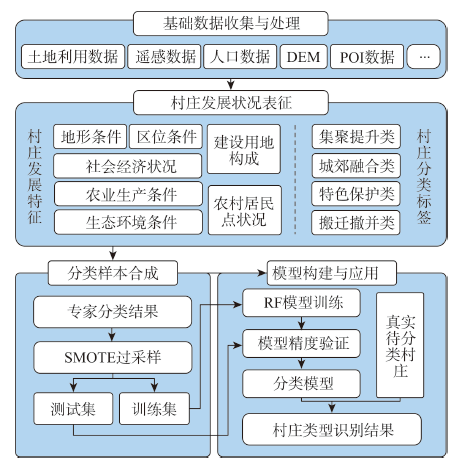
To achieve sustainable development and revitalization of the rural areas, it is significant to identify the development pattern of villages according to their natural, social, and economic conditions. To accurately identify the development pattern of villages in rural areas, this study aims to develop a village classification method based on the SMOTE-RF algorithm. To achieve this goal, first, we designed a multi-dimensional index system that includes aspects of topography, location, socioeconomics, agricultural production, construction lands, ecosystem services, and characteristics of rural settlements, to quantify and assess the development characteristics of villages. Second, the classification information of villages identified by planning experts were collected as a sample dataset for model training and validation. To address the overfitting issues of classification algorithms caused by imbalanced sample sets, an oversampling algorithm called SMOTE was applied to produce a balanced synthetic sample set from the original sample set obtained by planning experts based on the K-nearest neighbor strategy. Third, the balanced sample set produced by SMOTE algorithm was used to train the classifier for village classification. Then, the nonlinear relationship between the multi-dimensional development characteristics of the villages and the development pattern of villages was identified using the Random Forest (RF) algorithm. Finally, Zhaoyuan city, which is located in Shandong Province, China, was selected as the study area to evaluate the performance of our model. The experimental results show that the classification model we built based on the SOMTE-RF algorithm can automatically extract the multi-dimensional and nonlinear expert knowledge for village classification from a small number of samples. Compared with the unsupervised classification methods such as SOFM algorithm, the classification results produced by our model can better support the spatial planning decision-making, because the SMOTE-RF algorithm can intuitively present the classification rules in a tree structure. In addition, with the application of oversampling algorithm, the overall accuracy, the accuracy, and the AUC value of the classification model were increased from 0.93 to 0.99, 0.73 to 0.88, and 0.895 to 0.982, respectively, compare with the model results without oversampling. The village classification results in Zhaoyuan also demonstrated that the results obtained by SMOTE-RF algorithm were overall consistent with that of planning experts. For instance, the consistency between the results classified by our model and the planning experts reached 88.27%, and the Kappa coefficient was about 0.78. The village classification model we developed in this study can significantly reduce the uncertainty of the classification results, thus providing a reliable decision-making basis for the territorial planning and rural revitalization.
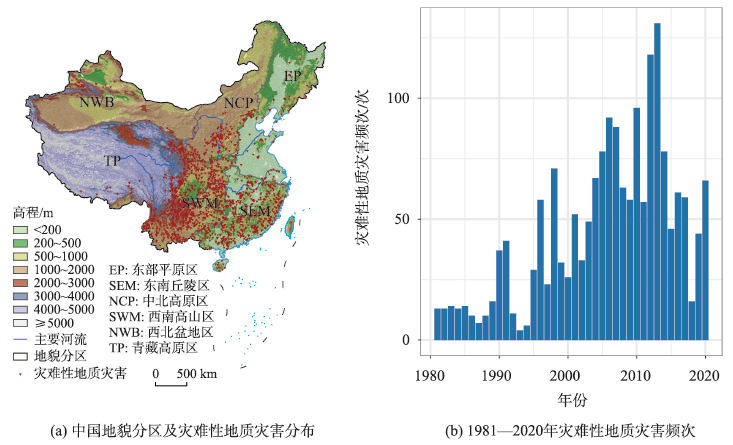
The frequency and intensity of extreme precipitation events are projected to increase under climate change scenarios, which may result in increasing risk of rainfall-induced landslide in some parts of the world. Based on the established national scale rainfall-induced landslide susceptibility model and cumulative rainfall -rainfall duration threshold curves for different geomorphic regions, this study employs the latest CMIP6 global climate model ensemble to assess the changes in landslide hazard in China under global warming in terms of both the spatial landslide susceptibility and frequency resulted from rainfall events exceeding the threshold of landslide occurrence. The results show that the multi-year mean annual precipitation projected by the CMIP6 multi-model ensemble is likely to increase by 5.4% to 9.5% under the 1.5°C and 2.0°C warming scenarios compared to the baseline period, resulting in a projected increase of 0.33% to 0.74% in moderate to very high landslide susceptibility areas, and a projected increase of 7.0% to 11.2% in landslide frequency due to the projected increase in extreme precipitation events. By further combing the projections of future population distribution, the potential exposed population is expected to increase by 620 million (18.90%) and 426 million (12.97%) under the 1.5°C and 2.0°C warming scenarios, respectively. The projected landslide hazards under the future scenarios increase in each geomorphic region, and there exists significant spatial heterogeneity. The range of moderate to very high susceptibility under a 2.0°C temperature rise scenario increases by 0.71%~1.28% compared with the baseline period, and the landslide occurrence frequency is projected to increase by 1.2%~15.6%. The CMIP6 multi-model ensemble projections reveal hotspot areas where landslide susceptibility level and frequency are expected to increase under warming scenarios, including the southeastern Tibetan Plateau, the Tianshan Mountains in the northwest, and the Kunlun Mountains at the border of the Tibetan Plateau. And Qilian Mountains in the southwest mountainous region, the Loess Plateau and the Taihang Mountains in the south of the north-central plain region, and the Changbai area in the eastern plain region, are also key areas where appropriate landslide risk mitigation measures for climate change adaptation are needed. Considering the future population changes, our results show that the potential landslide exposed population in the Qinghai-Tibet Plateau area is expected to decrease by 4.68 million to 9.28 million, respectively, due to the obvious decrease in predicted future population, while the potential landslide exposed population in the southeastern hilly area increases by 396 million and 300 million, respectively, when temperature rises by 1.5°C and 2.0°C.
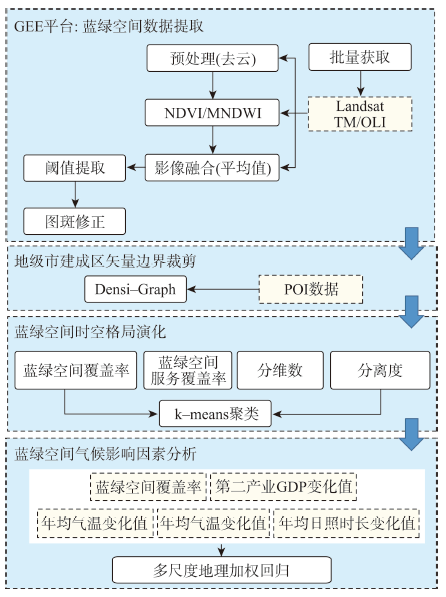
Blue-green space plays a prominent role in urban ecological security. This study built a blue-green database of 272 prefecture-level urban built-up areas in China using NDVI and MNDWI in 2005, 2010, 2015, and 2020 based on Google Earth Engine (GEE). Combining with the coverage rate, 300-meter service coverage rate, the fractal index distribution, and the landscape division index, the spatiotemporal pattern of the blue-green space and its climate factors were examined. The results show that: (1) The blue-green space in urban built-up areas in prefecture-level cities presented an overall pattern of “higher coverage in south than that in north”. While the south showed a pattern of “higher in west than east”, and the north had a pattern of “higher in east than west”. Particularly, the Bohai Rim area was marked as a basin of low coverage. The temporal trend of overall blue-green space was increasing except for a few cities in Central China; (2) In terms of different zones, the highest coverage rate (> 65%) of blue-green space in urban built-up areas occurred in Southwest China where the landscape division index was the lowest (< 0.60), and the coverage rate of Northwest China varied greatly. The North China indicated the lowest coverage (10%~30%) of blue-green space and a highest landscape division index (~0.98); (3) Based on the Multi-scale Geographically Weighted Regression (MGWR), the R-square value and the adjusted R-square value were 0.85 and 0.83, respectively. The impact of precipitation on the blue-green space coverage in urban built-up areas was significant and positive, while the temperature had negative impact on blue-green space. The impacts of climate factors were mostly equivalent to human activities but were stronger in certain periods.
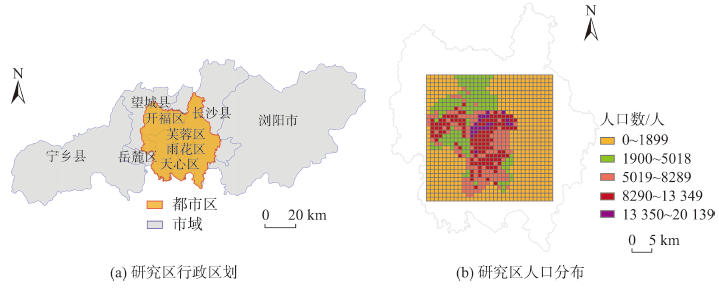
The spatially explicit infectious disease transmission model has been widely used in urban epidemic prevention and control since it can better simulate the transmission processes of infectious diseases in cities. However, most of the existing spatially explicit models simulate the flow behavior of urban population based on the random population flow pattern, and do not consider the commuting-based population flow pattern in the city. Taking the Hand, Foot, and Mouth Disease (HFMD) transmission process in Changsha city from the 1st to the 49th week of 2014 as an example, this paper combines periodic SEIR dynamic models with five different population flow models including 4, 8, 24 adjacent diffusion models, gravity model, and radiation model. Thus, five infectious disease transmission models are formed, and the respective advantages and applicable scope of different transmission models are clarified by comparing their temporal and spatial accuracy. The experimental results show that each model has its premise and scope of application. The transmission model based on 24-neibor diffusion has the highest fitting accuracy of the number of HFMD cases (
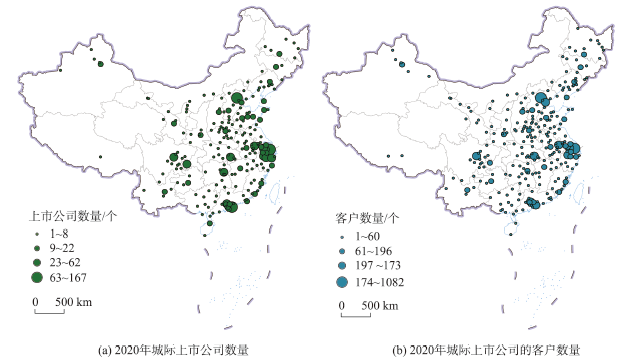
The connection between enterprises is an important part of urban connection. Strengthening the analysis of urban functional network based on the connection between enterprises is of great significance to enrich the theoretical research of urban network. Based on the trade relationship data between listed companies and their top five customers from 2010 to 2020, this paper constructs China's urban network, and analyzes the spatio-temporal evolution characteristics of urban network based on the perspective of trade links between enterprises. The research shows that: ① From 2010 to 2020, the urban network scale shows the characteristics of first rising and then falling, and the overall network density is low, ranging from 0.014 to 0.018. The center of gravity of the network presents the trend of "S" - shaped spatial trajectory change and overall southward movement.This feature is consistent with the trend of China's economic center moving southward in recent years. The overall spatial structure of the network changes from coastal to "T" - shaped structure. This feature is consistent with the "T" strategy of China's land development. ② The network traffic is concentrated in a few node cities. The total amount of capital in and out of the top 20 cities accounts for 71.9% of the total capital flow. Beijing and Shanghai are the absolute core of the network. The provincial capitals or sub provincial cities such as Hangzhou, Wuhan, Shenzhen and Guangzhou assume the function of regional centers. Foshan, Qiqihar, Nantong and other manufacturing developed cities are important nodes. It indicates that trade links are more likely to occur in cities with high administrative levels or developed industries. ③ The Pearl River Delta has the highest network density, which is between 0.324 and 0.334. The Yangtze River Delta has the highest total trade flow, which is 78.35 billion yuan. Although the networking level of urban agglomeration in the middle reaches of the Yangtze River and Chengdu Chongqing urban agglomeration is relatively low, they have become an important force to promote the evolution of network structure. ④ The COVID-19 has had a significant impact on the trade flow and network structure of the overall network. The network associations have been further divided and reorganized. The Guangzhou Shenzhen associations have been significantly strengthened. It shows that Guangzhou and Shenzhen have a strong combination effect. The Shanghai associations have been significantly weakened. The research results have a certain reference value for promoting the construction of domestic big cycle and unified big market.