The discrete global grid system refers to the discrete partitioning of the earth's surface into grid cells with multi-resolution hierarchical structure according to certain rules, which is widely used in organization, management, and analysis of massive multi-source spatial data. The hexagonal global discrete grid has excellent geometric properties and is well suited for spatial data processing. However, how to further improve the efficiency of the hexagonal global discrete grid coding operation is still the focus of current research. In this paper, we adopt the model of icosahedral snyder equal-area projection aperture 4 hexagonal discrete global grid system and construct the base coding structure of aperture 4 hexagon based on the correspondence between the hexagonal triaxial coordinates and the coded binary numbers, consisting of 7 base digits in the first layer and 4 base digits int the other layer. We divide the icosahedron into 3 base hexagonal subdivision tiles according to the different subdivision structures and adopt the base coding structure for coding scheme in each hexagonal subdivision tile to establish the aperture 4 hexagonal discrete global grid coding scheme. Besides, this paper designs and implements a fast conversion between aperture 4 hexagonal code and hexagonal triaxial coordinates, based on which an efficient aperture 4 hexagonal discrete global grid encoding operation scheme is constructed, including arithmetic operation of encoding, spatial topology operation, and neighbourhood retrieval operation and cross-plane operation of encoding. Compared with the existing hexagonal discrete global grid coding scheme, the coding scheme proposed in this paper has fewer base code digits, is more concise, and facilitates faster conversion to the hexagonal triaxial coordinates of the grid. Compared with the existing coding operation scheme, the proposed scheme further improves the efficiency of coding arithmetic operation, spatial topology operation, and neighbourhood retrieval operation. The coding addition operation is 2~3 times more efficient than HLQT. The neighbourhood retrieval operation is 3~5 times and 2~3 times more efficient than HLQT and H3, respectively, and is less affected by the coding level of the grid coding. The proposed coding scheme in this paper has the same efficiency of additive operation and subtractive operation, and the efficiency of spatial topology operation is 2 times that of arithmetic operation. The coding cross-plane neighbourhood retrieval operation time is slightly longer than that of the in-plane operation, and the impact on the overall operation time is not significant. This study provides support for the research application of discrete global grid system.

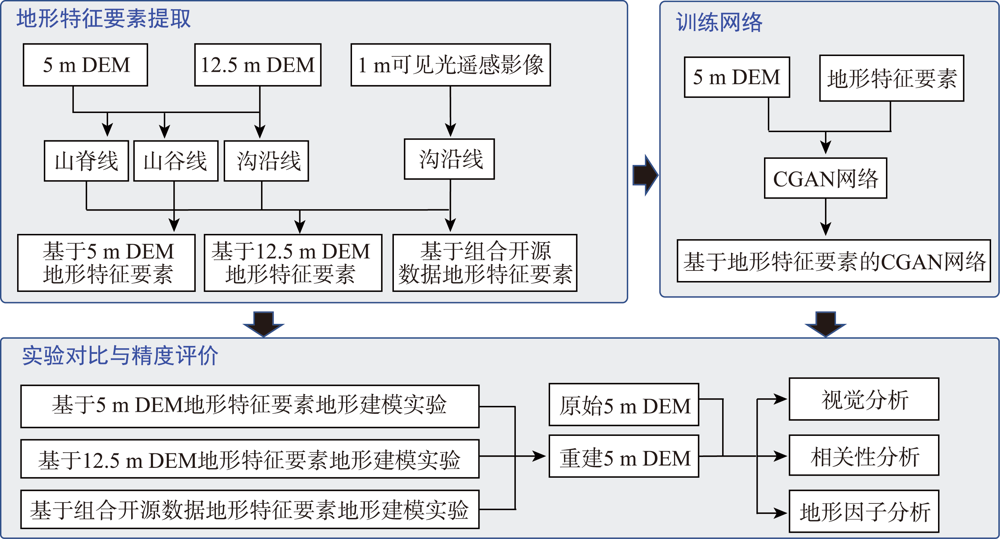
How to use a small number of topographic features to restore the topography has been a difficult problem in the field of geology. In this paper, we extract topographic features from open source datasets, and construct Conditional Generative Adversarial Networks (CGAN) for DEM generation using topographic features as constraints, a comparative experiment was designed based on the combination of open-source DEM, open-source DEM and remote sensing image, as well as the generation of DEM by extracting topographic features from the high-precision DEM with a resolution of 5 m, the results were compared and evaluated by visual effect, correlation analysis and topographic factors. The results show that: (1) in the visual effect, the DEM generated by three different methods are very close to the original DEM with a resolution of 5m, which is much better than the traditional interpolation method, (2) the correlation between DEM generated by three different methods and the original DEM with a resolution of 5m is more than 0.75, and the result of reconstruction based on dem with a resolution of 5 m extracted from open source and remote sensing image with a resolution of 1m is closest to that of the original DEM with a resolution of 5m, the correlation between DEM and original 5m DEM can reach more than 0.85. (3) in the aspect of terrain factor, based on dem with a resolution of 5 m and remote sensing image with a resolution of 1m, the distribution trend of slope and aspect of reconstructed DEM is most consistent with the original DEM with a resolution of 5 m. This paper provides a new idea for high-precision DEM modeling. In the areas where high-precision DEM is difficult to obtain, high-precision terrain modeling can be carried out by using open source data sets and Conditional Generative Adversarial Networks, so as to conduct geoscience analysis and geographical simulation.
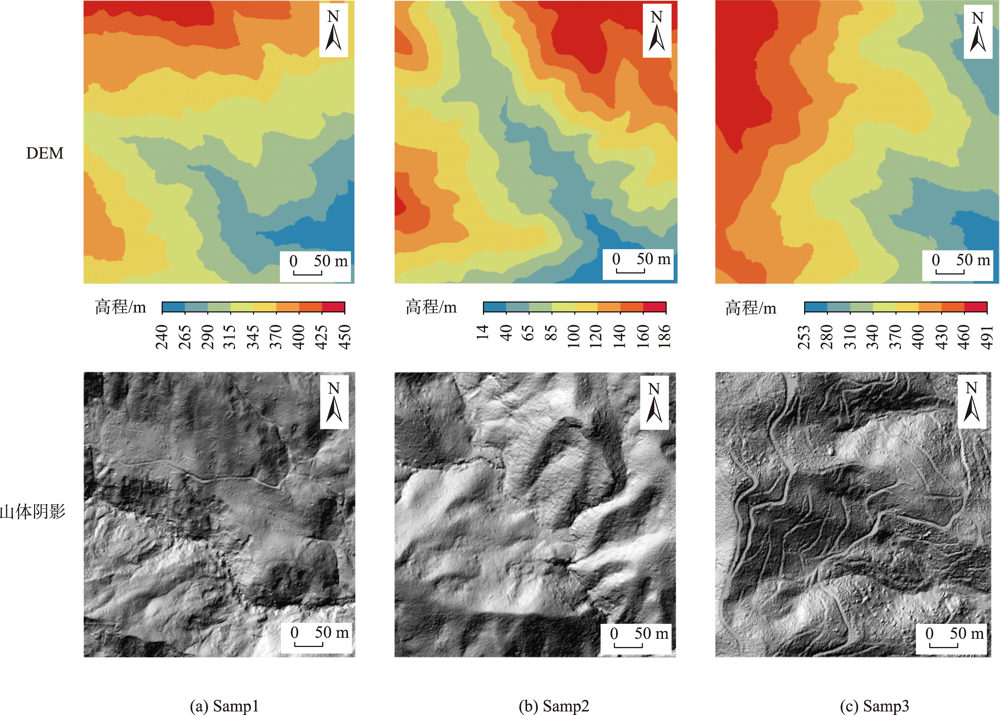
Airborne LiDAR point clouds are the main data source for obtaining high-quality Digital Elevation Model (DEM), and surface roughness, as the main derivative of DEM, plays an important role in geoscience research. However, there is no clear conclusion about the influence of the airborne LiDAR point cloud data density and interpolation methods on the accuracy of DEMs and surface roughness. Thus, this paper evaluates the performance of five classical interpolation methods including Ordinary Kriging (OK), Radial Basis Function (RBF), Triangulated Irregular Network (TIN), Natural Neighbor (NN), and Inverse Distance Weighting (IDW) for quantifying surface roughness using different LiDAR data density (90%, 70%, 50%, 30%, and 10% of the original data) in three study sites with different terrain characteristics. The results show that: (1) the accuracy of each DEM interpolation algorithm decreases with the decrease of point cloud density, and when the data amount is reduced to 30% of the original data amount, the accuracy of different algorithms is obviously different. Among them, RBF and OK have the highest accuracy, while IDW has the lowest accuracy; (2) the DEM error is positively correlated with surface roughness. With the decrease of data density, the correlation coefficients between DEM error and roughness obtained by OK, RBF, and IDW methods all decrease, and the correlation coefficients between DEM error and roughness obtained by TIN and NN decrease first and then increase at density of 30%; (3) The surface roughness error extracted from DEM based on all interpolation methods increases with the decrease of data density, and the accuracy of IDW derived roughness is the highest when the data density is 90% and 70%. When the data density is reduced by 50%, RBF can capture terrain changes more accurately.
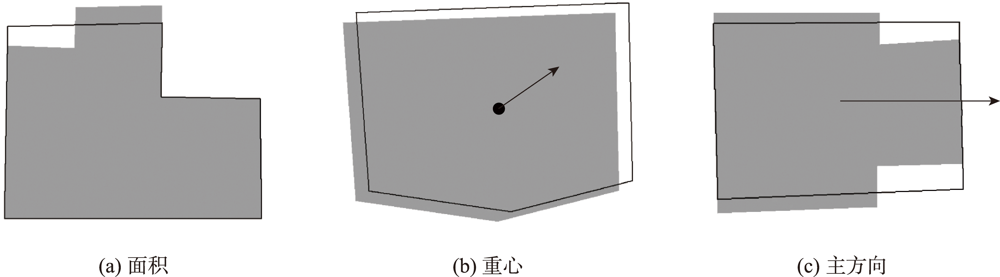
Settlement generalization is an important step for scale transformation, data fusion and integration, data mining, etc. The methods of settlement generalization include selection, simplification, dimension reduction, merging, and typification, among which simplification has been commonly used method. In large scale data, settlement usually exists in the form of building polygon, so the building simplification has always been the focus of settlement generalization. The essence of building simplification is to delete or edit the points that constitute the boundary, and extract the original figure as a simple polygon, while keeping the basic features of the building. In view of the problem that the current simplification method only focuses on one aspect, this paper proposes a combined building simplification method considering multi-feature constraints. Firstly, redundant points and sharp corners are deleted. Then the short edges that need to be simplified are screened according to the simplification threshold, and their local structures are automatically classified and recognized. Furthermore, the influence of the characteristic constraints such as the location, area, direction, and shape of the building is fully considered, and different simplification operations are adopted for different structural types. In the process of simplification, a progressive method with gradually increasing threshold value is adopted until the simplification requirements are met. Finally, the simplification results are evaluated from multiple features and the unreasonable simplification entities are adjusted and modified. Taking OpenStreetMap data as an example, and compared with other simplification methods, the experimental results show that the proposed method can effectively keep the basic features of buildings, such as area, shape, and orthogonal angle, and realize automatic and continuous simplification of buildings, with certain universality.
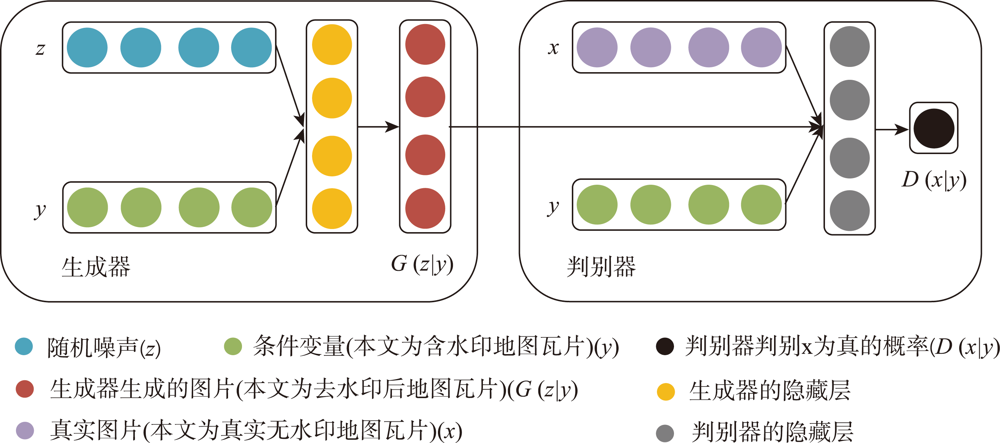
Watermarks play an important role in the copyright protection of electronic map tiles. Research on visible watermark removal can help to evaluate the effectiveness of watermarks and improve anti-attack capabilities in an adversarial manner. The existing deep learning-based methods of visible watermark removal have problems such as requiring a large number of training samples, low efficiency, and watermark residual or unrealistic maps generated in results after watermark removal. To address these problems, inspired by the idea of image inpainting, this paper proposes a method based on conditional Generative Adversarial Networks (CGAN) to remove the visible watermarks on electronic maps. The network model mainly consists of a generator and a discriminator. Specifically, the generator adopts a U-Net structure, which includes an encoding stage and a decoding stage. In the encoding stage, multiple convolutional layers are used to obtain multi-scale features of the input watermarked map tile, and jump connections are used in the decoding stage to stitch features and up sample them to generate the watermark-free map tiles. The discriminator uses patch GAN, a full convolutional network model based on region discrimination, to evaluate the authenticity of the generated map tiles. In order to enrich the details and improve the verisimilitude of the generated maps, this paper further adds perceptual loss and L1 loss with the adversarial loss of CGAN. By optimizing the loss function of the real watermark-free map and the generated watermark-free map, an extremely real-like generated watermark-free map can be obtained. The proposed model has been extensively tested on a road map dataset, which was retrieved from domestic and foreign electronic map manufacturers such as Google, Gaode, Baidu, etc. It includes over 3000 watermarked map tiles with different watermark patterns like texts, colorful logos, and both. The results demonstrate that the proposed model in this paper can realize batch removal of visual watermarks on various map tiles such as navigation electronic maps and remote sensing images, and the training speed of the model is 4 times faster than the FCN-based approach. The comparison results by using different combination of loss functions show that the proposed perceptual loss and L1 loss can significantly improve the values of the evaluation metrics of MSE, PSNR, and DSSIM, which explain the similarity of the generated map tiles with the real map tiles. In a word, the approach proposed in this paper is efficient and simple. It can effectively protect the geometric and geographic information in the map tiles after watermark removal and realize batch removal without manual interferences.
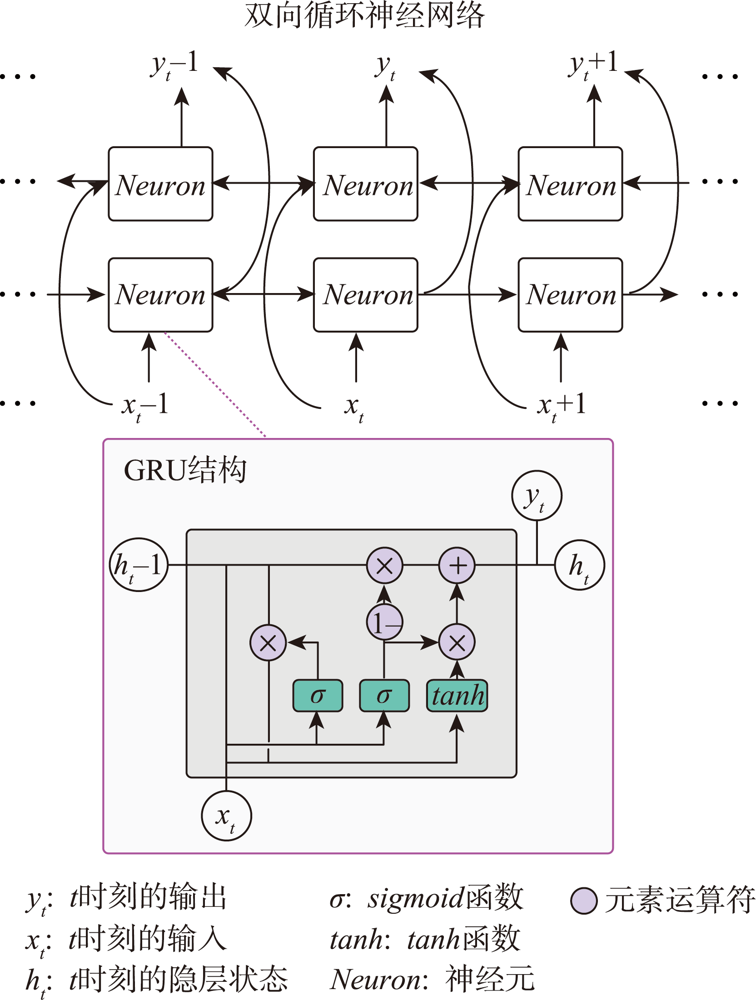
In order to achieve accurate high-frequency forecasts of tourist flow for tourist attractions, this study proposes a forecasting method based on LBS and deep learning techniques. This method generates spatial-temporally controllable forecasts by converting the LBS data and using the core model — Deep Bidirectional Gated Recurrent Unit (DBi-GRU) model — built based on Bidirectional Recurrent Neural Network and GRU algorithms. To test the performance of our proposed method, we take the Shenzhen Dameisha Waterfront Park as an example, and three analysis methods including fitting curves, error criteria, and DM tests are used to test the forecasting performance of our DBi-GRU model. Additionally, five other deep learning models are set as reference models to compare with our model. The experimental results show that, first, DBi-GRU model proposed in this study has ideal forecasting performance in high-frequency forecast of tourist flow for tourist attractions and yields highly accurate forecasts in peak periods of tourist flow, and its performance is much better than the other deep learning models. Second, Bidirectional Recurrent Neural Network based models, particularly the Bidirectional LSTM based model, generally provide better performance than conventional Recurrent Neural Network based models. Though the forecast accuracy of the Bidirectional LSTM based model is not as high as DBi-GRU model, there is no significant difference between their model capability. Third, using the same network parameters, GRU algorithm has higher forecast accuracy than LSTM and RNN algorithms which are used by previous researchers. This study develops a new method for high-frequency tourist flow forecasting, and the high-frequency information forecasted in this study provides information support for management tasks of tourist attraction such as crowd control, service arrangement, etc..
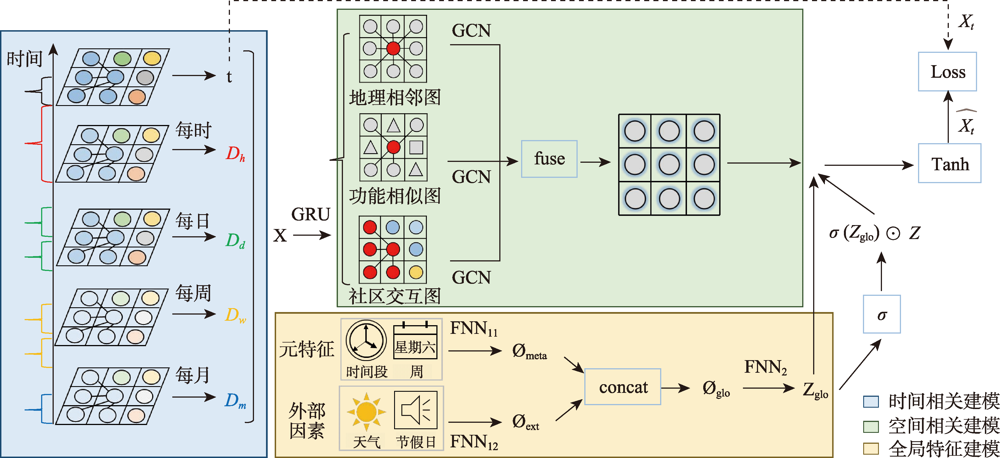
With the popularization of smartphones, online car-hailing has become a common travel alternative and plays an important role in meeting public travel demand. Therefore, online car-hailing operation platforms have been a major component of Intelligent Transportation Systems in which passenger demand prediction is one of the core problems to be solved. However, models proposed in the existing literature usually ignore the long-term temporal correlation and multiple spatial correlations. This paper presented a Spatio-Temporal Multi-Graph Convolutional Network Fused With Global Features (GST-MGCN) to address the limitations of existing research achievements, taking full account of the unique spatiotemporal correlations of the travel demand of online car-hailing passengers. Following the Closeness, Period, and Trend (CPT) paradigm, the model fitted temporal dependencies with time series information. By identifying multiple spatial semantic correlations, the corresponding relational graph structure was constructed, and a multi-graph convolutional model was built in which the global features fusion module employed gated fusion and sum fusion methods to capture sudden and gradual changes of passenger demand, respectively. Taking the Haikou city dataset as an example, our experimental results show that the values of the three indicators, MAE, RMSE, and MAPE of the GST-MGCN model proposed in this paper were 2.269, 3.917, and 21.447, respectively, which were lower than those derived from other similar mainstream models. This study demonstrated that the proposed model GST-MGCN can effectively mine the spatio-temporal pattern of online car hailing passenger travel demand, extract the impact of global features, and accurately predict it.
There are not only significant regional differences in China, but also great differences in natural conditions and human environment. In the context of the increasingly serious ecological crisis and the accelerated construction of ecological civilization, China's special regional differences and natural and humanistic environment limit the even distribution and orderly development of population and the overall spatial layout of social economy, which leads to large, widely distributed Wilderness Areas (WAs). Wilderness plays an important role in carrying out the evaluation of resources and environmental carrying capacity, ensuring the long-term existence of biodiversity, dealing with human-land relationship, and building national parks and ecological security barriers. Therefore, it is particularly important to objectively and accurately define the spatial distribution range of WAs and analyze its temporal and spatial evolution pattern. At present, there are few studies on the area, distribution, characteristics, and spatiotemporal evolution pattern of WAs. Based on the multi-source spatial data in 2000, 2010, and 2020, from the perspective of decision-making and influence, this paper took climate comfort and topographic relief as the decision-making indexes, and the human influence degree as well as remoteness as impact indexes to construct a multi-factor identification model of wilderness, defined the spatial scope of WAs in China, and analyzed its geographical distribution characteristics and spatiotemporal evolution pattern. The results show that: (1) Based on multi-source spatial data, selecting the suitability index system and establishing the coupled WAs determination-influence relationship approach can accurately and effectively identify and analyze the spatial and temporal distribution patterns of WAs in China; (2) In China, the WAs were distributed centrally in a large scale and dispersed in small areas in space. The total area of WAs in these three periods was 3.4418 million km2, 2.9767 million km2, and 2.7986 million km2, respectively, mainly distributed in Tibet, Xinjiang, Qinghai, Inner Mongolia, Heilongjiang, and other provinces; (3) From 2000 to 2020, most of China's WAs came from grasslands and unused land, and its area showed a downward trend with a larger reduction rate in 2000—2010 than that in 2010—2020; (4) Most of the nature reserves and the first batch of national parks were distributed in the WAs. Tibet was the area that was protected most, followed by Xinjiang, Qinghai, Inner Mongolia, Gansu, and so on. In 2020, the protected area of WAs reached 632 100 km2, accounting for 69.32 % of the total area of nature reserves.

The deepening of the innovation-driven strategy has promoted the prosperity of the entrepreneurial economy, and the high-tech start-ups have increasingly become the decisive force to promote China's tech progress and high-quality economic development. With the assistance of the data of China's tech start-ups from 2015 to 2020, this paper combines the methods of Thiel index and kernel density estimation to explore the spatial-temporal evolution characteristics. At the same time, an analytical framework is constructed for the development of tech start-ups based on the entrepreneurial ecosystem theory. The OLS model and SARAR model are established to quantitatively identify the influential factors of the distribution of tech start-ups. Three conclusions are drawn: (1) From the perspective of time series, the number of tech start-ups in China is growing rapidly from 2015 to 2020. The tertiary industry enterprises occupy a dominant position in its industry composition, and the proportion of the number is gradually increasing. However, the distribution in the urban system presents a continuous hierarchical structure. Most cities have little change in the hierarchical system, and some cities have jumped up the hierarchy in the wave of mass entrepreneurship and innovation; (2) From the perspective of spatial pattern, China's tech start-ups present a multi-core distribution pattern, with the Yangtze River Delta and Pearl River Delta as the main core, and The Beijing-Tianjin-Hebei region as the secondary core. Entrepreneurship hot spots have expanded from the three core regions to more regions, with Chengdu, Wuhan, Zhengzhou, Xi'an, and other cities becoming secondary cluster centers. But the imbalance between the three regions of East, Central, and West is increasing, the intra-regional differences are greater than the inter-regional differences; (3) Venture capital, knowledge thickness, human capital, market size, incubation environment, and policy environment have positive effects on the development of tech start-ups. Entrepreneurial ecosystem also shows the influence of spatial dependence and spatial heterogeneity. Moreover, the effect intensity and relative importance of different influencing factors are different in different development stages. The research results are helpful to promote the discussion on location choice of regional emerging industries and the development of entrepreneurial ecosystem theory. In the future, the government should attach importance to the construction of high-quality tech entrepreneurship ecosystem, and the driving path suitable for the development of local tech start-ups should be selected according to local conditions. At the same time, it is necessary to strengthen resource interconnection and strategic cooperation with geographical proximity areas.

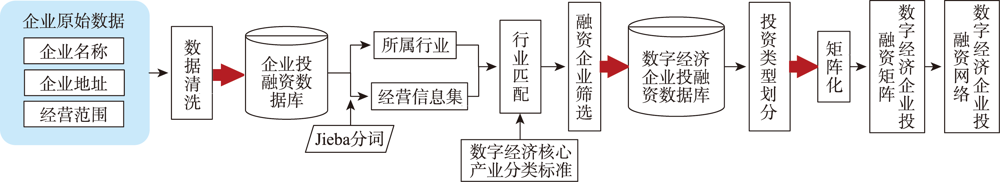
The digital economy is an important engine for building a modern economic system. Corporate investment is an important factor driving the growth of the digital economy. The development and decision-making of the digital economy industry requires an urgent insight into the structural characteristics of the investment and financing of related companies and their temporal and spatial evolution patterns. This paper takes Fujian Province, the ideological source and practical starting point of "Digital China" as a research case, based on the investment and financing data of digital economy enterprises from 2000 to 2021, adopts complex network analysis and negative binomial regression model, and takes prefecture-level cities as the basic research unit to explore spatial characteristics and influencing factors of investment and financing of digital economy enterprises in Fujian Province. This research finds that: firstly, the investment and financing scale of digital economy enterprises in Fujian shows an increasing trend, and the source of investment has changed from non-digital economy enterprises to digital economy enterprises. Secondly, the proportion of inter-provincial of investment has gradually increased. Inter-provincial of investment increases from 856 million yuan in 2000 to 28.808 billion yuan in 2021, and the proportion increases from 11.59% to 31.06%. The amount of financing is "high in the east and low in the west". Thirdly, Fuzhou has always been the preferred city for corporate investment, but with the passage of time, Xiamen, Quanzhou, and other hubs continue to emerge, agglomerating to form the Fuzhou-Xiamen-Quan Corridor at its core. Fourthly, among the influencing factors, policies and the development environment of informatization have a significant role in promoting the investment and financing connection of digital economy enterprises, and the influence of geographical distance on the investment and financing connection of digital industry is gradually weakened. Finally, combined with the spatiotemporal evolution of the development of the digital industry in Fujian and its influencing factors, the paper puts forward policy suggestions, in order to provide scientific support for the construction of "Digital Fujian" and the sustained and healthy development of the digital economy in Fujian.
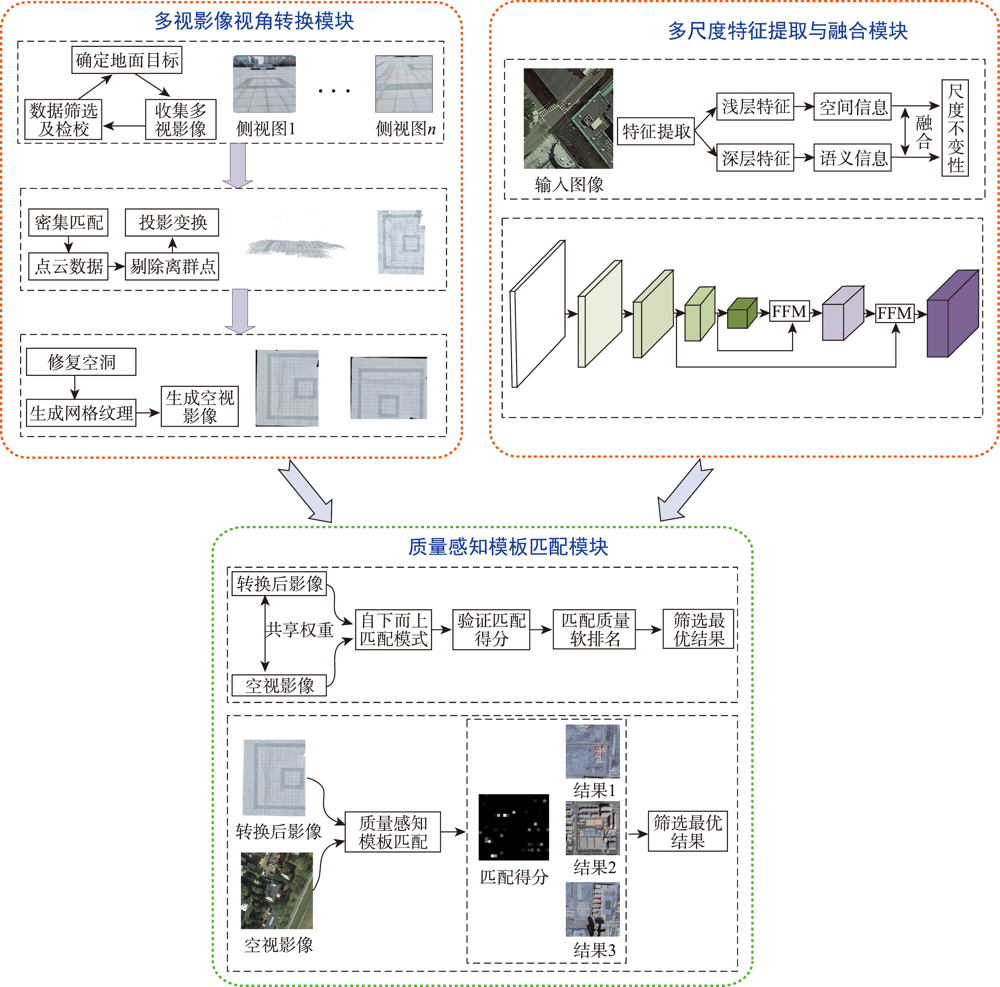
At present, the cross-view matching technology of remote sensing images cannot directly use large-scale satellite images for matching, which is difficult to meet the requirements of large-scale complex scene matching tasks and relies on large-scale datasets, thus lacking a good generalization ability. Aiming at the above problems, this paper proposes a cross-view remote sensing image matching method based on visual transformation using the quality-aware template matching method combined with the multi-scale feature fusion algorithm. In this method, the ground multi-view images are collected by using handheld photographic equipment. The portability and flexibility of the handheld photographic equipment can make it easier for us to collect multi-view images covering the target area. The acquired images are densely matched to generate point cloud data, and principal component analysis is used to fit the best ground plane and perform projection transformation to realize the conversion from the ground side view to the aerial view. Then, a feature fusion module is designed for the VGG19 network. The low, medium and high-level features extracted from remote sensing images are fused to obtain rich spatial and semantic information of remote sensing images. The fusion features of semantic information and spatial information can resist large-scale differences. Finally, the quality-aware template matching method is used. The features extracted from the ground images are matched with the fusion features of the remote sensing images. The matching soft ranking results are obtained, and the non-maximum suppression algorithm is used to select high-quality matching results. The experimental results show that the method proposed in this paper has a high accuracy and strong generalization ability without the need of large-scale datasets. The average matching success rate is 64.6%, and the average center point offset is 5.9 pixels. The matching results are accurate and complete, which provide a new solution for the task of cross-view image matching in large scenes.
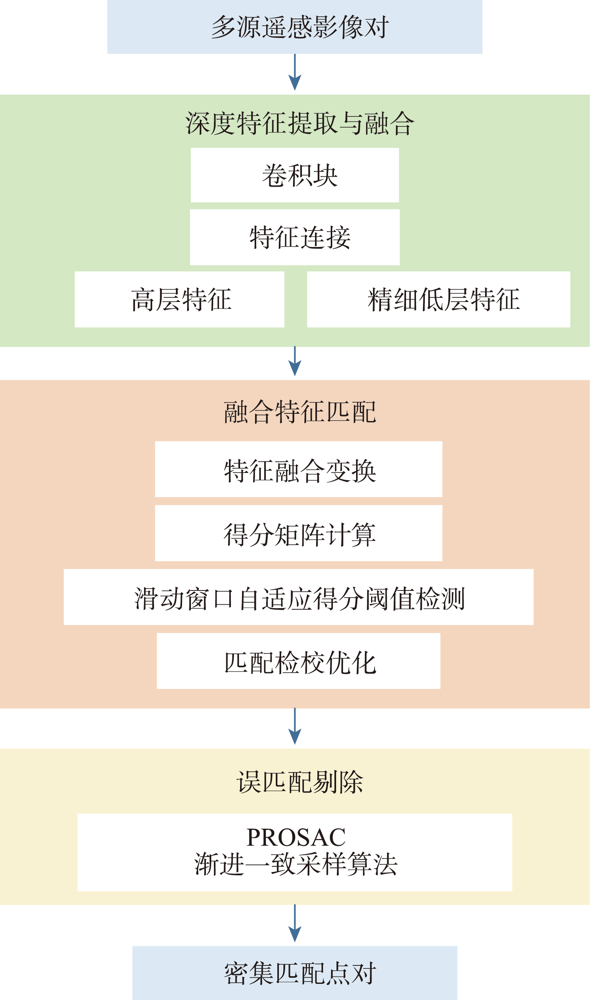
Focusing on the difficulty in image matching caused by different imaging mechanisms and large nonlinear spectral radiation distortion between multi-source remote sensing images, a deep Feature Fusion Matching (FFM) algorithm is proposed in this study. Firstly, the feature pyramid network is constructed to extract image deep features, and the feature connection structure is used to complementarily fuse high-level features with rich semantics and low-level features with accurate positioning, so as to solve the problem of difficult representation of homonymous features in multi-source remote sensing images and improve the positioning accuracy of feature vectors. Secondly, the feature map of the original dimension 1/8 is cross transformed to fuse its own neighborhood information and the feature information of the image to be matched. The first matching result is obtained by calculating the similarity score between the feature vectors. For the sparse feature area, an adaptive score threshold detection algorithm using sliding window is proposed to improve the matching effectiveness for sparse feature regions. Then the matching results are mapped to the sub-pixel feature graph, and the expected value of the matching probability distribution between pixels is calculated in a small window to check and optimize the matching results and improve the accuracy of matching point pairs. Finally, the PROSAC algorithm is used to purify the precise matching results, which can effectively eliminate the false matching and keep the correct matching points to the maximum extent. The experiment selects six pairs of multi-source remote sensing images, and compares FFM with SuperPoint, SIFT, ContextDesc, and LoFTR algorithms. The results show that the FFM algorithm is superior to other algorithms in terms of number of correct matching point pairs, matching point accuracy, matching point root mean square error, and matching point distribution uniformity. The FFM matching results are used for multi-source remote sensing images registration, and the registration efficiency is also greatly improved.
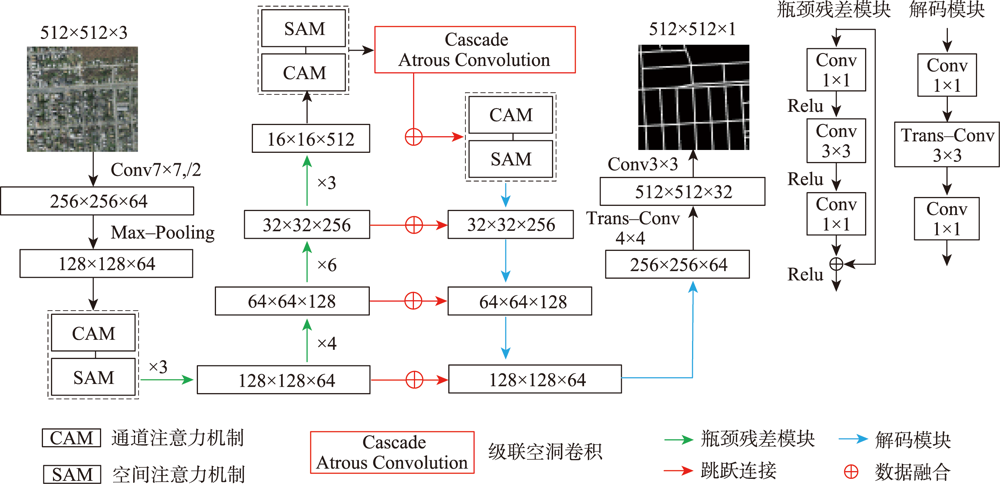
In high-resolution remote sensing images, the spectral information of road is rich, and the spatial geometric structure is clear. However, the road extraction is still faced with challenges such as changes in road size and influences from trees, buildings, and occlusion shadow, which often leads to incomplete extraction results. In addition, the phenomenon of the same object with different spectrum and the foreign body with the same spectrum is more serious, which affects the continuity of road extraction and the integrity of small road information, and it is difficult to distinguish road and non-road impervious layer. Therefore, a road extraction model, DARNet, is proposed in this study to address the above limitations. It uses a deep learning network to obtain fine-grained high-level semantic information and enhance the network's ability to extract fine roads. By embedding the serial channel-space dual attention module, the global semantic information of road feature map is obtained, and the robustness of the network model in shadow and occlusion environment is enhanced. The efficient expression of road features and the deep fusion of multi-scale road information are achieved, the phenomenon of missing details in road extraction is improved, and the efficient and accurate automatic road extraction in complex environment is realized. In this paper, a quantitative comparison is carried out based on three experimental datasets, using DARNet, DLinkNet, and DeepLabV3+ etc. The results show that the F1 of the proposed model is 77.92%, 67.88% and 80.37% for three datasets, respectively, which is higher than that of the comparison models. In addition, the qualitative comparison shows that the proposed model can effectively overcome the problem of inaccurate and incomplete road extraction caused by object shadow, occlusion, and spectral changes of high-resolution images, avoid the phenomenon of missing and miscarrying of small roads, and improve the integrity and continuity of road network extraction.
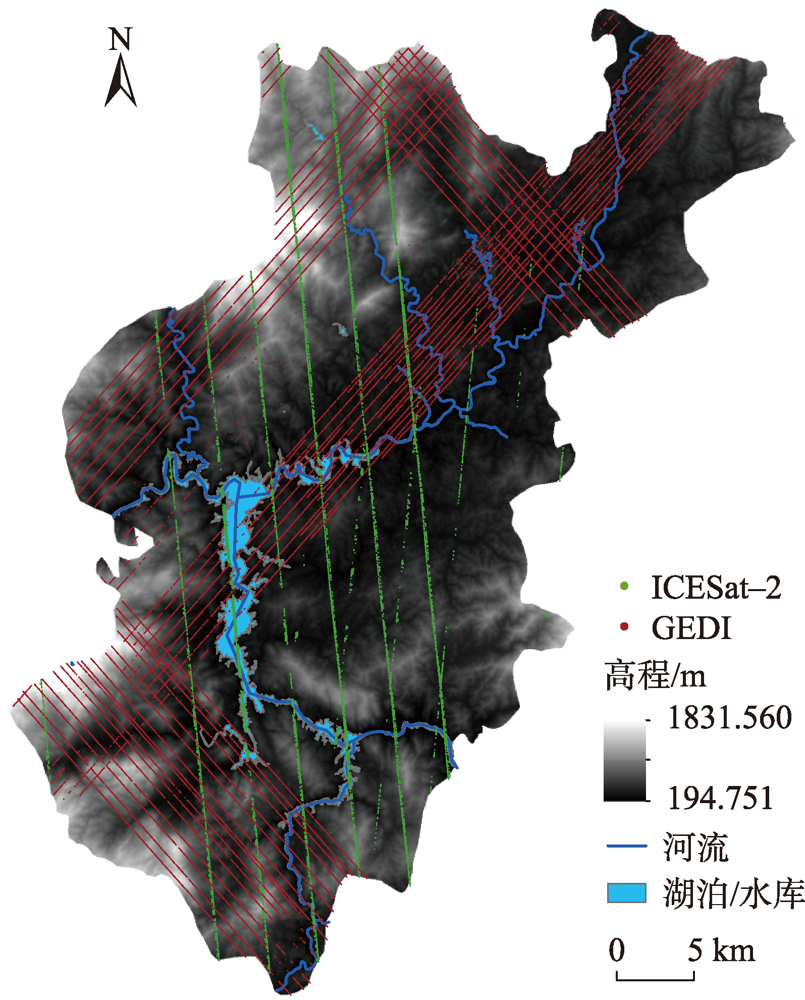
Global Ecosystem Dynamics Investigation (GEDI) and Ice, Cloud, and land Elevation Satellite-2 (ICESat-2) products provide reliable global references for the accuracy evaluation and correction of Global Digital Elevation Model (GDEM). However, existing DEM correction methods mainly address the signal of vegetation in DEM errors and mostly use linear regression models. So, we first analyze the relationship between Advanced Spaceborne Thermal Emission and Reflection Radiometer (ASTER) GDEM v3 data accuracy and the land cover type, elevation, slope, relief amplitude, and vegetation coverage. Based on this, this paper proposes a Digital Elevation Model (DEM) error correction method that takes into account various influencing factors and combines Extreme Gradient Boosting (XGBoost) machine learning and spatial interpolation to model the errors. The analysis of the results shows that the overall error of the original ASTER GDEM has a normal distribution with a large negative offset (average error of -3.463 m). The Mean Absolute Error (MAE) and Root Mean Squared Error (RMSE) of original ASTER GDEM are 12.930 m and 16.695 m, respectively, and the elevation accuracy decreases with the increase of elevation, slope, relief amplitude, and vegetation coverage. After correction, the Mean Error (ME) of ASTER GDEM is reduced to -0.233 m, which means the negative deviation is effectively removed and the overall MAE and overall RMSE are reduced by 26.04% and 23.56%, respectively. The MAE and RMSE of DEM for cultivated lands, forests, grasslands, wetlands, water bodies, and man-made surfaces are all reduced by different degrees. The DEM accuracy evaluation and correction method proposed in this paper models the non-linear relationships between multiple feature elements and terrain errors and achieves better correction results in the study area.
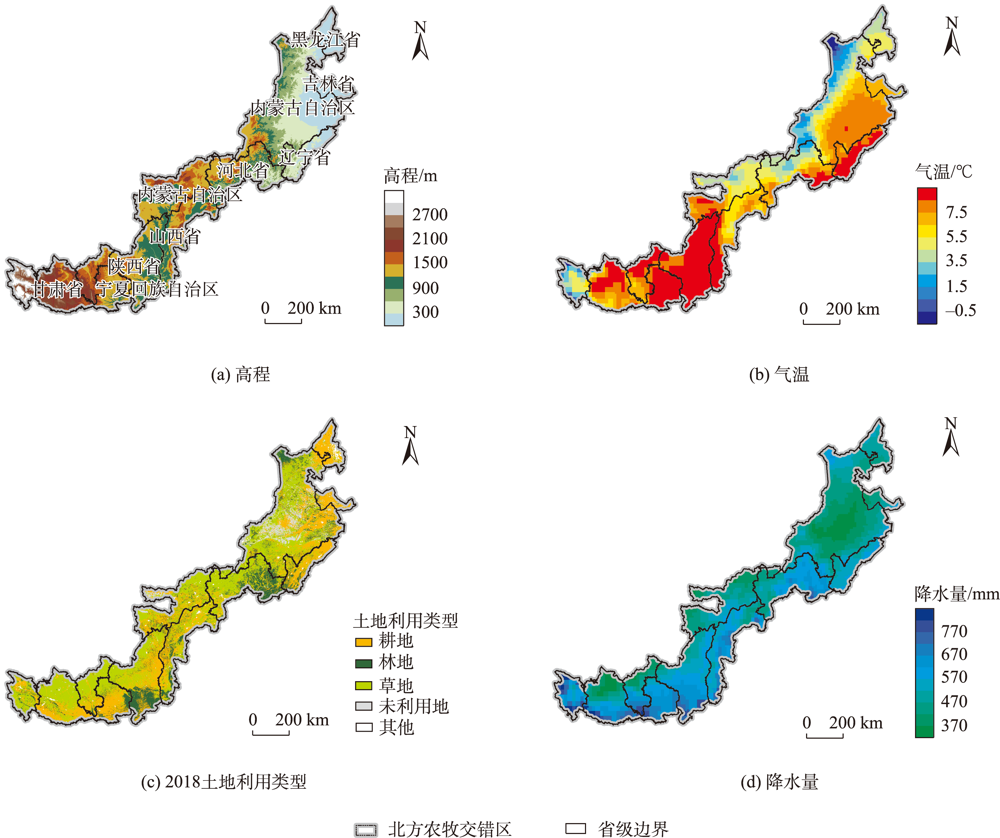
Climate change has been projected to increase the drought duration and intensity in the future, with greater impact on the Gross Primary Production (GPP) in areas. However, despite our increasing understanding of the drought impacts on GPP in recent decades, there is still little understanding of how different drought features (i.e., duration, intensity, peak) GPP. A better understanding of the impact of different drought features on GPP under climate change can help optimize the regional carbon water cycle. In this study, we took the Farming-Pastoral Ecotone of Northern (FPEN) in China as an example and used long-term time series Standardized Precipitation Evapotranspiration Index (SPEI3) during 1900—2020 and GPP during 1982—2018. Firstly, the cross wavelet transform and wavelet coherence analysis was employed to reveal the correlation relationship between SPEI3 and GPP at different temporal scales. Then, the drought features were identified by runs theory, and the trend of drought features and GPP were analyzed using the Theil-Sen Median trend analysis with the Mann-Kandall test in FPEN. Finally, the effects and relative contributions of different drought features on GPP were determined by partial correlation analysis and multiple linear regression analysis. The results show that: (1) There was a strong correlation between SPEI3 and GPP at the scales of half year (6±1 month) and 1 year (12±2 month) in FPEN during 1982—2018, and the 1-year scale had a stronger relationship. Meanwhile the lag effect of SPEI3 and GPP changed with time. Therefore, we clarified that the interannual analysis was able to reduce the effect of lag effect on the correlation between SPEI3 and GPP; (2) The drought duration, intensity, and peak all showed a significantly increasing trend in FPEN during 1900—2020. Drought intensity increased with increasing drought duration and peak. The drought features with higher values often had a stronger increasing trend; (3) GPP showed a trend of “increase-decrease-increase”, with a significant increasing trend during 1982—2018, and the high values of GPP showed a stronger increasing trend; (4) Different drought features have different effects on GPP changes. The absolute contribution rate of drought features was in the order of intensity > duration > peak. Overall, drought features together explained 18.1% of the GPP change. Drought duration and intensity significantly inhibited GPP growth, with the relative contribution rate of -0.05 and -0.35, respectively; (5) GPP of different land covers responded differently to drought features. The drought duration and intensity has negative contribution to the GPP changes in forests/shrubs and grasslands/croplands, respectively.