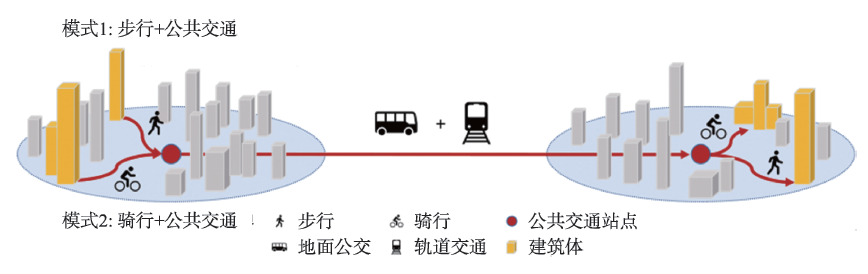
Improving the slow travel environment at public transport stations is a key issue to enhance the competitiveness of green transportation. It is an important measure to improve the service level of public transportation to further coordinate public transportation, especially the end connection between urban rail transit and slow traffic, and to open up the ' last mile '. Existing studies mostly analyze the improvement of travel efficiency at bus stations, and do not fully consider the interaction between urban public transport system and land use. Achieving good accessibility is the main goal of building a livable city, and the spatial analysis of public transport accessibility provides a core indicator to measure the integration of public transport and urban development. As a location-based accessibility evaluation method, the cumulative opportunity method has advantages in understanding the relationship between transportation and land use and is easy to use. To this end, we construct a “door-to-door” fine-scale public transport trip chain based on multi-source traffic big data and develop a two-step calculation method to compute travel time of public transport under two modes of walking and cycling. The two-step calculation of this method has the characteristics of less calculation and flexible data update mechanism, which is suitable for the study of public transport accessibility at large spatial scale. A case study based on Beijing in 2020 shows that the average travel time of public transport via cycling is reduced by 315 seconds and 12.8%. Improvement of travel efficiency at stations improves the public transport accessibility for urban activities such as employment, health care, catering, green space, shopping, and leisure. The improvement range is 90%, 74%, 94%, 33%, 107%, and 77%, respectively, and the improved areas are concentrated in the central urban area and the surrounding residential areas. In addition, the improvement effect of accessibility of public transport shows a spatial feature of a radial-decreasing circular structure. As the main network of public transport, urban rail transit presents an improvement in employment, medical treatment, catering, green space, shopping, and leisure activities by 1.43, 1.43, 1.70, 1.42, 1.70, and 1.71 times, respectively, compared to ground bus. The results show that compared with the ground bus system, cycling substitution will significantly improve the integration of rail transit and city. According to the co-opetition relationship between rail transit and ground bus, rational allocation of bicycle facilities and optimization of shared bicycles will further increase the competitiveness of green transportation.
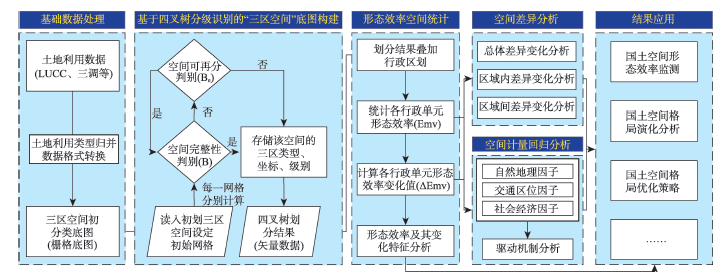
In the context of the reform of China's spatial planning of land, the three functional spaces (i.e., urban, agricultural, and ecological spaces) are the key elements of the connection between macroscopic main functional zones and microscopic land use. In order to analyze the morphological efficiency of three functional spaces in multi-scale, all-elements, and long time series, and analyze the morphological efficiency evolution mechanism of the three functional spaces, this paper constructs a method of morphological efficiency identification based on "quadtree" algorithm, and uses "morphological efficiency value" as the core measure of spatial morphological efficiency to build a unified and comparable morphological efficiency measurement channel of three functional spaces. Based on the morphological efficiency values, this research applies the Dugam Gini coefficient method and spatial regression analysis method to verify the effectiveness of the algorithm based on "quadtree" in describing the spatial morphology of the three functional spaces. And we further use the above methods to explore the differences of morphological efficiency and the influence mechanism of socio-economic factors, to provide a basic support method with strong data adaptability and high accuracy of discrimination for the morphological monitoring of land space at macro, meso, and micro scales. Taking the Yangtze River Economic Belt as the research object, this paper analyzes the characteristics, differences in changes and evolutionary mechanisms of the spatial efficiency of the three functional spaces in the past 40 years. Our results show that: (1) In the past 40 years, the level of spatial integrity of urban space expansion has increased rapidly, with morphological efficiency values rising by 0.46, while the level of agricultural space spatial concentration and contiguity has fallen sharply by 0.17, and the ecological space has remained almost unchanged; (2) The risks of the development and protection of the three functional spaces in the Yangtze River Economic Belt include: the risk of disorderly development of urban space in the central and western regions where are less developed, the risk of fragmentation of agricultural space in the whole region, and the risk of massive damage to the integrity of the ecological space in the eastern region; (3) The key to optimize the morphological efficiency of the three functional spaces in the Yangtze River Economic Belt is to pay attention to the morphological efficiency changes of the three functional spaces in regions with fragile resource and environmental carrying capacity, regions with high socio-economic development, and regions with relatively poor location conditions, and formulate policies for the optimization of spatial structure and morphology.
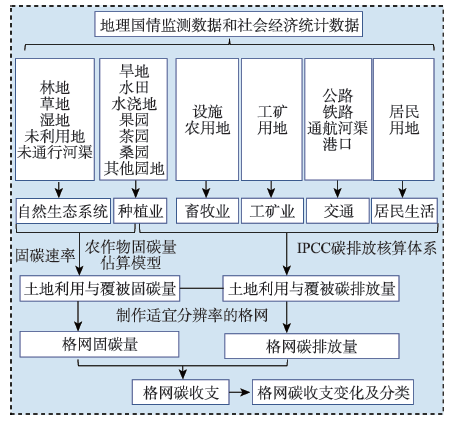
Accurate carbon budget accounting is the premise of achieving China's “dual carbon” goals. Calculating the carbon budgets of statistical units provides reliable data support for the optimization and adjustment of territorial space. Based on geographical conditions monitoring data, combined with socio-economic data, population data, and energy data, this paper proposes an accurate carbon budget accounting and change classification method using selectable resolution grids as the statistical units. In this method, the carbon sequestration and carbon emissions of various types of land use and land cover are calculated and spatialized. Then, the carbon budgets in the statistical units with the selected resolution are calculated according to the spatialization results of carbon emissions and carbon sequestration. Finally, the statistical units are divided into nine classifications according to the carbon budgets and their changes in the study period. The classification includes increasing sink area, stable sink area, worse sink area, better balance area, stable area, worse balance area, better source area, stable source area, and worse source area. Taking the data of Jiangsu province in 2015 and 2019 as an example, the carbon budgets of various types of land use and land cover were calculated and analyzed using 1-kilometer grid as the statistical unit. The results show that the carbon budgets of Jiangsu province in 2019 was 344.21×10⁶ tons, an increase of 4.24×10⁶ tons relative to 2015. Dry land was the main area of carbon sequestration. Industrial and mining lands contributed the largest carbon emissions. The carbon sink areas in northern and central Jiangsu were larger than those in southern Jiangsu. The areas that were carbon sources were clustered in the economically developed central urban areas. The grids covering Jiangsu province were classified into five categories. Recommendations for low-carbon development were put forward for each typical classification. Compared with traditional methods, the feasibility and superiority of this method in carbon budget accounting and carbon budget change classification are proved. This method can identify hot spots with high carbon sequestration and carbon emissions, and analyze the differentiation characteristics of carbon budgets changes. The results can provide technical support for achieving carbon equity and coordinated emission reductions.
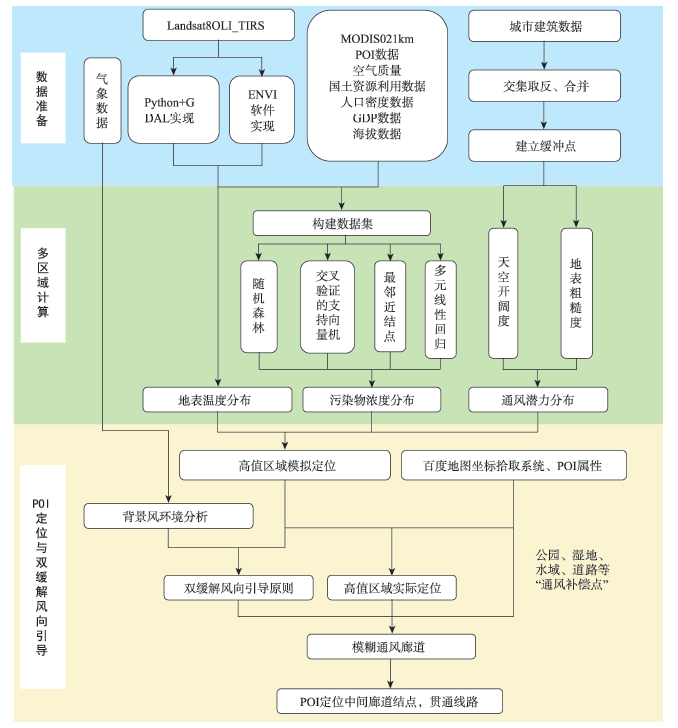
With the development of urban industrialization, the heat island effect and haze phenomenon have also increased sharply. However, due to the staggered regional distribution of urban temperature and pollutants, the traditional methods of fuzzy selection of ventilation corridors based on blocks are difficult to comprehensively consider temperature guidance and pollutant guidance, resulting in neglectable error in selection of construction locations of ventilation corridors. Therefore, this paper proposes the MDP-DMW model to improve the location selection of ventilation corridors and expounds key contents of the model. First, we take Baidu map as the data source and obtain POI data of the research area through crawler technology. Second, three kinds of distributions are calculated respectively. The distribution of urban surface temperature is calculated by processing remote sensing data using Python and GDAL. Based on GIS technology, the ground PM2.5 monitoring values, POI data, and six related factors of PM2.5 concentration are spatially superimposed to obtain the sample data set. The pollutant data of sample points are calculated by random forest model, and finally the urban pollutant concentration distribution is calculated by ordinary kriging interpolation method. Taking the density and height of buildings as data input, the distribution of ventilation potential is estimated by calculating the urban sky width and surface roughness. Third, based on these three distribution results, the locations of high temperature, high pollutant concentration, and high ventilation potential are simulated respectively. Based on the geographical attributes of POI in the simulated locations, the location addressing is carried out in combination with Baidu map, and the actual geographical location of high-value nodes of each distribution result is determined. Fourth, we analyze the wind environment in the study area, connect the high-value node areas of ventilation potential distribution to build multiple fuzzy corridors according to the guiding principle of double mitigation wind direction, locate near each fuzzy corridor line in combination with POI attribute, select the appropriate "ventilation compensation point" as the middle node of the ventilation corridor, and connect the middle node of the ventilation corridor on each fuzzy corridor, resulting in the potential ventilation corridors of the city. Taking Xi'an as the study area, this paper identifies seven potential urban ventilation corridors using MDP-DMW model and gives reasonable planning and control suggestions for decision making.
Remote sensing satellite data are essential source of earth surface information. However, traditional remote sensing classification methods usually have limitations and include cumbersome processes, and the accuracy of interpretation depends on the expert experience. Deep learning methods can adaptively extract more detailed feature information from field objects and are suitable for land cover classification of high-resolution remote sensing images. Based on the DeepLabV3+ model, this paper makes the following improvements: (1) Improvement of the backbone network. We use ResNeSt instead of ResNet as the backbone network; (2) The improvement of the hole space pyramid pooling module. First, a hole convolution with a relatively small hole rate is added to the previous layer of the parallel branch, and then a series of hole convolution layers with a gradually decreasing hole rate are added to the back layer of the branch. We use the land cover sample database and the self-made sample database respectively for model training and classify water bodies, transportation, buildings, cultivated land, grasslands, forests, bare soil, etc. from high-resolution images. Our results show that the accuracy and time efficiency of the improved model using the two databases are significantly higher than those of the original DeepLabV3+ model. The overall accuracy using the land cover sample database and self-made sample database reach 88.08% and 85.22%, respectively, which are 1.35% and 3.4% higher than that using the original DeepLabV3+ model, respectively. Also the time cost decreases by 0.39h per epoch. The improved model can provide faster and more accurate land cover classification results for high-resolution imageries that increases in terabytes of data per day.
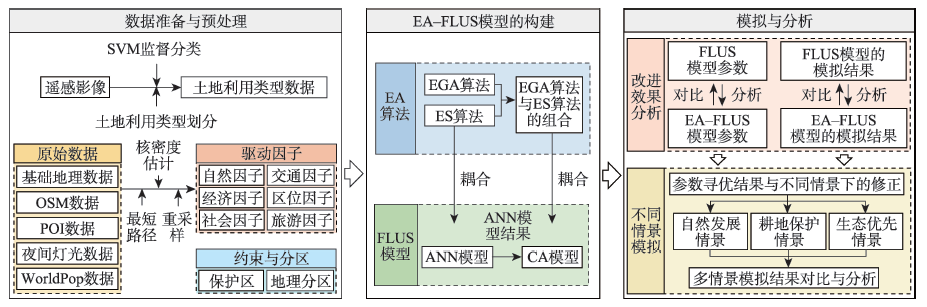
It is of great significance to study how to set parameters of land use change simulation models more scientifically and objectively, in order to avoid the problem of poor simulation caused by improper parameters setting in a complex model. In this paper, the EA-FLUS model with parameter optimization function was constructed by coupling Evolutionary Algorithm (EA) and FLUS model. This model first optimized the parameters of the artificial neural network model in the FLUS model through evolutionary strategy to improve the prediction accuracy of the probability distribution of each land use type. On this basis, combined with geospatial partition, the parameters of the cellular automaton model in the FLUS model were adjusted by using the combination of elitist genetic algorithm and evolutionary strategy to improve the simulation accuracy. In the empirical study phase, taking Guilin as the study area, this paper analyzed the improvement of EA-FLUS model by partition simulation of land use change. In addition, the natural development scenario, cultivated land protection scenario, and ecological priority scenario were set up to simulate the land use change in Guilin from 2020 to 2030. The results show that: (1) Compared with the parameters setting based on experience and historical characteristics of land use change, the parameters optimization result using evolutionary algorithms was closer to the policy orientation in the study area, and better reflected the diversified development trends of various land use types in different geospatial partition; (2) Compared with the FLUS model, the EA-FLUS model had more advantages in land use change simulation with geospatial partition. The overall accuracy, Kappa coefficient, and FoM coefficient of the simulation result were increased by 0.56%, 0.011, and 0.009, respectively; (3) The construction land and cultivated land in Guilin showed a strong expansion trend, but the forested land showed a shrinking trend. Further strengthening the protection of ecological space would help to slow down the expansion of construction land and cultivated land. The research results not only enrich the existing land use change simulation techniques and methods, but also provide a certain theoretical basis and scientific basis for urban planning and sustainability research.
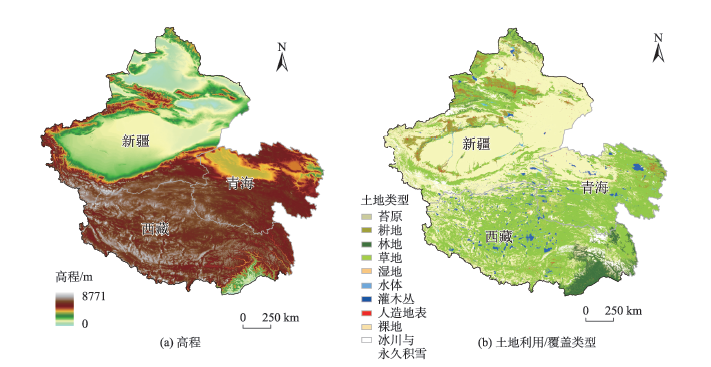
As a clean energy technology, photovoltaic power generation has developed rapidly in the past decades. Efficiently obtaining the spatial distribution of photovoltaic power stations is important for the future construction of photovoltaic plants. This study took Xinjiang, Qinghai and Tibet in western China as research areas. Firstly, to evaluate the application value of object characteristics in deep learning, the texture structures of photovoltaic power stations were mined based on Sentinel-2A imagery. Then we employed a ResNet50-UNet segmentation model based on the ResNet50 backbone network to automatically detect photovoltaic power stations. Secondly, based on ArcGIS and eCognition Multi-scale software, we post processed the extraction results to remove empty spots and optimize boundaries, and precisely restored the real shape of ground photovoltaic power stations. Results show that the photovoltaic power station extraction method obtains high verification accuracy, the Kappa and mIoU was 93.71%, and 94.05%, respectively. Lastly, this paper analyzed the spatial deployment status of photovoltaic power stations in Xinjiang, Qinghai and Tibet, and discussed the carbon source effects between solar energy and traditional fossil energy. Accurate estimation of photovoltaic power generation is a significant precondition for next carbon reduction benefit evaluation. From the photovoltaic power stations with complex internal structures, this paper extracted the photovoltaic square arrays, one of the important parameters in the estimation formula of power generation. The average annual power generation of existing photovoltaic power stations in Xinjiang, Qinghai and Tibet was about (335.13~442.26) billion kW·h, equivalent to burning (411.87~543.54) million tons of coal. From the perspective of carbon emissions, the carbon reduction benefit is about (2499.40~3298.38) million tons. Thus, photovoltaic power stations play an important role in achieving carbon peak and neutrality goals.
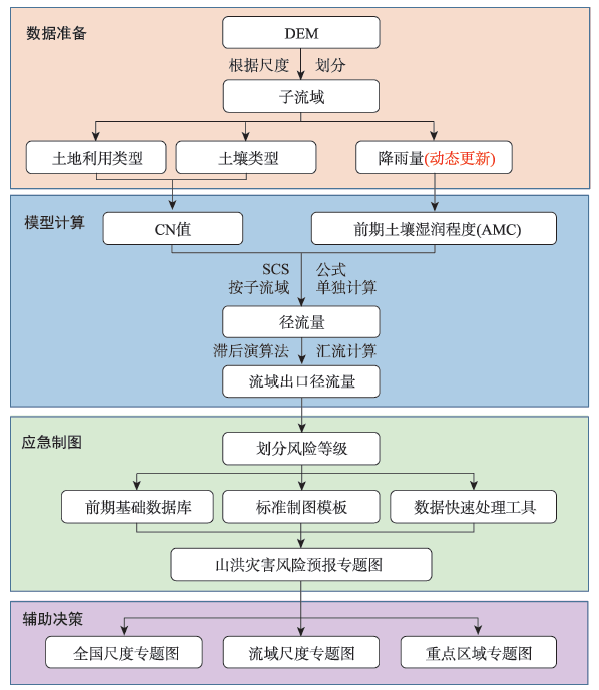
The prevention and mitigation of flash flood disasters is a weak link in flood prevention and disaster mitigation at present in China. Early warning is one of the most effective way of defense against flash flood disasters. Emergency mapping can provide strong technical support for early warning information release and decision-making deployment in flash flood disasters. For flash flood disasters with high suddenness and drastic changes in spatial and temporal process, traditional emergency mapping methods are difficult to meet the actual needs in timeliness. Using the SCS model in this research which has few parameters and simple structure can quickly analyze and calculate the possibility of flash flood disasters. It is combined with the framework of "Model calculation- Emergency mapping- Decision-making support" to improve the timeliness of flash flood disaster risk emergency mapping. In the main flood season of 2020, the Yangtze River Basin experienced the most severe flood since 1998. It is urgently needed to carry out the emergency mapping research of flash flood disaster risk. The Yangtze River Economic Belt is taken as the research area to carry out the research. The research results include the following three aspects: (1) the improved SCS model is used to calculate the flash flood disaster risk for each discretized subunit based on meteorological data. Through the construction of early-stage basic database and rapid data processing tools, and the design of standard mapping templates, the efficiency of model calculation and emergency mapping is improved and the standardization of emergency mapping can be guaranteed. The mapping time of a single emergency thematic map is improved to about 50 minutes. (2) The combination of real-time model calculation and emergency mapping, and the use of 24h daily rainfall forecast data realizes dynamic and continuous updating of thematic maps. (3) The study is effectively applied to the flash flood disaster prevention of the Yangtze River Economic Belt during the 2020 flood season. A total of 150 thematic maps of flash flood disaster risk are produced to support the decision-making deployment in national emergency management and it achieves good results. This study also provides new ideas and possibilities for emergency services for various sudden natural disasters in the new era.
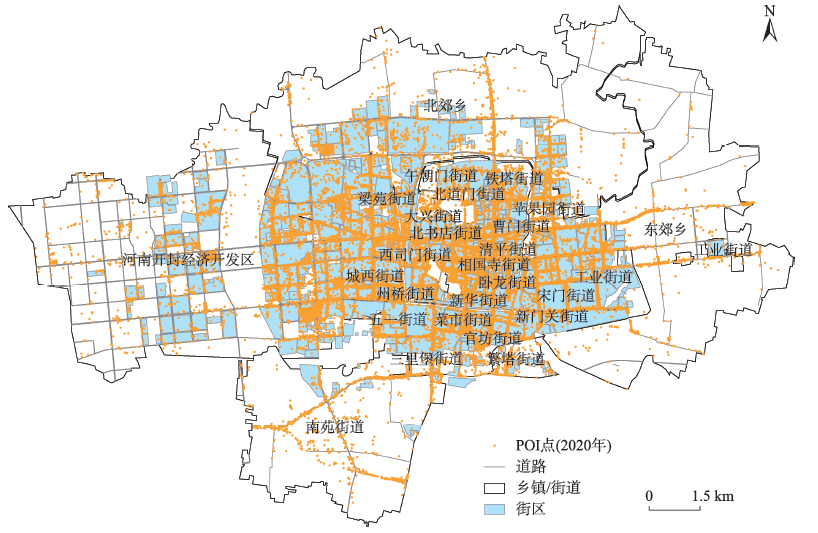
The social sensing data such as POI provides new insights into fine-scale urban spatial structure study. However, the relationship between POI data and traditional remote sensing data needs to be further explored. Moreover, due to limited long-term POI data, the study on spatial expansion and succession characteristics of urban functions is still relatively rare. Therefore, this article took the main urban area of Kaifeng City as an example and used POI data between 2005 and 2020 to analyze the succession characteristics of urban functions and composite function changes. An analytical framework on spatial agglomeration and diffusion of urban functions was constructed to investigate the spatial process of human activity at block scale. Spatial statistical indicators and location entropy indices were used to analyze the characteristics of urban function succession and compound function change. The results show that: (1) Urban socioeconomic activities in Kaifeng showed a gradual expansion trend, and the area of activity space expanded by 11.26 km2 from 2005 to 2020. The average annual expansion rate increased from 3.5% during 2005 to 2015 to 5.1% during 2015 to 2020. POI data are more sensitive than remote sensing data on succession characteristics of activity spaces. (2) The process of agglomeration and diffusion of various urban activities results in the succession and change of different functions. Especially, Kaifeng has a relatively high degree of agglomeration for commercial service functions. Among them, the degree of agglomeration of commercial service functions in Kaifeng is relatively high. Although affected by the diffusion of commercial centers in new urban areas, the single-center urban development mode still does not change. The public administration and public service functions also show a central peripheral structure clustered in the old town, and the functional supply of the new urban areas needs to be improved. The residential function gradually changes from a relatively balanced functional configuration to agglomeration distribution, and the separation of employment and housing become more and more obvious. The overall industrial function gradually shifts from dispersion to agglomeration, spreading and moving from the central urban areas to the peripheral areas as a result of the policy on eliminating secondary and advancing tertiary industries, and then rapidly agglomerating together; (3) The number of urban blocks with commercial services and business offices is increasing, but the specialization advantages of business office functions are more prominent. And the number of urban blocks with complex functions is also increasing, which provides useful support for the single-center urban structure. The above results demonstrate that urban blocks with strong complex functions are mainly distributed in areas with high vitality and more convenient living residents. This research can not only provide theoretical and technical support for the study of urban spatial planning, but also provide new ideas for urban renewal, sustainable development and territorial space planning.
Identifying the local influencing factors and main pollution sources of Cadmium (Cd) in soil is of great significance for controlling soil Cd pollution, ensuring food security, and protecting urban residents' health. Based on the Geographically Weighted Regression (GWR), Multi-scale Geographically Weighted Regression (MGWR) takes into account the differential optimal bandwidth of different explanatory variables. It is considered to be an effective method to identify the local dominant factors of target variables but has not been applied to the study of soil heavy metal pollution. Therefore, using 110 sampling points collected from Huangpi District of Wuhan City, we examined the effectiveness of Multi-scale Geographically Weighted Regression (MGWR) by comparing the model performance of multiple linear regression, i.e., GWR and MGWR. Then the MGWR model was used to explore the spatial heterogeneous relationship between Cd and explanatory variables, and thus determine the influencing factors and main pollution sources of Cd at each point. Finally, four levels of Cd pollution risk areas were defined according to the pollution status and sources, and corresponding Cd pollution control measures were proposed. The results of model evaluation showed that the MGWR outperformed other models with highest R2 (0.733) and Log-likelihood, and lowest AIC and Moran’s I value of regression residuals. The results of MGWR exhibited that the optimal bandwidth of different variables varied greatly. The results also revealed that on the whole, pH, clay content, and topographic wetness index were the main factors affecting the spatial distribution of Cd, while urbanization and soil parent materials were the main sources of Cd. The local main influencing factors and sources of Cd at different locations were quite different: the main influencing factors of Cd at most locations were natural factors, and a few locations were dominated by human activities and natural factors. In total, 55.5% of the samples in the study area were contaminated with Cd. According to the pollution sources and conditions, four level risk areas of high, medium-to-high, medium, and low were defined, and suggestions for Cd pollution control in each area were also given. This study confirms the effectiveness of the MGWR model and the necessity of considering the differential bandwidth of explanatory variables. The findings provide a reference for the exploration of local influencing factors of heavy metal pollution, the determination of pollution sources, and the formulation of pollution control measures in other areas.

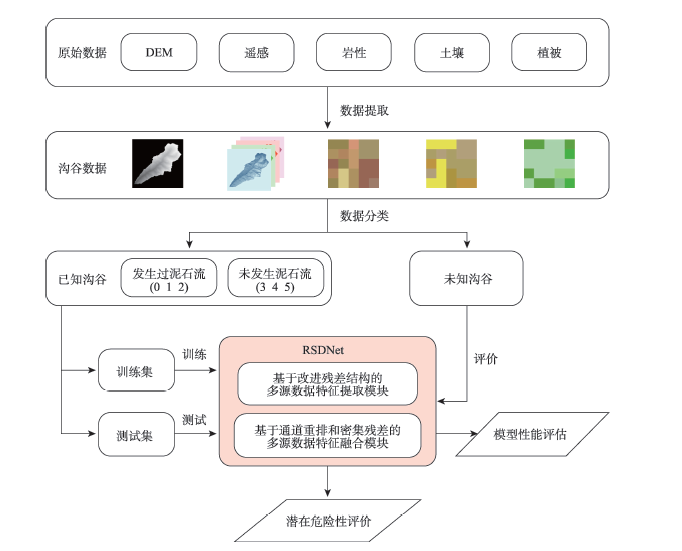
Gully debris flows frequently occur in mountainous regions. Hazard investigation in large area is always hampered by the rugged mountains. In this paper, a convolutional neural network named Residual-Shuffle-Dense residual Net (RSDNet) based on remote sensing, DEM, soil, lithology, and vegetation data was proposed to conduct large-scale territorial surveys. First, shallow features were extracted by modified residual structure using maximize pooling. Then, feature fusion was conducted to strengthen the correlation between the underlying features of various data. Next, dense residual structure was applied to make further feature extraction from underlying features and identify the impact of interaction between various features on potential debris flow hazard. Finally, the potential hazard level of a valley was given. During the training process, a joint loss function based on cross entropy loss and modified focal loss was used to make the model better distinguish the morphological and disaster-causing characteristics of various valleys. In this study, the valley classification achieved a precision rate of 0.92 by using RSDNet. In the potential hazard assessment of all valleys in Nujiang Prefecture, 122 out of 132 historical debris flow valleys were judged to be dangerous or very dangerous. Results indicate that the proposed model performs well, and this work would offer new ideas for potential debris flows hazard assessment.
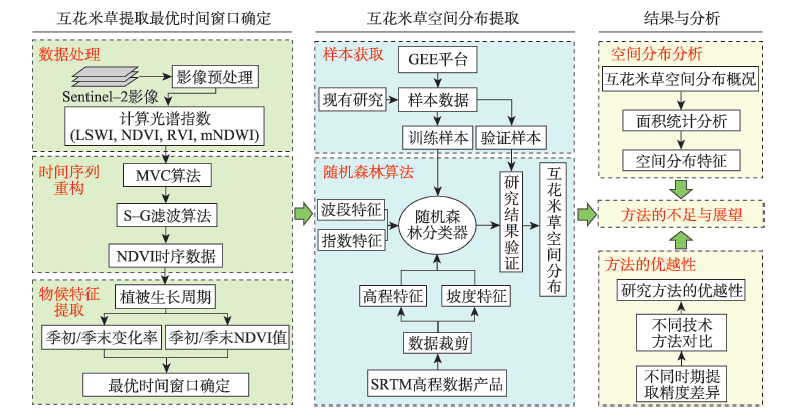
Ecological catastrophes occurred in China's coastal region as a result of rapid invasion of Spartina alterniflora. It's critical to monitor the spatiotemporal dynamics of Spartina alterniflora. Remote sensing has a superior ability to monitor the dynamics of intertidal wetland vegetation on a broad scale as compared to traditional surveying techniques. However, it is of great challenges to precisely determine the amount of Spartina alterniflora using a single-phase image due to the spectral similarities of vegetation with various species. The extensive remote sensing data still need to be further explored in order to better understand the temporal and geographical characteristics of vegetation. The phonological cycle of the plant can be tracked using the time series remote sensing data, which can then provide additional temporal features for vegetation classification. However, the impacts of cloudy weather and tides in intertidal zones make it challenging to extract the phenological parameters, even though previous phenology-based algorithms can reduce misclassification caused by spectral similarity. In this study, we suggested a method to reduce the impact of cloudy weather and tides on time series remote sensing data by integrating the Maximum-value composite algorithm with Savitzky-Golay (S-G) filter. Then, based on the NDVI time series derived from archived Sentinel-2 data, the two-term Fourier function is used to determine the optimal time window and phenological parameters for the classification of Spartina alterniflora. The landscape of Fujian's coastal zone and the distribution of Spartina alterniflora were finally mapped using a random forest classifier on the Google Earth Engine (GEE) platform. The results revealed that, with an overall accuracy of 89.81% and a Kappa coefficient of 0.88, respectively, the beginning of the growing season (June to July) is the optimum time window for classifying intertidal vegetation. It demonstrates how effectively this technology may be used to monitor Spartina alterniflora on a broad scale in coastal areas. According to the results, Spartina alterniflora had a total area of roughly 100.78 km2 in Fujian's coastal zone in 2020, with the most of it being concentrated in Ningde, Fuzhou, Quanzhou, and Zhangzhou. The largest patches of Spartina alterniflora, with a distribution of 37.79%, were found in Ningde. Due to the coastal geomorphology, Spartina alterniflora displayed a large diversity in its spatial distribution along the Fujian coast. The demonstration in Fujian Province shows that the suggested method can offer significant potential for long-term and extensive spatial scale monitoring of Spartina alterniflora dynamics, which could assist coastal high-quality and sustainable development.
Convolutional Neural Network (CNN) has achieved promising results in change detection using remote sensing images. However, CNN performs poorly on global semantic information extraction due to its limited receptive field. To this end, we propose an end-to-end encoding-decoding local-global feature enhancement network, termed as LGE-Net, which introduces locally enhanced Transformers (LE-Transformer) for capturing global semantic feature representation. Specifically, the LGE-Net uses the CNN backbone network to obtain local semantic features of dual-phase remote sensing images and cascades the extracted local features into the LE-Transformer layer to extract deep global semantic features. Then, in the decoder, the features are cascaded, up-sampled, and finally connected with multi-scale local features by semantic enhancement modules (CEMs). In addition, a local feature-enhanced feed-forward network (LEFFN) is designed to enhance local information interaction in the LE-Transformer blocks and their adjacent blocks. Extensive experiments on the two publicly available datasets (i.e., LEVIR-CD and CDD) show that the proposed LGE-Net can accurately and efficiently identify changed regions, reduce false and missed detections, and thus has a better generalization ability, compared to other state-of-the-art change detection methods.

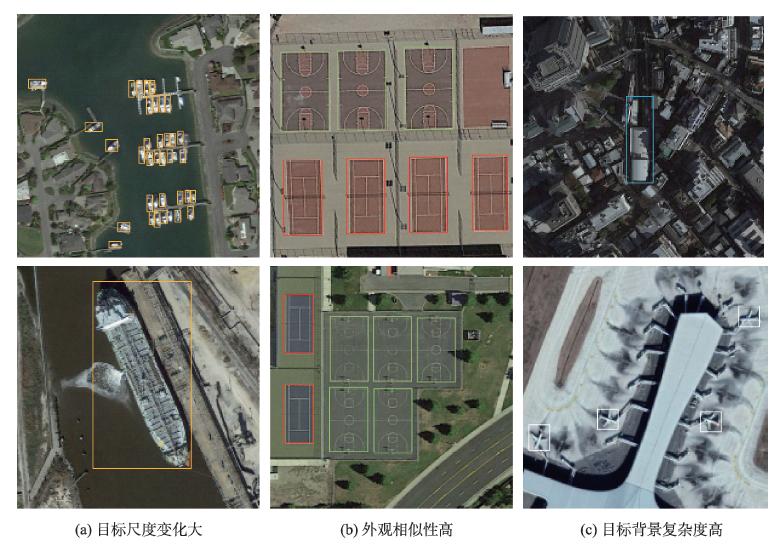
Object detection in remote sensing images is of great significance to urban planning, natural resource survey, land surveying, and other fields. The rapid development of deep learning has greatly improved the accuracy of object detection. However, object detection in remote sensing images faced many challenges such as multi-scale, appearance ambiguity, and complicated background. The remote sensing image datasets have a large range of object size variations, e.g., object resolutions range from a dozen to hundreds of pixels. high background complexity, remote sensing images are obtained with full time geographic information; high similarity in the appearance of different classes of targets; and diversity within classes. To address these problems, a deep convolutional network architecture that fuses the Multi-Neuron Sparse feature extraction block (MNB) and Hierarchical Deep Feature Fusion Block (HDFB) is proposed in this paper. The MNB uses multiple convolutional branching structures to simulate multiple synaptic structures of neurons to extract sparsely distributed features, and improves the quality of captured multi-scale target features by acquiring sparse features in a larger receptive field range as the network layers are stacked. The HDFB extracts contextual features of different depths based on null convolution, and then extracts features through a unique multi-receptive field depth feature fusion network, thus realizing the fusion of local features with global features at the feature map level. Experiments are conducted on the large-scale public datasets (DIOR). The results show that: (1) the overall accuracy of the method reaches 72.5%, and the average detection time of a single remote sensing image is 3.8 milliseconds; Our method has better detection accuracy for multi-scale objects with high appearance similarity and complex background than other SOTA methods; (2) The object detection accuracy of multi-scale and appearance ambiguity targets is improved by using MNB. Compared with object detection results with Step-wise branches, the overall accuracy is improved by 5.8%, and the sum operation on the outputs of each branch help achieve better feature fusion; (3) The HDFB extracts the hierarchical features by the hierarchical depth feature fusion module, which provides a new idea to realize the fusion of local features and global features at the feature map level and improves the fusion capability of the network context information; (4) The reconstructed PANet feature fusion network fuses sparse features at different scales with multivariate sparse feature extraction module, which effectively improves the effectiveness of PANet structure in remote sensing image target detection tasks. Many factors influence the final performance of the algorithm. On the one hand, high quality data sets are the basis of higher accuracy, e.g., image quality, target occlusion, and large intra-class variability of targets profoundly affect the training effect of the detector; on the other hand, model parameters settings, such as clustering analysis of the dataset to obtain bounding boxes information to improve the best recall, and the perceptual field range of the class depth feature fusion module, are key to ensuring accuracy. We conclude that using a Multi-Neuron Sparse feature extraction Network can improve feature quality, while a Hierarchical Deep Feature Fusion Block can fuse contextual information and reduce the impact of complex background noise, resulting in better performance in object detection tasks in remote sensing images.
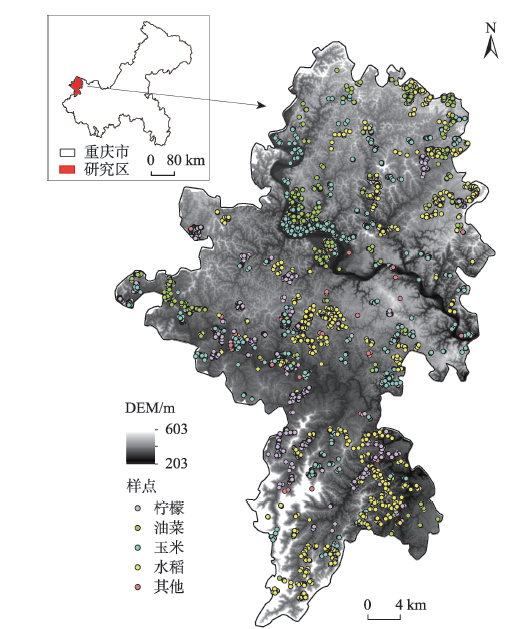
The distribution of crop planting structure can directly reflect the form and location of farmland, which is of great significance for the development of precision agriculture and inventory of agricultural resources. In the southwestern mountainous area in China, the farmland parcel is small and fragmented, with complex planting types, and thus the image visual characteristics are fuzzy and diverse. Due to the complexity of climate and terrain surface, it is difficult to identify crop types in this area. The arrival of the era of high-resolution remote sensing has promoted the rapid development of object-oriented crop extraction methods. Classification based on object segmentation combing spectral, contextual, and other features can effectively overcome the shortcomings of pixel-based classification methods and better serve the field farming management and land ownership management. Therefore, this study uses high-resolution remote sensing images to extract farmland parcels. Taking parcels as the spatial constraints, six time-series vegetation indices including NDVI, EVI, RVI, DVI, GNDVI, and SAVI, are constructed at the scale of parcels based on multi-temporal medium-resolution Sentinel-2 and Landsat8 OLI remote sensing images. Their phenological characteristics are also extracted using these remote sensing images. The multi-dimensional data are constructed through the importance evaluation of classification features, and the random forest classification model is used to identify crop types (i.e., lemon, rape, rice, corn, and other crops) combined with field sampling data. By comparing the classification accuracy using vegetation indices or phenological characteristics alone and that combining vegetation indices and phenological characteristics together, we found that the classification accuracy combining vegetation indices and phenological characteristics is the highest. The overall accuracy is 94.52%, and the Kappa coefficient is 0.90. The accuracy of lemon, rape, corn, rice, and others is 89.88%, 87.30%, 84.98%, 95.57%, and 98.05%, respectively. There are 90 348 lemon parcels, 30 173 rape parcels, 271 606 corn parcels, 146 113 rice parcels, and 16 406 other parcels, accounting for 10.96%, 36.40%, 32.94%, 17.72%, and 1.99% of the total farmland in Tongnan area, respectively. The planting area accounted for 14.82%, 18.44%, 35.37%, 29.92% and 1.45%, respectively. Our results indicate that the vegetation indices and phenological characteristics extracted from time-series remote sensing data can be used for crop identification at the parcel scale, which provides reference for obtaining large-scale crop mapping in the region with complex planting structures.
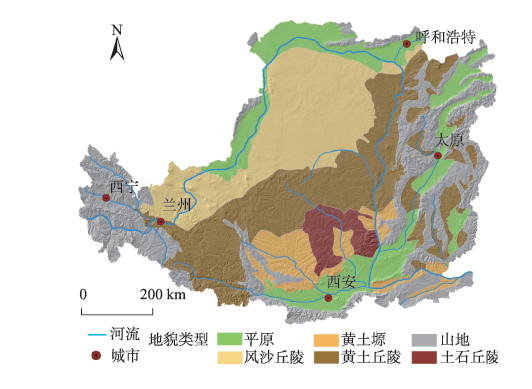
Correcting the error of SRTM1 DEM can effectively improve its application accuracy. Taking the Loess Plateau with typical landform characteristics as the research area and using the ICESat-2/ATL08 land laser elevation point as the reference data, the mainstream machine learning algorithms are introduced to establish the relationship between SRTM1 DEM error and its influencing factors to correct the elevation value. By analyzing the model performance indicators, error frequency distribution curve, spatial pattern of correction error, and the comparison of original and corrected distributions of error in typical profile, we can obtain the applicability of elevation error correction models for different landform types. Results show that the elevation correction effect using the random forest regression model is the best in the plain landform, wind-sand landform, and loess tableland landform, and the average absolute errors are reduced by 0.49 m, 0.82 m and 1.2 m, respectively. The errors in typical profile of the low relief plain and wind-sand landforms are more consistent with the original errors. The support vector machine model in mountainous areas is more applicable, and the root mean square error and mean absolute error is reduced by 6.79 m and 5.43 m, respectively. The frequency of small absolute errors is increased in the spatial pattern and typical profile. The resilient backpropagation model is the best in the loess hilly landform area, and the root mean square error and mean absolute error are reduced by 2.3 m and 2.04 m, respectively. The error reduction effect is significant at the spatial scale, and there are few outliers of error in typical profile. The convolutional neural network model in the soil-rocky hilly landform area is more ideal compared to other models, and the root mean square error and the mean absolute error are reduced by 4.14 m and 3.5 m, respectively. The error reduction effect of terrain profile is significant. The study provides a reference for the selection of the SRTM1 DEM elevation correction model for different landform types in this region.