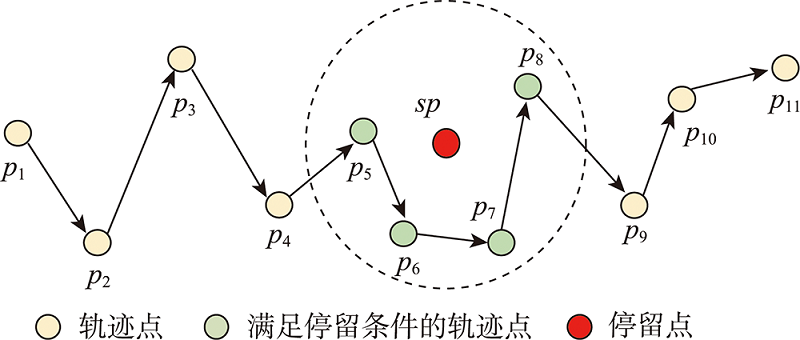
The analysis and processing of trajectory data can reveal the motion law of moving objects and dig out the hidden information related to it. Irregular or abnormal movements of moving objects generate anomalous trajectory data, and the appearance of anomalous data often means that there is a special situation, which implies more meaningful information. Rapid and accurate detection of abnormal trajectories can serve applications such as traffic analysis and accident detection. In most application scenarios, the trajectory anomaly detection method needs to pay attention to the anomaly of the trajectory segments, while the existing methods do not fully consider the local anomaly of the trajectory, and the detection results have certain shortcomings. This paper proposes a subtrajectory anomaly detection method based on stay area recognition, which aims at the problem that traditional trajectory anomaly detection methods do not fully consider the local anomaly of the trajectory. This method first designs a density-based stay point detection algorithm to detect the stay points in the trajectory set, that is to say, establishes the initial cluster by finding the core point, expands the current cluster with the points in the neighborhood of the core point, and detects the stay points by determining whether the time interval in the cluster satisfies the time conditions or not. Second, it identifies the stay areas according to the set of stay points and segments each trajectory after taking any two stay areas as a pair of start and end areas. Third, the subtrajectory set is grouped according to the start and end regions of the subtrajectories after segmentation. Finally, for the subtrajectories in each group, a subtrajectory anomaly detection algorithm is designed to detect anomalous spatial subtrajectories and anomalous spatiotemporal subtrajectories. Compared with traditional anomaly detection methods on real trajectory datasets, the experimental results show that the proposed method can effectively detect abnormal sub-trajectories, and the running time is significantly shorter than that of the TRAOD method, and the detection accuracy is up to 23.9% higher than that of the TRAOD method. Compared with the ATDC and iBAT methods, the F1 score is significantly improved, with the highest improvement rates of 7.8% and 16.1%, respectively. The above experimental results verify the effectiveness and practicability of the proposed method. The trajectory anomaly detection method described in this study can provide effective decision-making information for transportation and management departments and provide a new solution for vehicle trajectory data mining.
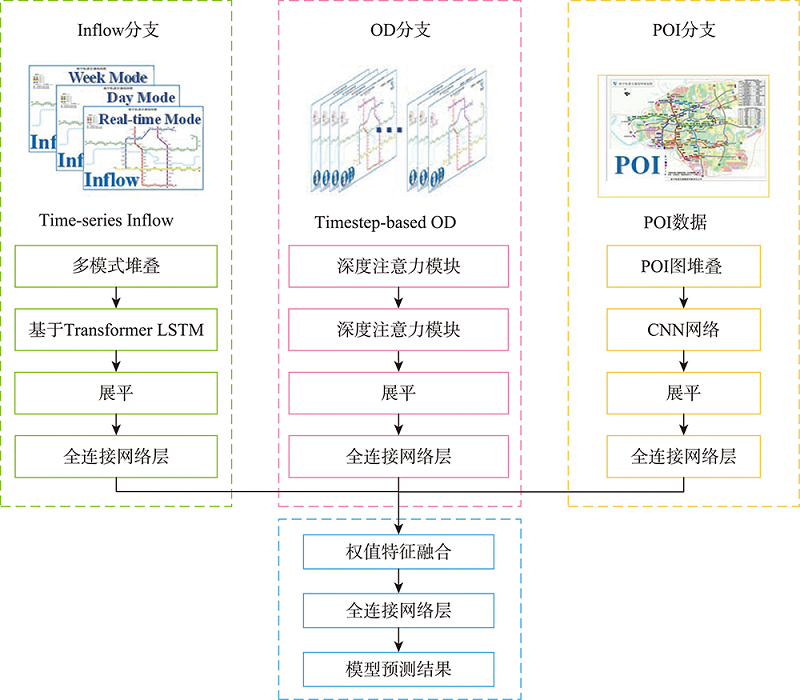
Accurate and reliable short-term passenger flow prediction can support operations and decision-making of the URT system from multiple perspectives. In this paper, we propose a URT multi-step short-term passenger flow prediction model at the network level based on a Transformer-based LSTM network, Depth-wise Attention Block, and CNN network, named as Spatial-Temporal Integrated Prediction Model (STIPM). The STIPM comprises three branches. The first branch takes time-series inflow data as input, and a Transformer-based LSTM network is selected to extract the temporal correlations. The second one takes timestep-based OD data as input, and many spatial and temporal features are captured using Depth-wise Attention Blocks. Meanwhile, timestep-based OD data can better include inter-station relations and global information. The third branch takes Point of Interest data (POI) as input and CNN network is utilized for spatiotemporal features extraction, which can also become the bridge between spatial and temporal features. Moreover, the “Multi-input-multi-output Strategy” for multi-step prediction is used to obtain a longer prediction period and more detailed information under a relatively high forecasting accuracy. The STIPM is applied to two large-scale real-world datasets from the URT system, and the obtained prediction results are compared with ten baselines and four variants from itself, in which STIPM model achieves highest prediction accuracy indicated by RMSE, MAE, and WMAPE evaluations, which demonstrates the superiority and robustness of the STIPM.
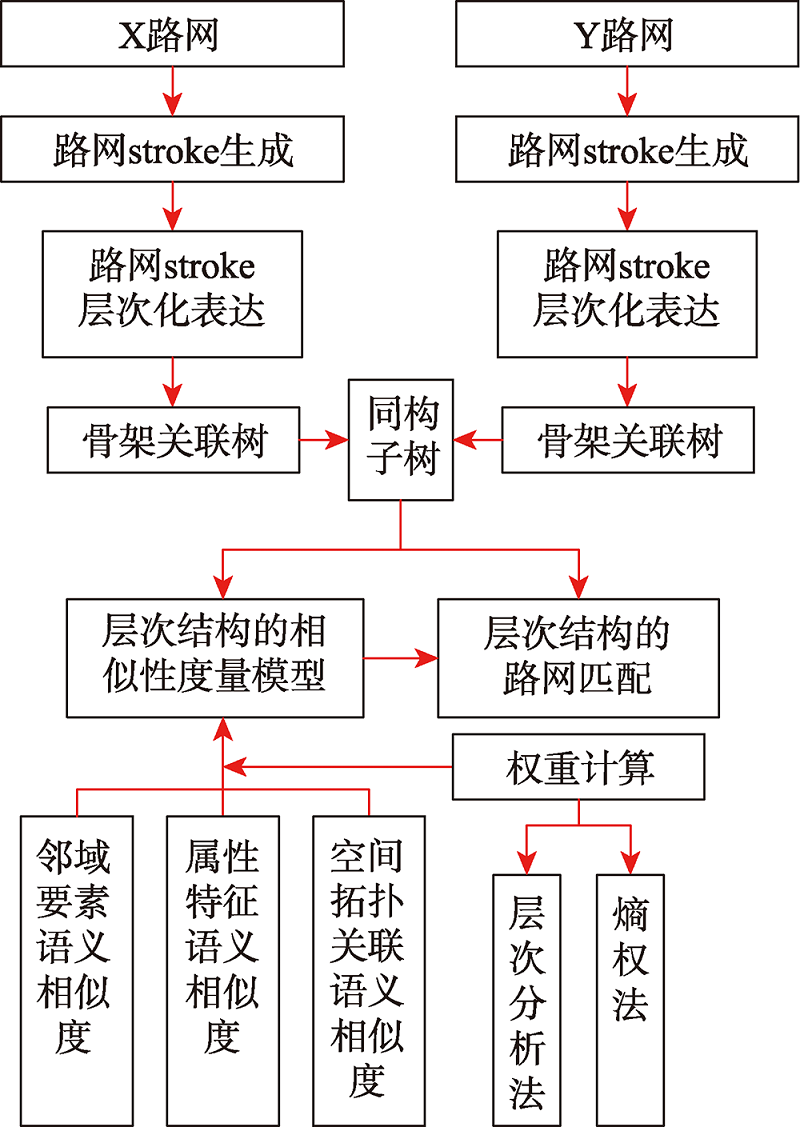
The road network data have characteristics such as multiple sources and heterogeneity, which affect the data sharing and integrating to some extent. As a solution to deal with this problem, this study proposes a same-name road matching technology, which mainly depends on road similarity metric and its matching strategy. The semantic similarity is a more effective metric than geometric similarity, therefore it is of great theoretical value and practical significance to conduct road network matching based on semantic similarity metric. At present, the semantic similarity of road networks is mainly evaluated by the attribute information of some feature items in the attribute table, with little concern for the hierarchical structure of road network, spatial topology information, and neighborhood element information, which has limitation in the estimation accuracy of the semantic similarity results. To address the above problems, a hierarchical semantic similarity metric model named "whole (skeleton tree) → part (isomorphic subtree) → individual (stroke)" is proposed in this paper, in which the semantic information of attribute feature items, topological association of upper and lower classes, and POIs in the neighborhood of the road network is taken into account, thereby overcoming the limitation of the traditional model. Firstly, the road network is expressed using stroke technique and ranked hierarchically. Next, the road network data are mapped to the associated skeleton tree according to the hierarchical relationship between various classes of stroke, and then a road network similarity metric model is established considering the hierarchical nature. Finally, the weights of constraint indexs are determined using hierarchical analysis and entropy weighting method respectively, and the semantic similarity of the road network is calculated using the weighting method. The model proposed in this paper is verified in the road network matching experiments and compared with the existing iterative model. The results show that the proposed matching road network using the semantic similarity metric model combined with isomorphic sub-trees can not only improve the accuracy of matching results but also increase the matching efficiency. From the case study of the road network conducted in the paper, the topology association semantic information has a more significant impact on the matching results than that of neighborhood POI semantic information, and the matching efficiency is remarkably improved when using isomorphic subtrees as reference for road network matching compared with the iterative method.
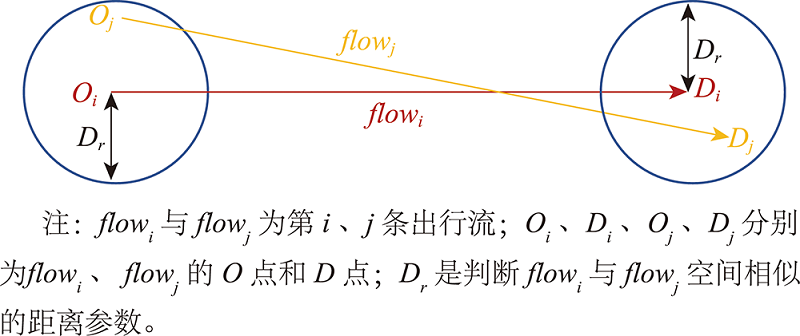
Traditional taxis and the e-hailing cars are two main transport vehicles for the public in current taxi market, which aim to satisfy the customized travel demand in daily lives of citizens in urban public transportation system. Due to the differences in service modes and commercial patterns, the two vehicles are appropriate for different target groups. Investigating the spatial and temporal characteristics of these two types of vehicle based on human travel flows can support the applications such as optimization of the urban public transportation and land use planning. The geographical flow space theory proposed recently provides a new theoretical perspective as well as a systematical analysis framework in studying the flow patterns of the travels by different types of vehicles. In this paper, we adopt this formulated theory framework to describe the travel flow. We select five typical flow patterns, namely random, clustering, aggregation, divergence, and community patterns, to reveal their spatial distribution characteristics and compare the differences in their travel patterns. The trajectory dataset of traditional taxis and the e-hailing cars in Xiamen City is employed to validate the effectiveness of the geographical flow space theory. We find that: (1) the travel flows of the two types of vehicles present significant non-random characteristics in flow space; (2) people tend to choose e-hailing cars for long distance travel, while prefer the traditional taxis for short and medium distance travels; (3) the two types of cars show different spatial distribution characteristics of the four typical flow patterns. The travels by e-hailing cars are more widely distributed and exhibit clustering patterns around the sub-centers at the suburban areas outside the core Xiamen Island and the east-southern software park area inside the Xiamen Island. Due to the travel demand driven model, the e-hailing cars satisfy the emerging high travel demand areas and tend to form community patterns. While the traditional cars are mainly distributed around the well-known city landmarks (e.g., Zengcuoan, Zhongshan road) on the Island; (4) approximately a quarter of the local areas have more than one typical flow patterns. Different types of cars exhibit different co-location flow patterns and spatial distribution characteristics. The mixed flow patterns derived from the geographical flow theory provide a more comprehensive perspective to better understand the travel flows, which can mitigate the misleading information from each isolated flow pattern. The above findings imply that the geographical flow theory can help to better understand the characteristics of the geographical flows and can be used to improve the applications based on related results.
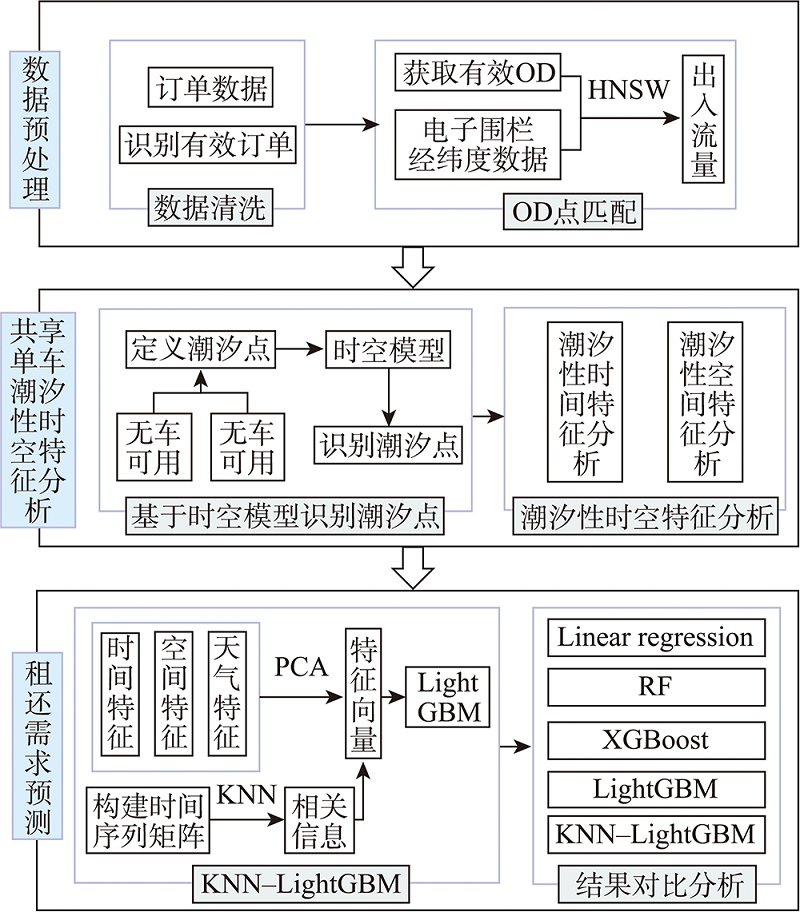
With the rise of bicycle sharing network, "shared-bicycle + subway" and "shared-bicycle + bus" have become the main mode of urban commuting, but the "tidal effect" of shared-bicycle makes it difficult to manage and deploy resources. Therefore, exploring the "tidal law" of shared-bicycle and accurately predicting the demand for borrowing and returning bicycles at parking areas (electronic fences) are important for the orderly and standardized development of shared-bicycle and the optimization of the riding experience and environment. Based on the spatial data of shared-bicycle orders and electronic fences, our research proposes a spatial-temporal model for identifying tidal shared-bicycle stops and analyzing their tidal spatial-temporal characteristics. Our model defines the tidal shared-bicycle stops as electric fences with lacking-bike/lacking-parking due to a large number of shared-bicycles borrowed/returned for a short time. The electric fences are then classified according to their status at a certain period and assigned different lacking-bike/lacking-parking indexes. The results show that our spatial-temporal model can accurately identify the tidal shared-bicycle stops at a specific period. Moreover, based on the spatial-temporal data such as shared bicycle orders, city information points (POI), road, population, land-use type, temperature, and wind speed, and considering the correlation of electronic fences at the local area, we propose a K Nearest Neighbors (KNN)-LightGBM model to predict the sharing demand of shared bicycles, which includes: (1) Principal Component Analysis (PCA) is used to extract characteristics; (2) The KNN algorithm is used to calculate the correlation information of electronic fences at the local area; (3) We integrate the characteristic vectors extracted by PCA and the correlation information of electronic fences as input, and use the LightGBM model to predict the sharing demand of bicycles; (4) We evaluate the importance of the characteristics that affect the sharing demand. The results show that the proposed KNN-LightGBM is better than the common machine learning methods in demand prediction at different time scales. The mean values of RMSE and MAE using our proposed model are the smallest and the mean values of R2 and r are the largest. We use the KNN algorithm to calculate the correlation of electronic fences, which can effectively improve the prediction accuracy. Compared with LightGBM, the RMSE and MAE of KNN-LightGBM are reduced by 10% and 11%, respectively, and R2 and r are improved by 3% and 4%, respectively. Based on the importance assessment of characteristics, the historical data of shared-bicycle orders are the most important for the demand prediction, followed by the distance to the nearest public transportation stations. Our study demonstrates the potential of model.
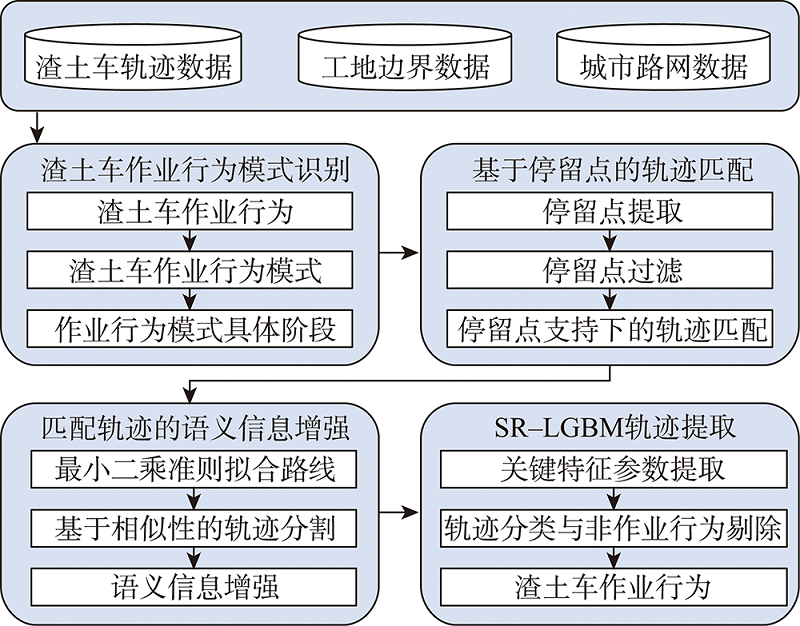
The muck truck trajectory data contain rich behavior pattern information, including key features such as parking behavior, transportation paths, abnormal activities, and muck loading and dumping OD points, etc. It has gradually become the main data source for operation monitoring and operation behavior supervision of muck trucks. However, at present, the traditional sign-in system of vehicle-mounted GPS data combined with site electronic fences is still commonly used in extraction of the muck truck operation behavior, which has a series of problems such as mutual inclusion and overlap between the electronic fence and the road. Aiming at the problem of misjudgment of vehicle operation in traditional extraction of muck truck operation behavior, this paper proposes a muck truck operation behavior extraction method considering trajectory restoration and classification. Firstly, the operation behavior pattern of muck trucks is recognized from two aspects: motion state and geometric form. Secondly, the stopping point extraction algorithm taking into account time and distance is used to extract the vehicle stopping point, and the mapping relationship between the stopping point and the trajectory is processed to complete the trajectory matching based on the stopping point. Then, the average similarity function is constructed to enhance the semantic information of the trajectory. Finally, the SR-LGBM algorithm is proposed to filter the operating trajectory and non-operating trajectory and extract the operation behavior of muck trucks. The test results show that the accuracy of the proposed method is 97.29%, which is significantly improved compared with the traditional classification algorithms such as GaussianNB and Logistic Regression. Our proposed methods effectively solve the misjudgment problem caused by the overlap of electronic fences and roads or multiple fences, and can accurately and efficiently extract the operation behavior of muck trucks.
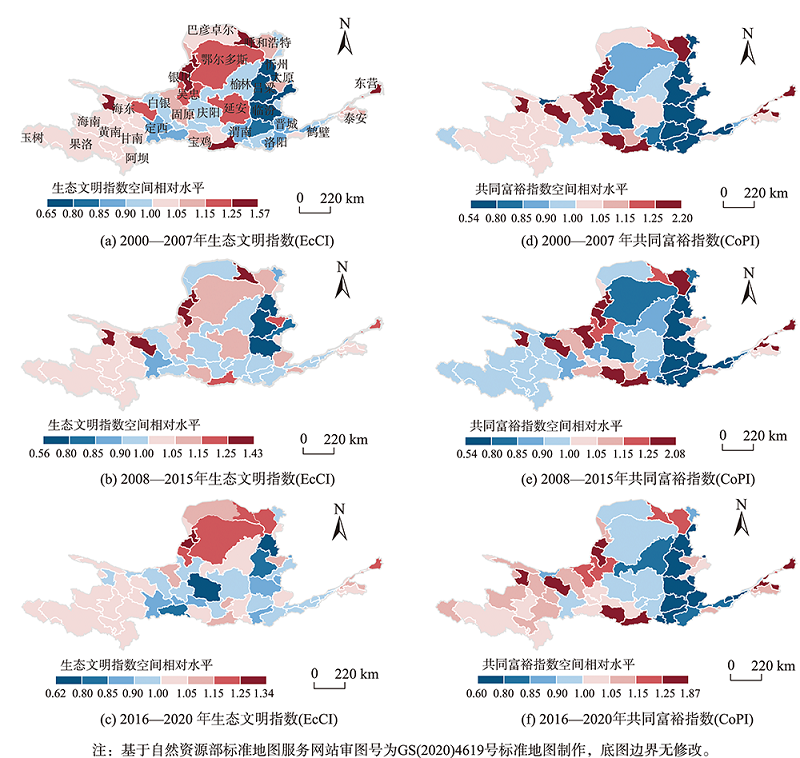
In view of the fact that the current comprehensive evaluation of spatiotemporal data fails to fully consider the spatiotemporal interaction information, this paper proposed a spatiotemporal dynamic entropy method, which can simultaneously consider the information entropy of the three dimensions of space, time, and spatiotemporal interaction. This method was employed to synthetically measure the Ecological Civilization Index (EcCI) and Common Prosperity Index (CoPI) at the prefecture-level scale in the Yellow River Basin in China from 2000 to 2020. Subsequently, the Bayesian Adaptive Multi-stage Spatio-temporal Evolution Model (BAMSTEM) was applied to finely study the spatiotemporal evolution of the EcCI and CoPI in the Yellow River Basin. The overall spatial pattern and the nonlinear local trends of the EcCI and CoPI in the Yellow River Basin were effectively explored and identified by the BAMSTEM. In order to quantitatively measure the spatiotemporal synergy state of the EcCI and CoPI in the Yellow River Basin, a Bayesian spatiotemporal synergy model was proposed in this paper. This model can effectively quantify the spatiotemporal synergy in four types of change combination scenarios: both increasing, the former increasing vs. the latter decreasing, the former decreasing vs. the latter increasing, and both decreasing. This study found that the process of the spatiotemporal evolution of the EcCI and CoPI in the Yellow River Basin can be divided into three periods: 2000-2007, 2007-2015 and 2015-2020. The overall spatial pattern of the EcCI transformed significantly in the later period, while the CoPI remained basically stable in the three periods. It indicates that the difficulty of the regional coordination of the CoPI is higher than that of the EcCI. In the early and mid-term, the EcCI and CoPI in a few regions showed a downward trend, but in the later stage, the EcCI and CoPI in most regions showed an increasing trend. Compared to EcCI, the increasing trend of the CoPI showed the characteristics of regional polarization in the later stage. In terms of the space-time synergy, the spatial synergy state of the EcCI and CoPI in the Yellow River Basin remained basically stable in the three stages. In terms of spatial and temporal coordination, the spatial coordination state of EcCI and CoPI remained stable in the three stages. The spatial pattern of the EcCI and CoPI reached synergy in the western and eastern regions in the Yellow River Basin, while the relative level of the EcCI in the central regions in the Yellow River Basin was higher than that of the CoPI. In particular, in the late stage (2016-2020), the growth trend of the EcCI and CoPI in 68 (92%) prefectural-level cities in the Yellow River Basin tended to be consistent, but the regional differences were significant. Therefore, the regional heterogeneity should be fully considered and the coordination among regional cities should be strengthened when the targeted policy system for promoting ecological progress and achieving common prosperity is made.
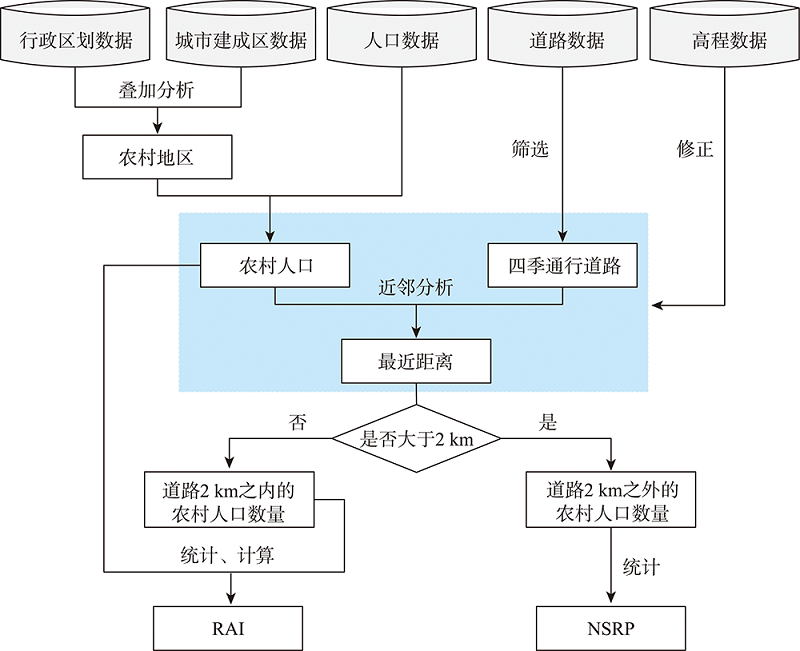
Rural Access Index (RAI) is an indicator (SDG 9.1.1) of the UN's Sustainable Development Goals (SDGs), and it measures the proportion of the rural population who live within 2 km of all-season roads. Currently, there is a lack of evaluation on RAI's spatial pattern in China and its influencing factors in existing studies. To fill this gap, our study proposes another indicator, Non-Served Rural Population (NSRP), and employs six open datasets including 1:250 000 road data, 1:1 000 000 county-level division data, 100 m population data, urban extent data, DEM data, and GDP data to evaluate both the RAI and NSRP indicators for 2852 counties in China. We also select two categories of variables (i.e., socio-economic and terrain variables) to analyze the spatial patterns of RAI and NSRP. Results show that: (1) The RAI and NSRP of China are 99.5% and 4.8 million, respectively. It means that 99.5% of rural population in China live within 2 km of all-season roads, and this value is much higher than that published by The World Bank. However, there still are 4.8 million rural population that live outside the 2 km of all-season roads; (2) The spatial patterns of both RAI and NSRP can be divided into two parts. That is, a relatively high RAI and low NSRP in the southeast of the “Hu Huanyong Line”, but on the contrary, a relatively low RAI and high NSRP in the northwest of the “Hu Huanyong Line”; (3) Both the RAI and NSRP are significantly correlated with socio-economic and terrain variables, and the correlation between RAI (or NSRP) and the terrain variable is the strongest, which indicates that the terrain may be a main factor that affecting the spatial patterns of these two indicators. This study first maps the spatial pattern of SDG 9.1.1 in China, which provides basic data, helpful information, and knowledge for improving road infrastructure in rural areas of China.
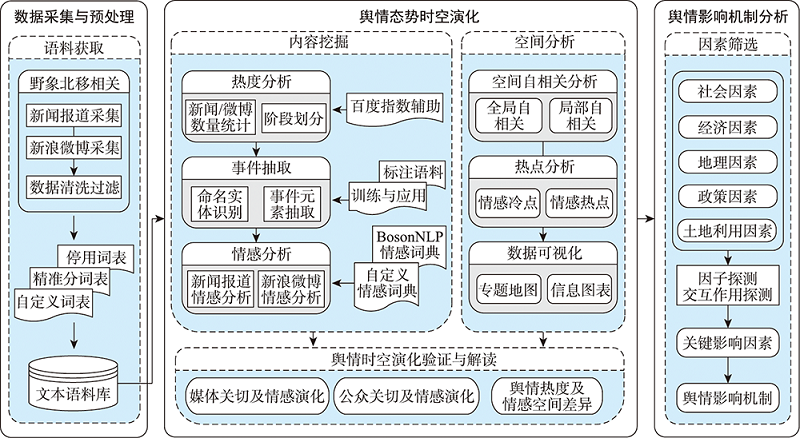
The analysis of network public opinion plays a significant role in the scientific management and timely response of emergencies. In this paper, we established a process of spatiotemporal evolution for the structured analysis of dynamics of public opinion on emergencies, taking the first case of long-range wild elephants' northward migration in China in 2021 as a case study. We adopted a sentiment analysis method combining key sub-event extraction and extended BosonNLP to study the emotional concern response and cascade effect of the wild elephants' northward migration event reported in news and social media. A geodetector spatial statistical analysis method was used to reveal the influence mechanism, and then to explore the differences in the dissemination and evolution of such emergencies and the related public opinions. The results showed that: (1) public opinion on the northward migration of wild elephants exhibited a long starting period but a short outbreaking period, and the information diffusion was less influenced by the decay law of spatial distance, but mainly depended on the regional distribution of Internet resource supply and communication media, which differed from the evolution law of public opinions on major cross-region emergencies such as public health and natural disasters; (2) public opinion was prone to be triggered when the northward moving elephant herd approached the densely populated urban areas, where the news media paid full attention to the wild elephant migration dynamics with obviously positive attitudes and became an important force to promote a construction of positive social public opinion; (3) a significant spatial clustering of Weibo sentiment was observed at the nation-wide and province-wide scales. At the national scale, Yunnan, where the event occurred, and its neighbouring provinces were identified as the low-low clustering emotional cold areas, while some concentrated areas with domestic media and Weibo users such as Beijing, Shandong, and Jiangsu were identified as the high-high clustering emotional hot areas; at the provincial scale, Kunming and its neighbouring prefectures/cities were also identified as the high-high clustering hot areas, whereas the major distribution areas of China's wild elephants such as Xishuangbanna and Pu'er were identified as the hot emotional areas. Therefore, the government departments and news media should exhibit differentiated responses to public concerns in the hot and cold emotional zones and then precisely guide local public opinion. These findings are important for enriching the methods and framework of public opinion geography in the era of big data, and promoting biodiversity conservation to achieve a harmonious society.
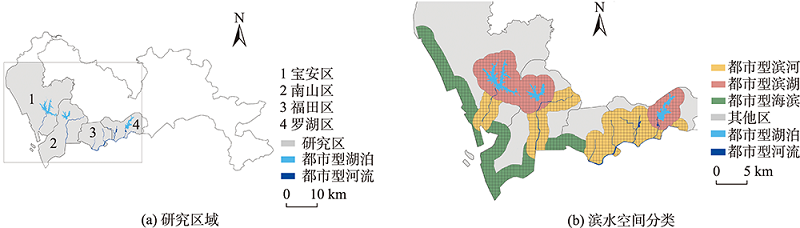
As an important urban public space, urban waterfront space is an important carrier of urban vitality and image. However, current studies mainly focus on the influencing factors of a single type of waterfront space vitality, and lack of research on the different influencing factors of different types of waterfront space vitality as well as the interaction between influencing factors, which cannot provide guidance for the fine management of different urban waterfront spaces. Based on the present situation, the paper takes Shenzhen city as an example, chooses the Baidu heat map data as the dynamic characterization of waterfront space, integrates multi-source geographic data, and uses the geographical detector model, to explore the interaction relationship between the built environment and different types of waterfront space vitality. The geographic weighted regression analysis was used to further identify the driving factors of vitality. The results show that: (1) there are great differences in the driving factors of waterfront space vitality. The location and accessibility are the main driving factors of riverfront space vitality. The explanatory power of location, population density, ratio of green space, and traffic accessibility factors is strong for lakefront space vitality. The driving factors of seafront space vitality include location, road accessibility, and aspect ratio factor between buildings and water surface; (2) The explanatory power of the combined effect of any two influencing factors is not always greater than that of the independent effect. Different from previous studies, the study shows that the interaction between functional mix and waterfront greenness and other factors has the most significant effect on the improvement of waterfront spaces; (3) The spatial variation of the influencing factors of waterfront space vitality is large, and the circle-like characteristic is obvious. The conclusion of the study is of great value for future urban planning and construction, further development of lake-reservoir/coastal areas, and improvement of waterfront space economic benefits.
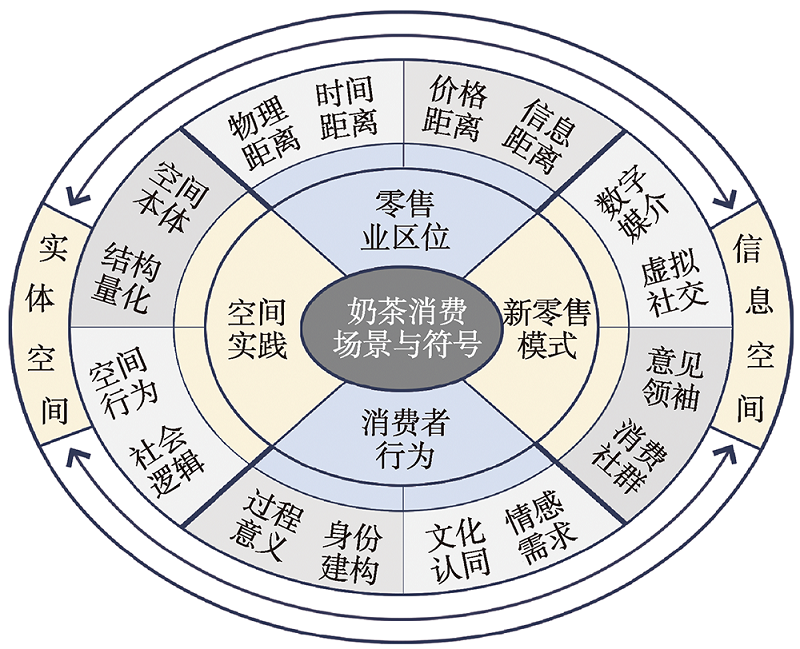
In the era of digital economy, the influence of new retail consumption space which combines scene consumption and symbol consumption, and physical space and information space, on the development of urban space is constantly expanding. Taking the consumption space of milk-tea in Xi 'an as the research object, space syntax is used to analyze the distribution characteristics of milk-tea consumption space. Threshold regression and multi-scale geographical weighted regression are constructed to analyze the influencing factors of the distribution of milk-tea consumption space. The results show that: (1) Location selection for new retail milk-tea is highly sensitive to market information and can respond to space regulatory decisions. The factors involved in the traditional retail location theory, such as consumer market, spatial proximity, land price, and industrial development, have a significant impact on the spatial distribution of new retail milk-tea consumption. However, there is a game between physical and information entities in new retail milk-tea consumption space, with the role of information growing significantly with the expansion of scale; (2) The spatial distribution of new retail milk-tea consumption reflects the characteristics of organizational behaviors displayed by brand community. The consumption subjectivity of consumer community is enhanced. The new retail milk-tea consumption space of different brands promotes the growth of consumer communities in various ways; (3) Social culture perception has price threshold effect in both physical and information consumption space. Information flow and material flow are mutually exclusive in the action mechanism of low-priced consumption space scene and symbol value, and cultural dissemination depends on the density, propagation rate, and frequency of scene and symbol. In the action mechanism of high-priced consumption space scene and symbol value, information flow and material flow promote each other, and cultural dissemination depends on the influence and propagation distance of scene and symbol; (4) Spatial syntactic model simulates the extension of information in the consumption space. Threshold regression and multi-scale geographical weighted regression reveal the production and reproduction mechanism of new retail consumption space. This study expands the research on new retail consumption space in consumer geography.
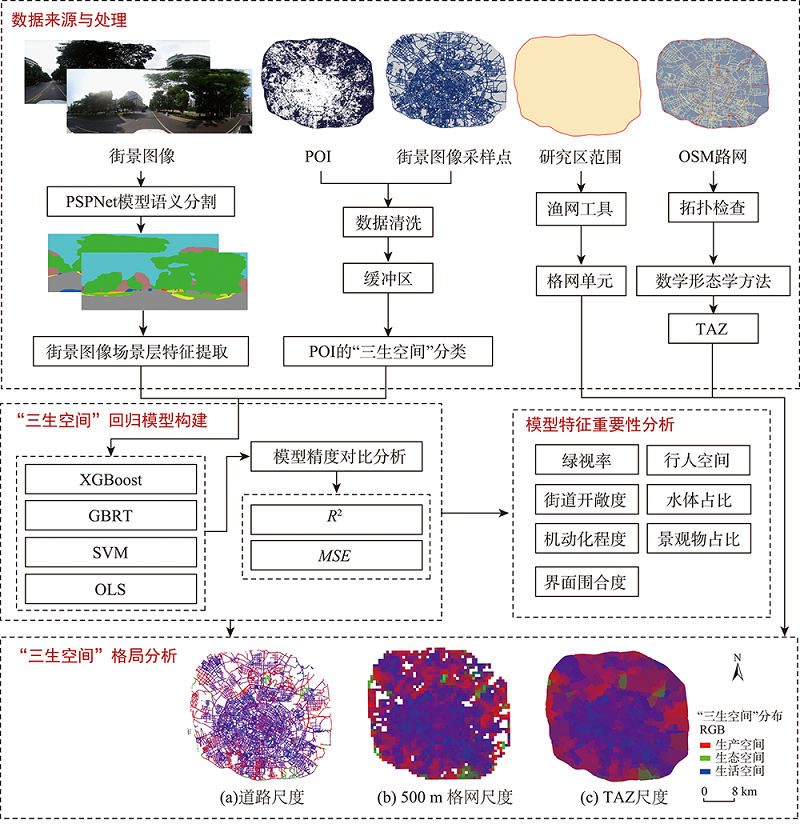
Understanding the urban spatial pattern from the perspective of the “Production-Living -Ecological” function not only paves the way to the optimization of land spatial structure, but also reflects the internal functional form and combination mode of urban land. However, in the past, the recognition of urban “Production-Living -Ecological Spaces” (PLES) mainly relied on remote sensing images, Point of Interest (POI), and land use data, and there was a lack of three-dimensional information within a city. Street View Images (SVI) can reflect the characteristics of the streets in the city and capture large-scale and high-resolution objective measurements of the physical environment within a street from a close-up view. Therefore, based on the semantic features of the scene extracted from the SVI, this paper proposes a method of identifying PLES in the central urban area and analyzing the importance of different features of the PLES. Taking the Fourth Ring Road of Chengdu as the study case, the classification system of PLES is constructed based on POI data, and the proportion of PLES is calculated at each SVI sampling point. The eXtreme Gradient Boosting (XGBoost) algorithm is used to identify the urban PLES, and a comparative test of model accuracy is also carried out. The spatial distribution of PLES in the study area is analyzed from three scales, i.e., road network, 500-m grid, and traffic analysis zone. The SHapley Additive exPlanation (SHAP) method is introduced to identify the important features that contribute to PLES. The results are as follows: (1) The proposed method of identifying PLES based on SVI in this paper has a high accuracy. The R2 of the model for identifying PLES reaches 0.6, indicating the feasibility of SVI for identifying PLES; (2) The spatial pattern of PLES reveals that the study area is dominated by production-living spaces, which are large in number and distributed in pieces in the study area. The number of units dominated by ecological space is small, and they are mainly distributed in large parks; (3) Among the semantic features of the seven types of scenes, street openness and motorization level have the greatest impact on the formation of the PLES. Based on PLES, this study uses SVI data to conduct a fine-scale analysis of land use in central urban areas and determine the types of urban land. This paper enriches the data and methods of PLES identification and provides a new tool for the optimization of urban spatial structure and development decision making.
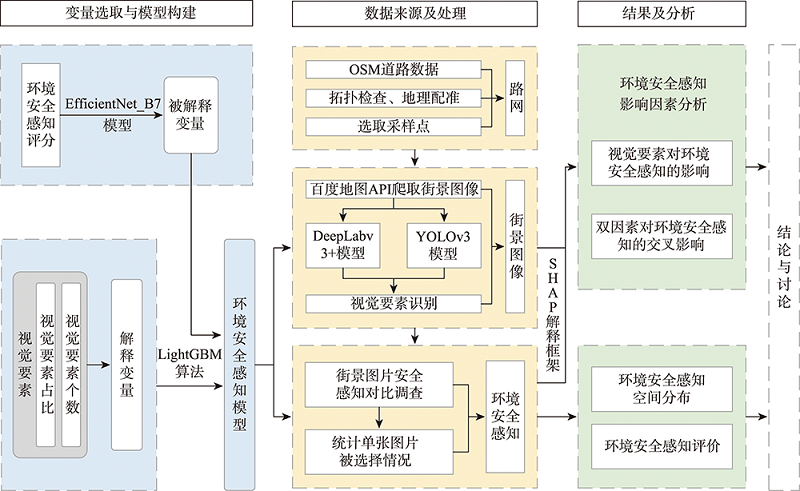
Accurate identification of visual factors affecting environmental safety perception provides important support for improving urban traffic environment and enhancing pedestrian travel safety. However, it is difficult to quantify environmental safety perception in complex scenes on a large scale in existing studies. Therefore, this study uses image semantic segmentation and object detection techniques to extract visual factors from streetscape images and constructs a road safety perception dataset by manual scoring in combination with deep learning methods. The influencing factors of environmental safety perception are also identified based on light gradient boosting machine algorithm and SHAP interpretation framework. In our study, the Anning District college cluster in Lanzhou City, a canyon city with a special road environment, is selected for the empirical study. Results show that: (1) The safety perception scores of colleges and commercial streets are high, while those of urban roads are generally low; (2) The image ratios of sky, sidewalk, road, and tree are the four factors that have the greatest influence on environmental safety perception, among which the image ratio of sky is linear, the image ratios of sidewalk and tree are similar to a logarithmic function, and the image ratio of road is similar to a quadratic function; (3) The proportion and number of visual factors have an interactive effect. A reasonable distribution of visual factors helps to create good spatial sightlines and suitable behavioral spaces, thus enhancing the perception of environmental safety.
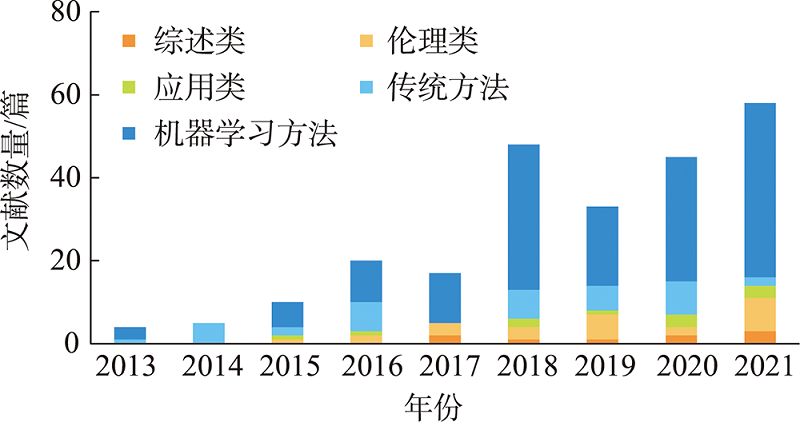
As a forward-looking and proactive policing mode, predictive policing has been a major innovation of modern policing reforms across the USA and European countries since it was proposed in 2008. As it does not involve the use of personal privacy data and can be integrated with police patrolling and precise crime prevention strategies, place -based spatial -temporal crime prediction has been a hot research topic and main component of policing practices. This research presents a systematic review of the progress of spatial-temporal crime prediction across the world since 2013 when the RAND Corporation released its special report on predictive policing. It contributes to the literature with the following five aspects: (1) summarizing the new trends in the field of spatiotemporal crime prediction studies in terms of the number of papers, research topics, leading scholars, and academic journals. The studies on spatial-temporal crime prediction have received extensive attention from various countries in recent years, and the research themes have shown a diversified trend. The most productive scholars are mainly from China and the USA, with the main focus on spatial-temporal crime prediction model development; (2) describing the new dynamics and progress of six basic components involved in the spatial-temporal crime prediction research, which are the prediction target, temporal scale, spatial scale, prediction method, performance evaluation measure, and practical evaluation. The four most widely studied types of crimes are theft, robbery, burglary, and motor vehicle theft. For burglary crime, the typical temporal unit for spatial-temporal prediction is 1-month; For the other three types of crime, the typical temporal unit is 1-day. For these four types of crime, the typical spatial unit is 200-meter grid. The top three models with the best prediction performance are random forest model, spatial-temporal neural network model, and Hawkes process model; (3) introducing several main commercial softwares for spatial-temporal crime prediction and global predictive policing practices; (4) investigating the relevant ethical issues and potential challenges that are embedded in each stage of practical applications, including data & algorithm biases, lack of transparency and countability mechanism; (5) prospecting future research directions in spatial-temporal crime prediction areas. This research provides a brief and panoramic image of the field of spatial-temporal crime prediction and can act as a reference for researchers and practitioners in relevant fields including crime geography, smart policing, and Policing Geographic Information System (PGIS).