Geometric and semantic integration of 3D building models are important infrastructure data for smart city, they are conducive for promoting the refined management and intelligent application of building facilities. However, most of the existing point cloud-based modeling methods focus on the reconstruction of geometric models with simple roof structure, and semantic and topological relations are ignored. Moreover, these methods are sensitive to noise, which are difficult to assure topological consistency and geometric accuracy. To solve these problems, this paper proposes a 3D primitive fitting algorithm for automatically reconstructing building models with complex roof structure from point clouds. Firstly, a 3D building primitive library is designed, including various 3D building primitives with simple and complex roof types. Secondly, an individual building point cloud input is segmented into multiple planes using RANSAC algorithm. The Roof Topology Graph (RTG) is then generated according to the relationship of roof planes, and the roof type of point cloud is subsequently recognized by comparison of RTG between point cloud and building primitives. Thirdly, the reconstruction is formulated as an optimization problem that minimizes the Point-to-Mesh Distance (PMD) between the point cloud and the candidate meshed building primitive. The sequential quadratic programming optimization algorithm with necessary constraints is adopted to perform holistically primitive fitting, so as to estimate the shape and position parameters of a 3D primitive. Finally, the parameterized model is automatically converted into City Geography Markup Language (CityGML) building model based on the prior 3D building primitive. The generated CityGML LoD2 (second level of detail) models are different from mesh models created by conventional building modeling methods, which are represented with geometric, semantic, and topological information. To evaluate the quality and performance of the proposed approach, airborne lidar and photogrammetric building point clouds with different roof structures are collected from public datasets for test. Several building models with complex roof types are successfully reconstructed by using this approach, and the average PMD of five models is 0.17 m. The proposed algorithm is also compared with three other methods. Experimental results indicate that the proposed method achieves the best geometric accuracy, because the average PMD of each model is less than that of other methods. Moreover, this automatic primitive fitting method is efficient, and it is also robust to noise and local data missing. This study demonstrates that the resulting building models can well fit the input point cloud with topologic integrity and rich semantic. This method provides great potential for accurate and rapid reconstruction of geometric-semantic coherent building models with complex roof condition.
The road boundary extraction from the vehicle-borne LiDAR point cloud can be easily affected by the occlusion of vehicles and pedestrians in urban environment. These occlusion phenomena will cause two problems: one is the generation of pseudo-boundary points, and the other is the discontinuity of boundary lines. We find that the elevation standard deviation constraint can effectively deal with the problems caused by occlusion. First, data pre-processing is carried out, including point cloud subdivision, cloth simulation filtering, and scanline storage. Second, a continuous double window is established based on scanlines. The bidirectional moving window method is adopted to construct elevation difference constraint, angle value constraint, and elevation standard deviation constraint to obtain candidate road points. Then, based on the continuity of road boundary, the DBSCAN algorithm in density clustering is used to generate relatively continuous and accurate road boundary points. Finally, the cumulative curvature value and distance of the boundary breakpoint region are calculated to determine whether a location is a junction. The boundary breakpoint is not considered connected if it is a junction; otherwise, it is regarded as a breakpoint caused by vehicle or pedestrian occlusion. The quadratic polynomial curve is used to smooth the boundary points, and the mathematical parameter model of the boundary is obtained. The experimental results show that the accuracy of road boundary extraction can exceed 80% in an urban environment with more occlusion.

To address the challenge of island elevation control information acquisition, a method of island elevation control point extraction based on ICESat-2 ATL08 data is proposed. Firstly, the sea area points and the gross error points in the data are deleted via the water area mask and the reference data, which reduces the volume of data waiting to be processed. Then, considering the impact of the atmospheric environment, signal-to-noise ratio, and data integrity on the accuracy of elevation control points, the data are preliminary screened with multiparameter restrictions. Finally, an adaptive terrain threshold is determined to extract the elevation control points based on the precision index. The accuracy of the extracted elevation control points are validated using high-precision Digital Elevation Model (DEM) data from various islands in Puerto Rico's outlying islands and the United States Virgin Islands. The experimental results show that, compared to the original data, the Mean Absolute Error (MAE) and Root Mean Square Error (RMSE) of the elevation control points extracted by the proposed method in the flat, hilly, and mountainous regions are reduced from 2.65 m/7.23 m, 3.92 m/7.65 m, and 4.93 m/8.29 m to 0.28 m/0.61 m, 0.46 m/0.79 m, and 0.63 m/0.89m, respectively. On the premise of ensuring accuracy, the number of elevation control points extracted by the proposed method is significantly larger than that of the existing methods. Our proposed method allows for extraction of a specific number of reliable elevation control points from the island region, which provides a solid foundation for the global nautical chart renovation and quality control.
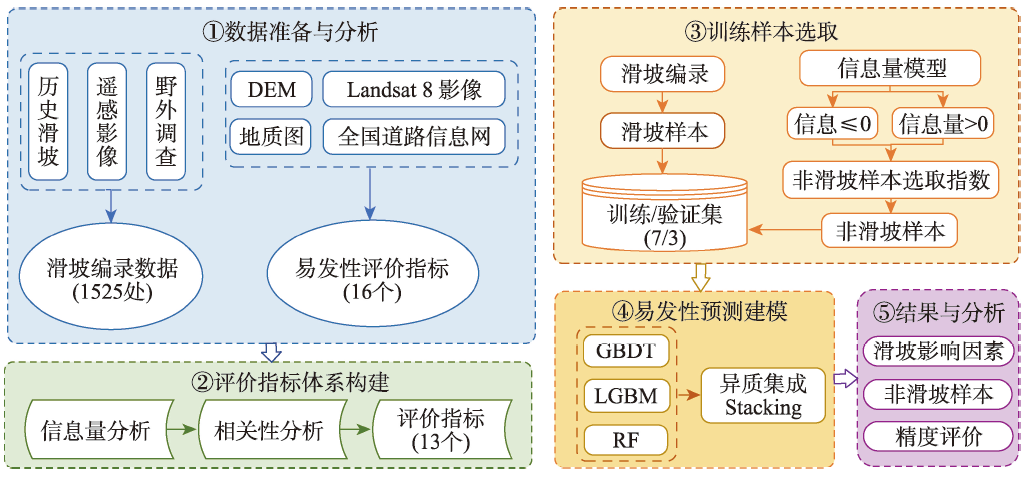
The single machine learning-based landslide susceptibility prediction model has different focuses of features and a weak classification ability, and also the accuracy of traditional random sampling of non-landslide is low. To solve these problems, this study optimized Non-Landslide Samples (NLS) based on the information value model and utilized Stacking heterogeneous ensemble models to evaluate the landslide susceptibility of Fengjie County in the Three Gorges Reservoir. Firstly, 16 evaluation indexes were extracted based on multiple sources of topographic, geologic, and remote sensing data, including elevation, slope, aspect, profile curvature, plan curvature, lithology, distance to fault, topographic wetness index, stream power index, distance to river, normalized difference vegetation index, distance to road, and land use, and the correlation analysis was carried out to exclude high correlation indicators and construct the landslide susceptibility evaluation criteria system. Then, the NLS index was proposed based on the information value model to divide the non-landslide samples into two categories: information values less than or equal to 0, and greater than 0. Finally, the logistic regression model was used to compare the non-landslide samples under different NLS conditions, and the NLS index was used to obtain optimized non-landslide samples, which forms the training set with the same number of landslide samples. Finally, Random Forest (RF), Light Gradient Boosting Machine (LGBM), Gradient Boosting Decision Tree (GBDT), and homogeneous (Boosting-RF, Boosting-LGBM, Boosting-GBDT) and heterogeneous (Stacking) ensemble methods based on these three models were compared for susceptibility evaluation. The results show that non-landslide sampling using NLS can produce non-landslide samples of high quality and generalization ability, which in turn improves the learning ability of the model and the accuracy of susceptibility evaluation. The Stacking heterogeneous ensemble model has the best accuracy of 0.941, which is better than the Boosting homogeneous ensemble models (an accuracy of 0.902, 0.897, 0.870, respectively) and other single models (an accuracy of 0.882, 0.864, 0.855, respectively). These results indicate that the Stacking heterogeneous ensemble algorithm is capable of extracting landslide and non-landslide features from various spatial angles, realizing the complementary advantages and disadvantages of the models, significantly improving the performance of machine learning, and obtaining better predictions, and thus is a reliable landslide susceptibility evaluation model. This study contributes to a better understanding of the landslide activity, improves the reliability of regional landslide hazard risk assessment, and provides support for carrying out reasonable land use planning, disaster prevention, and mitigation strategies.
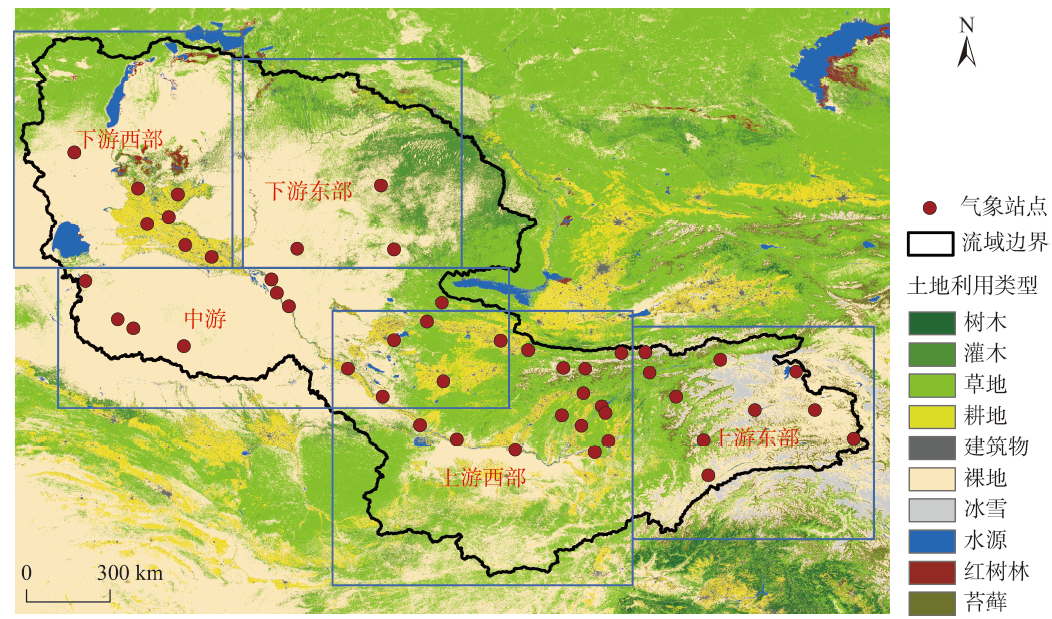
Most of the precipitation datasets in Central Asia have problems such as data missing, geographical bias and outliers, low resolution, and so on. The normal prediction results obtained by most machine learning methods are usually hard to interpret, not only due to the uncertainties from input information but also due to the complicated global geographical environments as well as the underlying local geographical conditions. In this paper, to overcome this problem, we proposed a novel downscaling precipitation model to adjust and optimize the precipitation computation results from Conditional Generative Adversarial Networks (CGAN) using an inverse distance weighting method based on the prior information of geographical differences of local digital terrain model and multiple weather stations. In this study, the Amu Darya River Basin was selected as the research area due to its various geographical environment and complicated topographic and geographical conditions. First, the input Climate Research Units (CRU) precipitation data with 55 km resolution were spatially corrected based on the topographic map using the spatial deformation model. The spatial deformation model was extended from spatial transformation network methods. Second, we input the corrected CRU precipitation data, temperature, wind speed, humidity equivalent data, and remote sensing data to the CGAN computing framework for high-resolution precipitation reconstruction. The experiment adopted the cross-validation method, taking 80% of the data as the training set, and the remaining 20% as the verification set. The test set contained 20 raster maps of annual precipitation from 2000 to 2019. The model was built based on pytorch 1.10.0, the batch size was 16, and the learning rate was 0.000 3. The epoch was 8 000 iterations in the Adam optimizer for gradient descent. Finally, the precipitation data of meteorological stations were used as the true values for analyzing the geographical differences of inverse distance weights and the accuracy of the corrected precipitation grid data. The results show that the proposed method can improve the resolution and accuracy of precipitation data,especially for the complex terrain and mountainous area. And Experiments on the Amu Darya in Central Asia show that the Root Mean Square Error (RMSE) of the downscaling result within the watershed was 15.96 mm, the Mean Absolute Error (MAE) was 11.82 mm, the R2 value was 0.83, and the deviation was 0.08. This study provides a robust, accurate method for improving the spatial resolution of precipitation data in complex geographical areas.
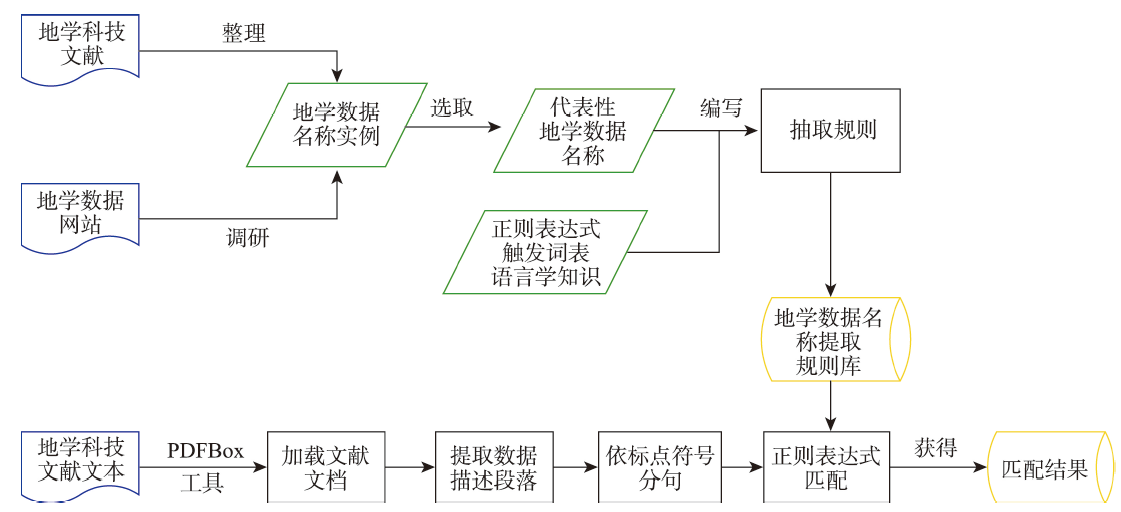
Geoscientific data represent important supporting information in geoscientific and technological documents. A large number of geoscientific and scientific documents contain research data information, and the data name that reflects the basic content of data acts as the core information. Automatic extraction of research data names from geoscientific and technological documents is of great significance for promoting the sharing of high-quality geoscientific data, reproducing literature experiments and results, and realizing the correlation between scientific data and scientific and technological documents. It can potentially address the problem of insufficient utilization of data information in current geoscientific documents. Through reading a large number of geoscientific documents, this study analyzes the texts, structure characteristics, and expression characteristics of data names existing in paragraphs which describe the data source information, and proposes an automatic extraction method for the names of geoscientific data by summarizing the description rules of geoscientific data names. This method uses data category feature words as rule triggers, uses regular expressions to write extraction rules, and constructs a regular extraction rule library to complete the extraction of data name information from geoscientific documents. Finally, the name extraction program of geoscientific data is written in Java language, and the name information extraction from geoscientific data is carried out using geoscientific literature texts as the experimental data. The experimental results show that this method can effectively extract the name information of research data from geoscientific and scientific documents, with an accuracy of 62%.
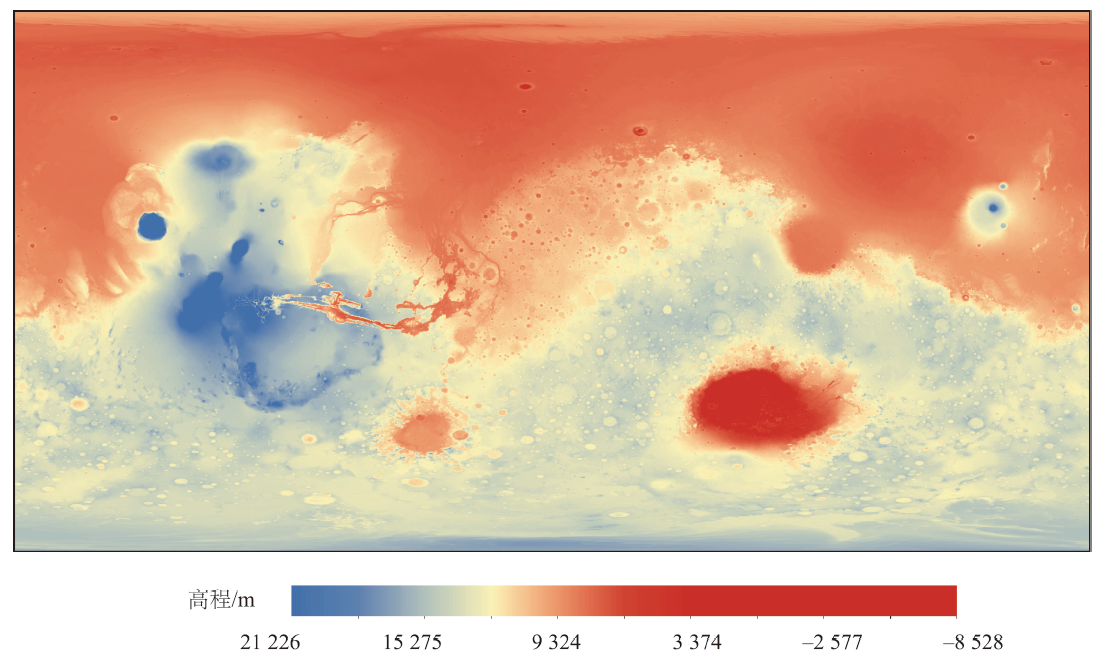
Astronomical solar radiation refers to solar radiation that falls on the Earth regardless of the influence of the atmosphere, which is a significant variable for resource assessment of solar energy. Characterizing the spatial-temporal distribution of Martian astronomical solar radiation can help the Martian exploration in the future, providing basic data for detailed utilization and efficient development of solar energy resources on Mars, as well as assistance for the scientific decision-making of governments. However, the Martian terrain is complicated, and its scale and shape are incomparable to those of the Earth. Therefore, it is impossible to ignore the influence of terrain on astronomical solar radiation on the Martian surface. Current studies of the Martian astronomical solar radiation do not consider the terrain shielding effect of the actual surface of Mars and often focus on local areas. In this paper, the comprehensive influence of latitude difference and time sequence replacement is considered. The Digital Elevation Model (DEM) with a resolution of 200 m is taken as the basic data, and a theoretical model for calculating Martian astronomical radiation based on DEM is proposed. The parallel computing framework provided by Hadoop distributed cluster is used to simulate the spatial distribution of astronomical radiation on the Martian global surface, by considering the impact of terrain, and taking 10 minutes as a time unit. The Rb is the ratio between the horizontal astronomical solar radiation and the astronomical solar radiation considering the terrain shielding effect, which is generally used to evaluate the terrain shielding effect of astronomical solar radiation. Based on the mean Rb corresponding to different global latitudes, the spatiotemporal analysis is carried out. Through interactive two-factor analysis of variance, factor analysis, and correlation analysis, the influence extent of terrain factors and astronomical factors on Rb value of shady slope and sunny slope is explored. The results show that the influence of terrain on the Martian surface has obvious regularity at the spatial-temporal scale, and the influence degree is not only related to the development of topography itself, but also affected by astronomical factors such as the height angle of the midday sun.
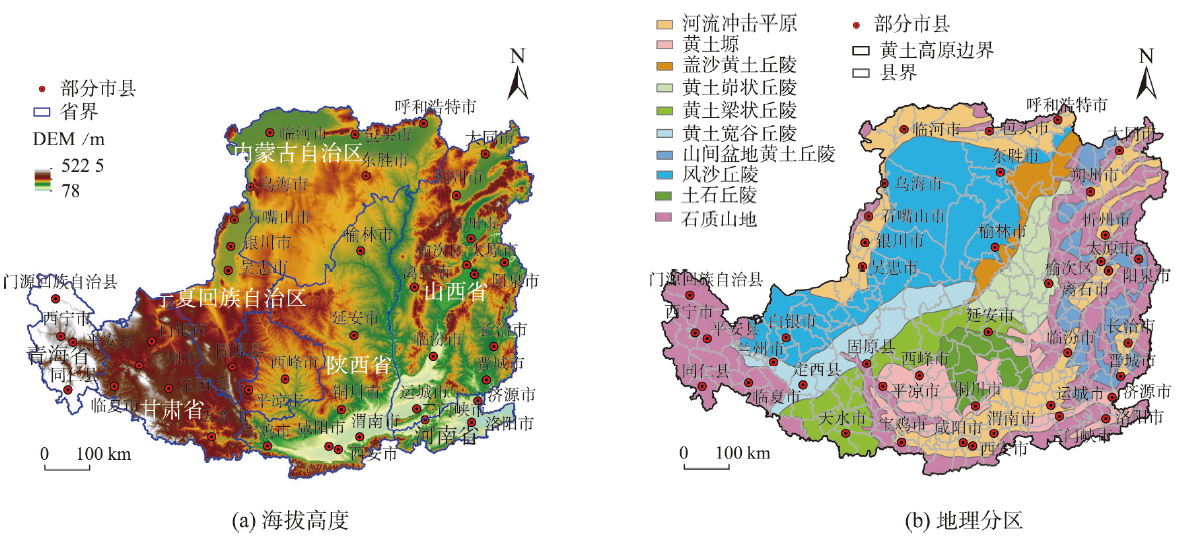
Terrain fragmentation is an important factor that can result in poor spatial connectivity and accessibility in mountainous areas, which seriously restricts regional transportation accessibility and urban-rural integration development. This study takes the Loess Plateau with dense valleys and highly fragmented terrain as an example and constructs a terrain fragmentation index system based on DEM data for overall fragmentation, positive and negative terrain, and transition terrain. We use the spatial clustering method (Automated Zoning Procedure-Simulated Annealing) and the objective weighting method (Criteria Importance Though Intercrieria Correlation) to generate spatial zoning and evaluation grading of topographic fragmentation at the county level and explore the spatial heterogeneity of topographic fragmentation on the Loess Plateau. The results show that: (1) The general spatial distribution of terrain fragmentation indicators are characterized by contiguous clusters, among which high values of Elevation Standard Deviation and Terrain Relief are mainly located in the Longzhong Plateau and the area near the Qinling Mountains, and the low and medium values are mainly distributed in the north of Liupanshan-Weihe River; (2) The Loess Plateau can be divided into eight spatially continuous topographic fragmentation zones, and the four largest zones are located in the northern Shaanxi Plateau within the central part of the Loess Plateau, the Lvliang Mountains, and the Ordos Plateau in the north. They account for 66.37% of the total area and are distributed in a shape of Chinese character "田", while the rest of the subregions located along the western and southeastern edges of the plateau are small areas with long and narrow shapes. The spatial differentiation of the topographic fragmentation of the Loess Plateau has a simple characteristic in central area and are complex at the edge area; (3) The terrain fragmentation degree of the Loess Plateau can be divided into five levels. The highest fragmentation area accounts for 13% of the total area of the plateau, which is mainly distributed in the Longzhong Plateau and the northern part of the Qinling Mountains. And 55% of the total area of the plateau presents an spatial pattern of high in the west and low in the north, which is mainly distributed in the northern Shaanxi plateau and Shanxi plateau located in the central and eastern part of the plateau. This study provides references for the formulation of urban-rural integration development policy and transportation infrastructure planning in the Loess Plateau.
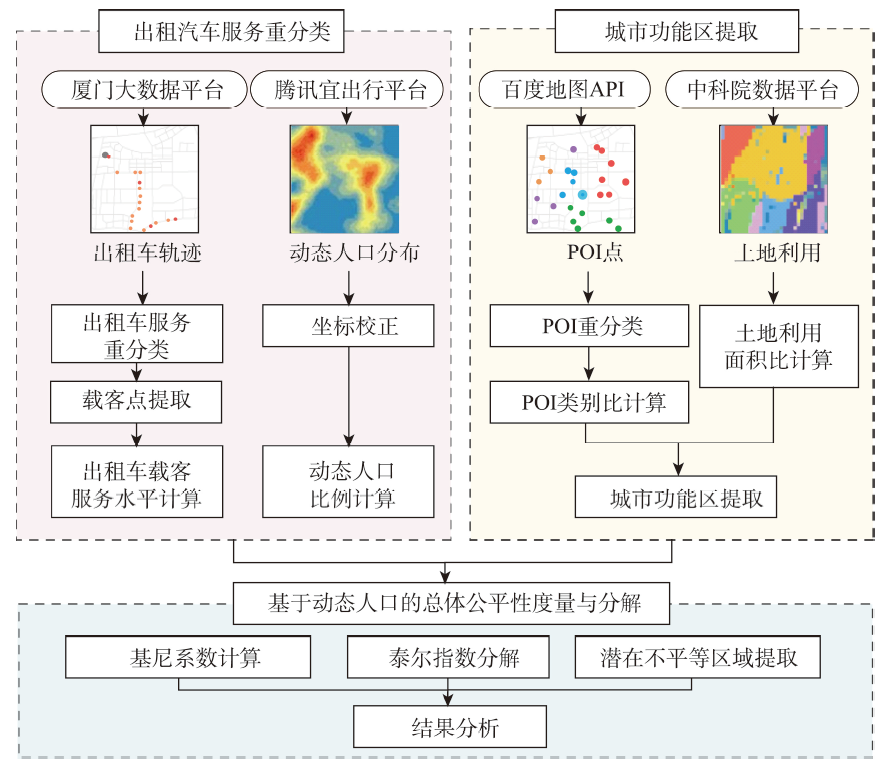
The term "equality " refers to the fairness of rights or resource distribution among social group members, which is crucial for traffic planning. The accessibility of public transport reflects whether residents of corresponding geographical analysis unit have reasonable access to public transports given the size of their population. Public taxi service (including both ride-hailing taxi and traditional taxi) is the primary means to meet urban residents’ personalized daily demand for public transport. Exploring the equality of public taxi services can provide support for optimizing personalized travel service in urban public travel. In this study, based on the taxi trajectory and dynamic population data of Xiamen, we used Gini coefficient and Theil index to calculate the equality of taxi service for three types of taxi service, i.e., cruise only, ride-hailing only, and mixed receiving taxi service. Then we analyzed the contribution of urban functional areas to equality of tax service and extracted areas with potential inequity. The results show that the proposed method can quantify the inequality of different taxi service and its changes under the context of COVID-19, based on the reclassification of taxis service. Specifically, (1) after the COVID-19 outbreak, the number of vehicles providing ride-hailing service decreased by 18.8% in Xiamen, with a 10% increase in service inequality relative to the dynamic population, while the number of taxis using cruising only to pick up orders remained relatively stable, and the inequality was also at a high level constantly; (2) In Xiamen city the overall inequality of ride-hailing only service was 66% that of cruise only service. The use of online car hailing platform improved the fairness of personalized public travel services for urban residents; (3) the equality of taxi service differed significantly among different types of urban functional areas. For cruising only service, 57.49% of the overall inequality was contributed by commercial land use in Xiamen. For ride-hailing only service, industrial and tourism land contributed 35.07% and 19.32% of the inequality, respectively. After the COVID-19 outbreak, the contribution of tourism land to the inequality of online shopping service increased significantly, by 81.67% compared to the pre-epidemic period; (4) Xiamen City contains two parts: inside-island and outside-island. The number of potentially inequitable service areas was much larger outside-island than inside-island. Areas with a low level of passenger service but a high level dynamic population are typically located in the island's natural parks, while areas with a high level of passenger service but a low level dynamic population are located beyond the island's natural parks; (5) Compared with the results based on the dynamic population, the inequality based on the static population assessment was overestimated by up to 89.25%. The research results of this paper demonstrate that the theoretical framework and analysis method can systematically reveal the inequality characteristics of public taxi service, providing guiding principle in urban traffic optimization.
As an important basic energy of our country, coal has been rapidly consumed due to extensive exploitation and utilization in recent years, meanwhile, it destroys the surrounding ecological environment, which further aggravates the contradiction between the exploitation of resources and environmental protection. Remote sensing technology, with its all-weather, full coverage, and multi-scale advantages, provides convenience for monitoring the environmental damage caused by coal mine development and utilization. However, from the perspective of green development concept, new requirements are put forward for the monitoring of coal mine resources and surrounding ecological environment. It not only requires long time series dynamic monitoring to provide data support for the analysis of temporal and spatial evolution of the ecological environment in the coal mine area and the surrounding areas, but also requires the identification of fine types within the coal mine area to further clarify the development and management trend. Therefore, based on GF-6 images, Landsat series images, and Google Earth historical high-resolution images, this study extracted the spatial distribution of four types of coal mine areas, including open pits, coal overlying areas, dump, and reclamation areas, from 2007 to 2019 in typical coal mine areas of Inner Mongolia by means of human-computer interaction. This paper analyzed the spatiotemporal evolution pattern of the coal mine area from two aspects: the trend of coal mine mining and management and the influence of coal mine mining and management on surrounding land use. The results show that the coal mine area was in the stage of centralized mining before 2010, and the main land cover type of the surrounding areas occupied was grassland. After 2010, the environmental treatment work was gradually carried out, and the mining intensity gradually slowed down. With the increasing strength of environmental treatment, the trend of treatment exceeded the trend of mining after 2015. In general, the mining and management of coal mine area has undergone a transformation from "mining coal mine by encroaching on grassland → type conversion within mining area → managed mining area to reclamation area". The impact on the surrounding ecological environment has mostly realized a transformation from "mining before treatment" to "mining while treatment". This research shows that the combination of multi-source remote sensing images can realize the long-term dynamic monitoring of coal mine areas including internal fine types from the perspective of green development concept, and the conclusions related to mining and treatment can provide technical support for the effectiveness assessment of policy implementation and the optimization adjustment of policy evolution.
Soil moisture is a key factor in the climate system and has important application in agricultural management, water resource management, and ecosystem monitoring and assessment. Although remote sensing-derived soil moisture products can provide soil moisture distribution on a large scale, they usually have coarse spatial resolution, making it difficult to meet the requirements of practical applications. Thus, downscaling of remote sensing-derived soil moisture products has become one of the hot topics recently. In this paper, the ESA CCI daily soil moisture at 0.25°resolution is used as the main data source, combined with the MODIS underlying surface data, topographic data, meteorological data, and other environmental factors at 1 km resolution. A random forest downscaling model is constructed to generate downscaled CCI daily soil moisture products at 1 km resolution in the Xiliaohe River Basin of China from 2013 to 2020. Results show that: (1) The analysis of the importance score of environmental factors shows that relative humidity and daytime surface temperature are the two most important factors influencing soil moisture, followed by topography and location factors; (2) The performance of the random forest downscaling model is verified by using the measured data of 22 stations within the study area, and the results show that the downscaled results considering multiple environmental factors (underlying surface, topography, and meteorology) are more accurate than that considering only surface elements. The RMSE of each site is below 0.048 8 m3/m3, the average correlation coefficient is 0.497 3, the absolute value of BIAS is 0.003 0~0.033 3 m3/m3, and the R2 of soil moisture after downscaling is 0.52~0.84 compared with the original CCI remote sensing soil moisture; (3) The downscaled soil moisture has similar temporal trends with the site-level measured soil moisture with less fluctuation in values. The downscaling method proposed in this study improves the spatial resolution of remote sensing-derived soil moisture data while preserving the spatial pattern of the original data set, which can meet the demand for high-resolution soil moisture data in practical applications and provide a reference for the selection of environmental factors in soil moisture downscaling studies.
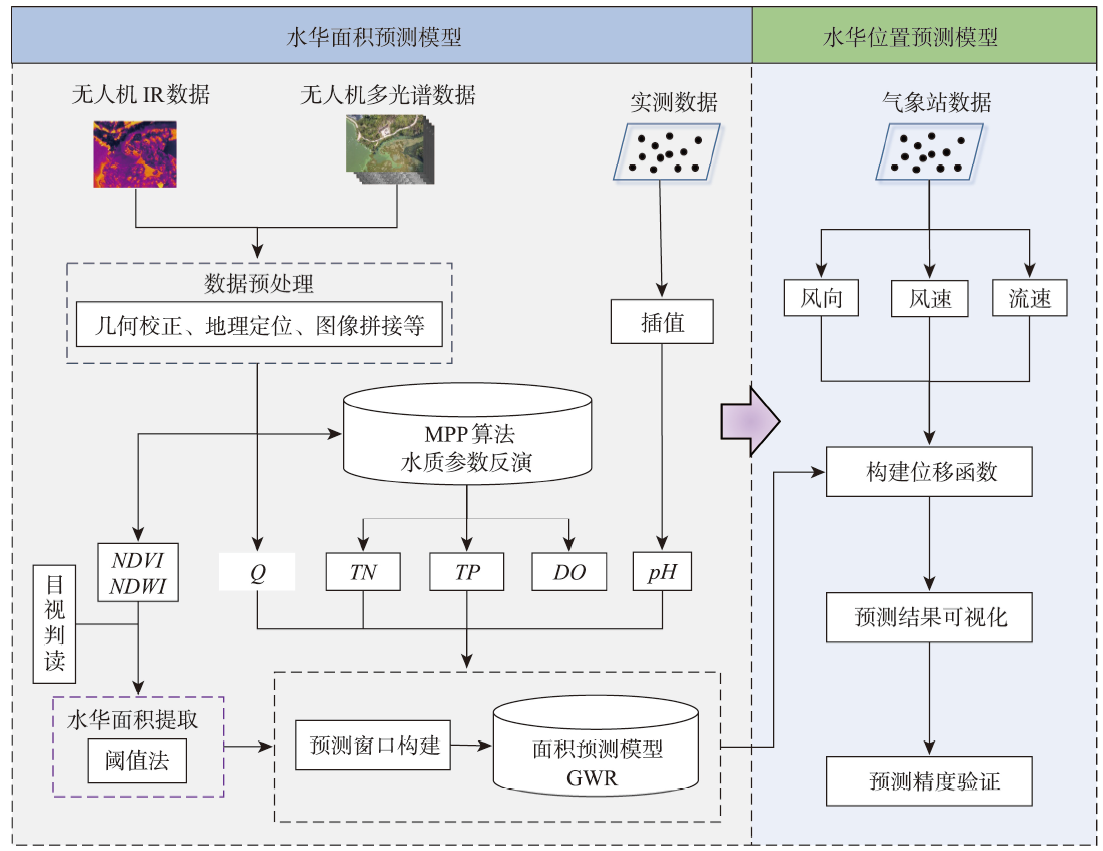
In recent years, the conflict between rapid growth of economy and protection of water resources has become increasingly prominent. Water bloom has also become an important environmental issue, both domestically and internationally. Efficient use of remote sensing to predict water bloom outbreaks is of great significance to promote the management and protection of the lake and reservoir water environment. Using multispectral images of Unmanned Aerial Vehicle and measured water quality parameters as data sources, the water quality parameters were inversed by the Matching Pixel-by-pixel (MPP) algorithm, and the water bloom information was extracted through the Normalized Difference Vegetation Index (NDVI) threshold method. Then, a short-term prediction model of water bloom based on geographical weighted regression was proposed. The characteristic of this model was that it can accurately estimate the area and spatial location of the water bloom within a short period. We also discussed the influence of window size on the prediction results. The results show that: (1) based on the proposed model, the prediction accuracy of bloom area reached 96.19%. For the spatial distribution of water bloom, the overall classification accuracy of water bloom and non-water bloom pixels was both greater than 0.969, and the producer accuracy and Kappa coefficient were both higher than 0.5; (2) the total nitrogen, total phosphorus, and dissolved oxygen concentrations inverted using the MPP algorithm showed high correlation with the measurements (R2 was 0.888 6, 0.854 6, and 0.896 9, respectively). The water bloom information extracted by NDVI threshold method had a high consistency with the true color orthophoto-based visual results in terms of bloom outbreak density and spatial distribution; (3) the prediction window size was closely related to the spatial resolution of data. The prediction window of different sizes directly affected the accuracy of water bloom prediction results. Compared with the window size of 8×8, 12×12, and 14×14, the highest accuracy (0.98), precision (0.77), and Kappa (0.77) were obtained with a window size of 10×10. Hence, the 10×10 prediction window was the most suitable for the water bloom prediction in this study area. The model developed here can effectively predict water bloom in lakes and reservoirs in advance, which provides a reference for improving short-term water bloom prediction and warning.
Acquisition of labeled samples for hyperspectral image classification is usually a time- and labor- consuming task. How to effectively improve the classification accuracy using a small number of samples is one of the challenges in the field of hyperspectral image classification. Most of existing classification methods for hyperspectral images lack sufficient multi-scale information mining, which leads to unsatisfactory classification performance due to small sample numbers. To address the aforementioned issue, this paper designed an adaptive fusion method by integrating global and local features for hyperspectral image classification with small sample numbers. Based on the dynamic graph convolutional network and the depth wise separable convolutional network, a two-branch network structure was constructed to mine the potential information of hyperspectral images from the global and local scales, which realizes the effective usage of labeled samples. Furthermore, the polarization self-attention mechanism was introduced to further improve the expression of intermediate features in the network while cutting down the loss of feature information, and the adaptive feature fusion mechanism was adopted to carry out adaptive fusion of global and local features. Finally, the fusion features flow into the full-connection layer and are manipulated by softmax to obtain prediction labels for each pixel of the hyperspectral image. In order to verify the effectiveness of the proposed method, classification experiments were carried out on four hyperspectral image benchmark data sets including University of Pavia, Salinas, WHU-Hi-LongKou, and WHU-Hi-HanChuan. We discussed and analyzed the influence of model parameters and different modules on the classification accuracy. Subsequently, a comprehensive comparison with seven existing advanced classification methods was conducted in terms of classification visualization, classification accuracy, number of labeled samples, and execution efficiency. The experimental results show that the dynamic graph convolutional network, depth wise separable convolutional network, the polarization self-attention mechanism, and the adaptive feature fusion mechanism all contributed to the improvement of hyperspectral image classification accuracy. In addition, compared with traditional classifiers and advanced deep learning models, the proposed method considered both execution efficiency and classification accuracy, and can achieve better classification performance under the condition of small sample numbers. Specifically, on these four data sets (i.e., University of Pavia, Salinas, WHU-Hi-LongKou and WHU-Hi-HanChuan). The overall classification accuracy was 99.01%, 99.42%, 99.18% and 95.84%, respectively; the average classification accuracy was 99.31%, 99.65%, 98.89% and 95.49%, respectively; and the Kappa coefficient was 98.69%, 99.35%, 98.93% and 95.14%, respectively. The corresponding source code will be available at
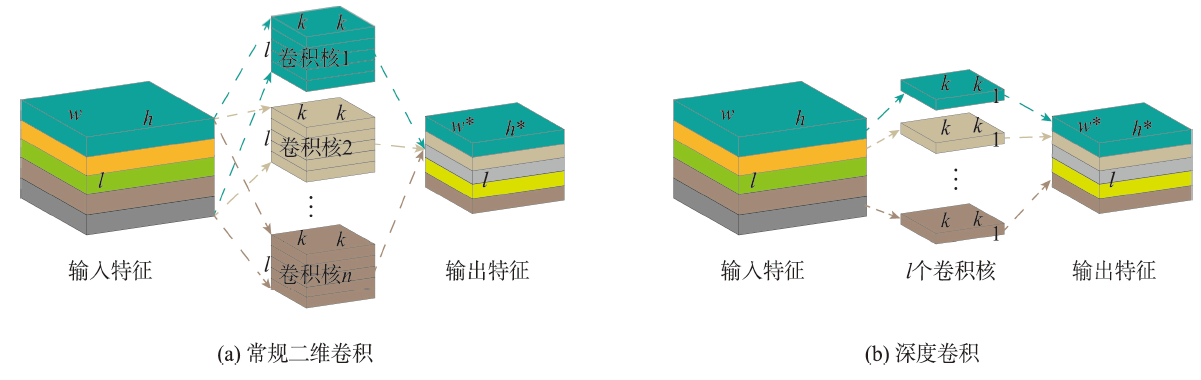
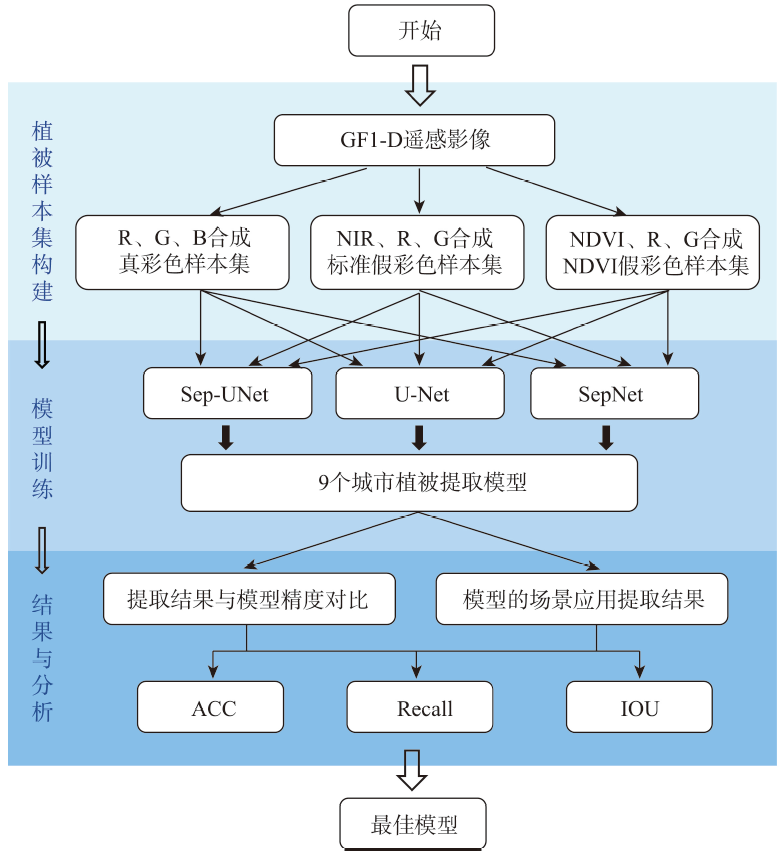
Urban vegetation is an important component of urban ecosystems and plays a vital role in human settlements, urban ecology, urban planning, and sustainable development. It is urgent to develop an efficient and accurate method to achieve the intelligent extraction of urban vegetation. In view of the problems of low efficiency and strong human intervention in the extraction of urban vegetation by traditional methods, and insufficient utilization of spectral information in deep learning methods, this study focused on intelligent extraction of urban vegetation from GF-1D high resolution remote sensing images by combining the most important spectral reflection characteristics of vegetation in the Near Infrared (NIR) band and the Sep U-Net, an optimization of U-Net. The main work of this research includes: (1) we created three sample sets considering the high reflectance of vegetation in the NIR band: the true-color green space sample set (true sample set), which served as the control group, the standard false-color green space sample set (the fake sample set), and the false-color green space sample set synthesized by NDVI (NDVI sample set); (2) the Sep-UNet was optimized based on U-Net. On the basis of U-Net, Sep-UNet expanded the network receptive field and increased the network depth by increasing the number of concatenated convolutions to achieve the purpose of enhancing the network's information processing of vegetation details. The separable convolution was used to reduce the network parameters while maintaining the underlying characteristics and depth of the network, avoiding the computational burden caused by network deepening. The batch normalization layer and Tanh activation function were also used to enhance the operability and robustness of the network; (3) we extracted urban vegetation from multiple scene images. Four typical urban scenes were selected from remote sensing images outside the sample set, and models were applied to extract urban vegetation from scene images with typical urban characteristics to verify the applicability and transferability of the models. The results show that: (1) The inclusion of NIR band significantly enhanced the accuracy of urban vegetation extraction. The extraction results using standard false color sample set were the best, followed by NDVI sample set, and the extraction results using true color sample set were the worst; (2) Based on the validation sample set, the urban vegetation extraction accuracy using Sep-UNet (ACC: 0.9576, IOU: 0.8938, Recall: 0.9549) was better than that using U-Net (ACC: 0.9389, IOU: 0.7593, Recall: 0.9405), and much better than that using SegNet (ACC: 0.8897, IOU: 0.8019, Recall: 0.8867), which demonstrated that the proposed model in this paper obtained best results for extraction of urban vegetation; (3) The extraction results from multiple scene images based on Sep-UNet showed that the model can also extract urban vegetation well from images beyond the sampling area, and the inclusion of NIR band can eliminate the interference of thin clouds, mist, and buildings, making the model have good generalizability.
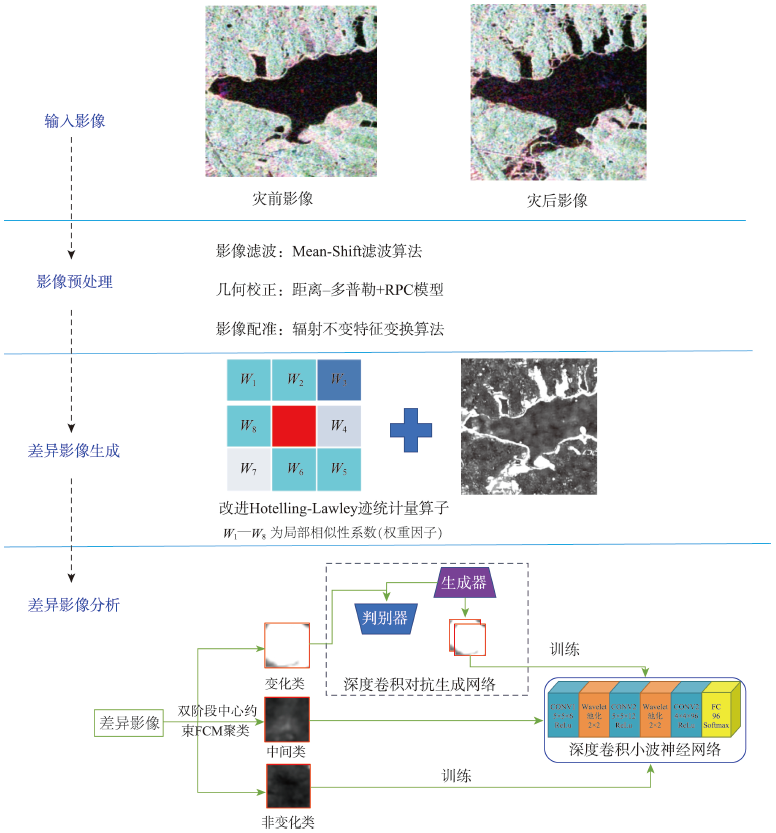
Rapidly and accurately monitor the flood disaster is very important, which can protect people's life and property safety and realize the sustainable development of society. The polarimetric synthetic aperture radar (PolSAR) image can obtain all-day and all-weather information of flood disaster by transmitting and receiving electromagnetic microwave of different polarizations, which can provide more favorable data support for flood disaster monitoring. However, the traditional flood disaster monitoring methods based on PolSAR images are seriously affected by speckle noise and the class imbalance between changed class and un-changed class leads to low accuracy of disaster monitoring. To address issues, a novel flood disaster monitoring method based on the improved Hotelling-Lawley Trace (HLT) statistic operator and deep learning for small area change using bi-temporal PolSAR images was proposed in this paper. Within this method, the HLT statistic operator was firstly constructed by considering the neighborhood information of PolSAR images, which can reduce the influence of speckle noise and spatial heterogeneity for the generation of the difference image in this paper. Secondly, the Two-stage Center-Constrained Fuzzy C-Means clustering (TCCFCM) algorithm and the Deep Convolutional Generative Adversarial Network (DCGAN) were introduced to build a robust method of sample select and express when lacked the changed samples over disaster areas, which can solve the problem of the class imbalance between changed and un-changed class. Finally, the Deep Convolutional Wavelet Neural Network (DCWNN) was constructed to achieve accurate monitoring of flood disasters. In order to verify the feasibility and robustness of the proposed method, the Radarsat-2 images covered Wuhan city before and after flood disaster were selected in July, 2016. The qualitative and quantitative results show that the proposed method can reduce the missed alarm rate and false alarm rate of flood disaster monitoring, and significantly improve the Overall Accuracy (OA) and Kappa coefficient (Kappa) of disaster monitoring, i.e. the false alarm rate and missed alarm rate of flood disaster monitoring are reduced respectively 1.5% and 2%, meanwhile, the OA and Kappa coefficient of flood disaster monitoring are significantly improved 3% and 0.02 when compared with the traditional methods of flood disaster monitoring, which can provide technical support of emergency relief work for relevant departments.