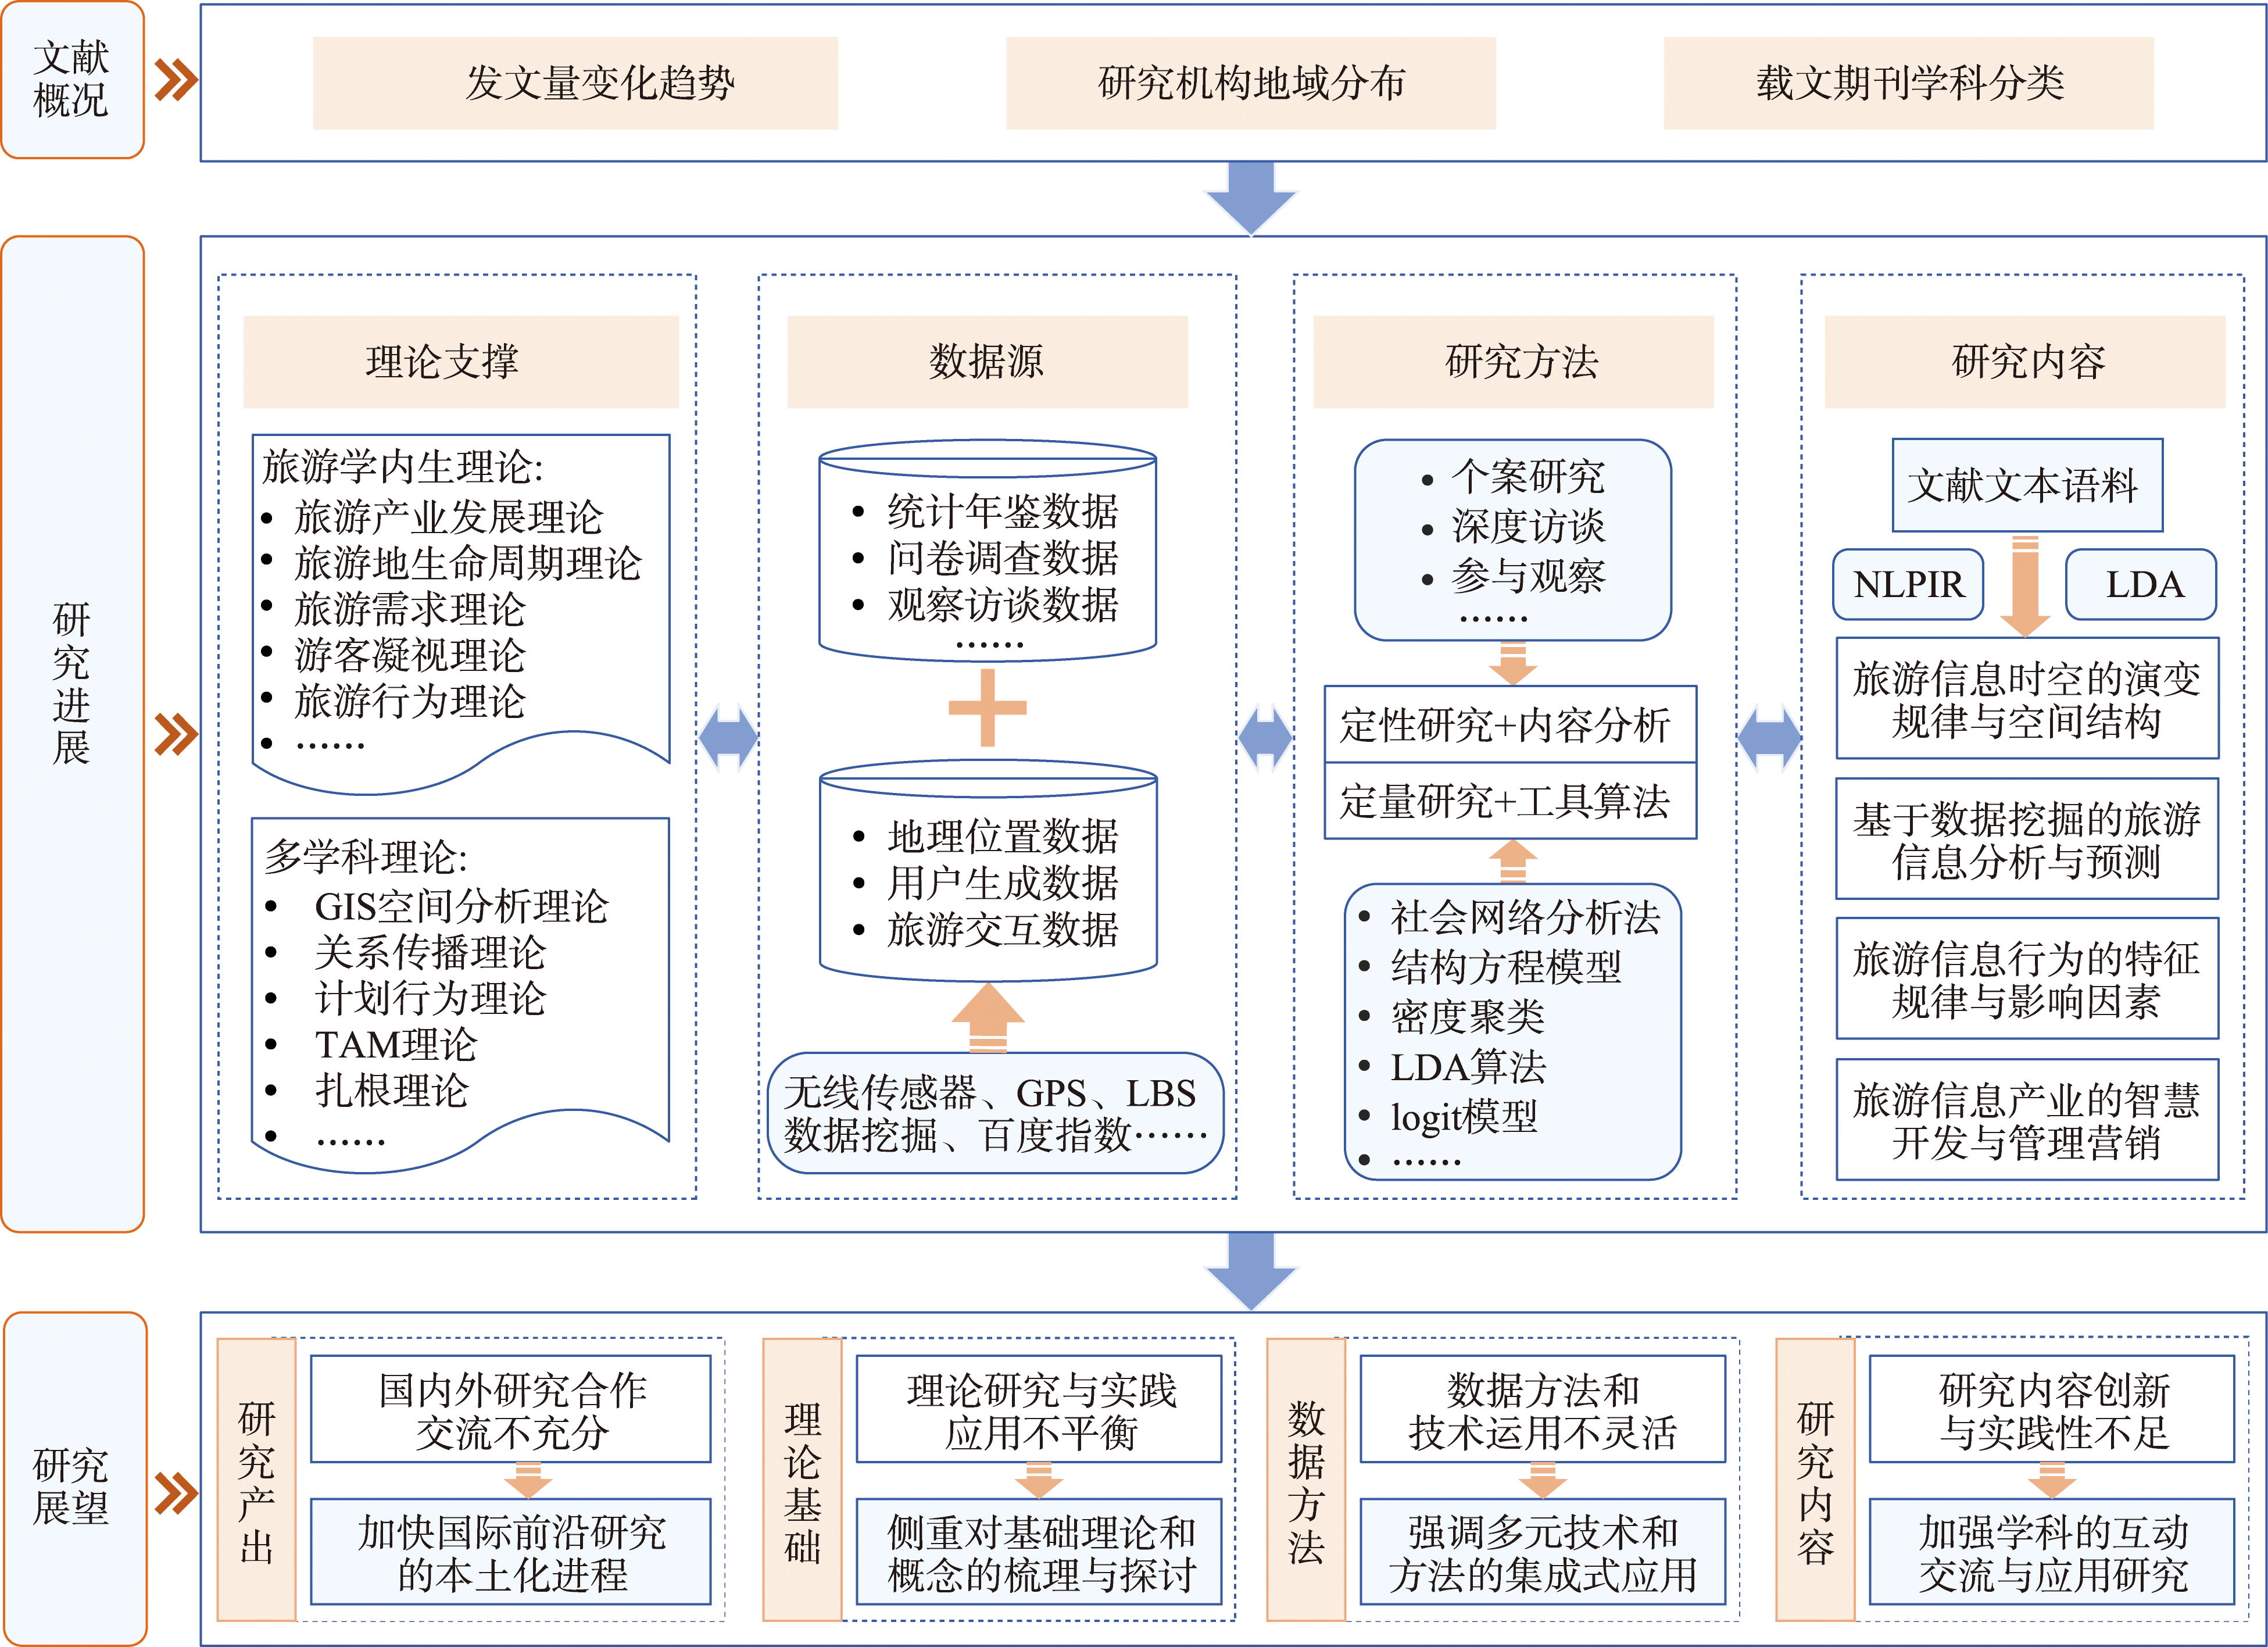
With the widespread application of information technology in the field of tourism, the importance of tourism information science has gradually become prominent. In order to systematically summarize the research progress of tourism information science, this paper collects and organizes research literature in the field of tourism information science at home and abroad from 2011 to 2022, and comprehensively uses literature analysis method and LDA topic model to discuss the literature overview and research progress of tourism information science under the background of interdisciplinary integration. This study summarizes that: In the past 12 years, the research on tourism information science has shown a trend of rapid growth, which has attracted the attention of many disciplines such as tourism, geographic science, environmental science and ecology, and computer science at home and abroad. However, compared to the domestic research, the international research progress in this field is more remarkable in recent years, and Chinese scholars have played an important role in international studies. The methods and theories used in the research show obvious interdisciplinary characteristics. The introduction of multi-disciplinary theories such as the spatial theory of geography, the relationship theory of journalism and communication, and the decision theory of behavior and psychology, the innovation of data acquisition methods such as wireless sensor networks, data mining, and API interfaces, and the comprehensive application of various research methods such as empirical research, model algorithms, mathematical statistics, and econometric analysis have innovated the research ideas of tourism information science. The research content focuses on the promotion of diversified technologies such as geographic information technology, data mining technology, and network communication technology in the field of tourism, and the exploration of the core topics such as tourism information spatiotemporal evolution law, tourism data mining and forecasting, tourism information behavior characteristics, and tourism information technology innovation and application. There are still problems in the field of tourism information science, such as the insufficient cooperation and exchange at home and abroad, the imbalance between theoretical research and practical application, the inflexibility of data methods and technologies, and the lack of innovative and practical research content. Finally, this paper proposes that tourism information science should accelerate the localization process of international frontier research, focus on the sorting and discussion of basic theories and concepts, emphasize the integrated application of multiple technologies and methods, and strengthen the interaction of disciplines in research application.
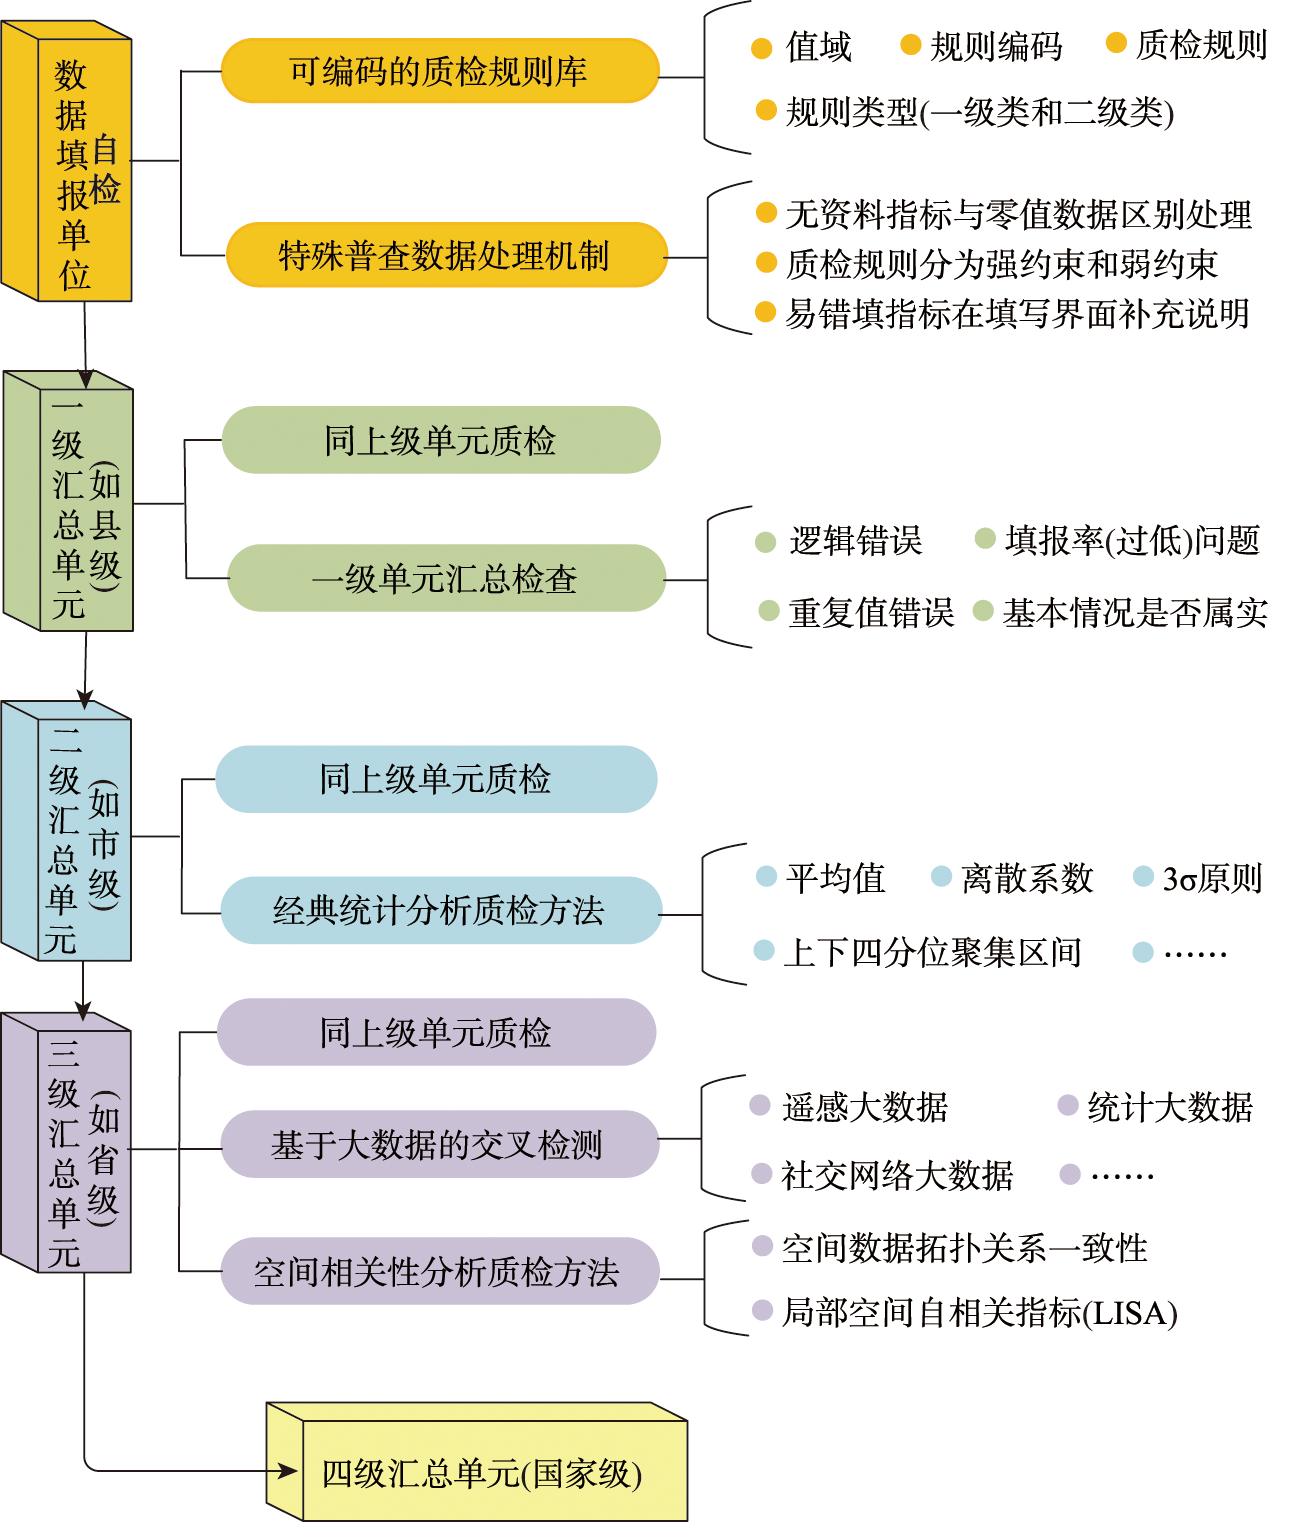
China is one of the countries that are most vulnerable to natural disasters. To enhance the comprehensive capacity for disaster prevention, the Chinese State Council initiated the first national comprehensive survey of natural disaster risks in 2020 (hereinafter referred to as the “disaster survey”). Data quality inspection and control of the disaster survey is fundamental to ensure data sharing, disaster assessment, emergency response, and even international cooperation in disaster prevention and reduction. This extensive disaster survey was completed by multiple departments, among which the emergency management system is responsible for three investigation tasks: vulnerability investigation of affected areas, historical disaster investigation, and comprehensive disaster reduction capacity investigation. According to the requirements of the quality inspection of disaster survey data, this study integrated the concept of geographical big data and explored a framework for quality inspection of natural disaster survey data. Specifically, our objectives include: 1) designing a business process framework for data quality inspection of the emergency management system at four levels, i.e., national, provincial, municipal, and county levels; 2) developing a technical rule system for data quality inspection following the principles of integrity, standardization, consistency, and rationality; 3) building a new rule database with 11 coding numbers, which can be updated and used by computer software systems; 4) developing a combination (spatial and non-spatial) outlier detection method combining classical mathematical statistics (e.g., standard deviation and median) and spatial correlation analysis (e.g., local indicators of spatial association); 5) proposing a new model for cross-detection of outliers using third-party big data; and 6) establishing a special survey data processing mechanism and a software system response mode to continuously evaluate China's national conditions. The feasibility of the above methods was empirically demonstrated by combining quality inspection practices in nationwide and an application practice of a county-level survey in Jiangxi Province. In total, ten types of data anomalies were found in practice, with most common anomalies falling into three categories: suspected violation of rationality, data exceeding the 99% confidence interval, and anomalies verified by third parties. Our research shows that this data quality inspection farmwork allows for disaster survey data quality inspection at early stages so that many errors can be automatically found during data collection, reducing the pressure of later-stage data quality control and thereby improving efficiency and saving costs. This methodology is expected to provide valuable references for ongoing natural disaster risk surveys and related surveys in the future.
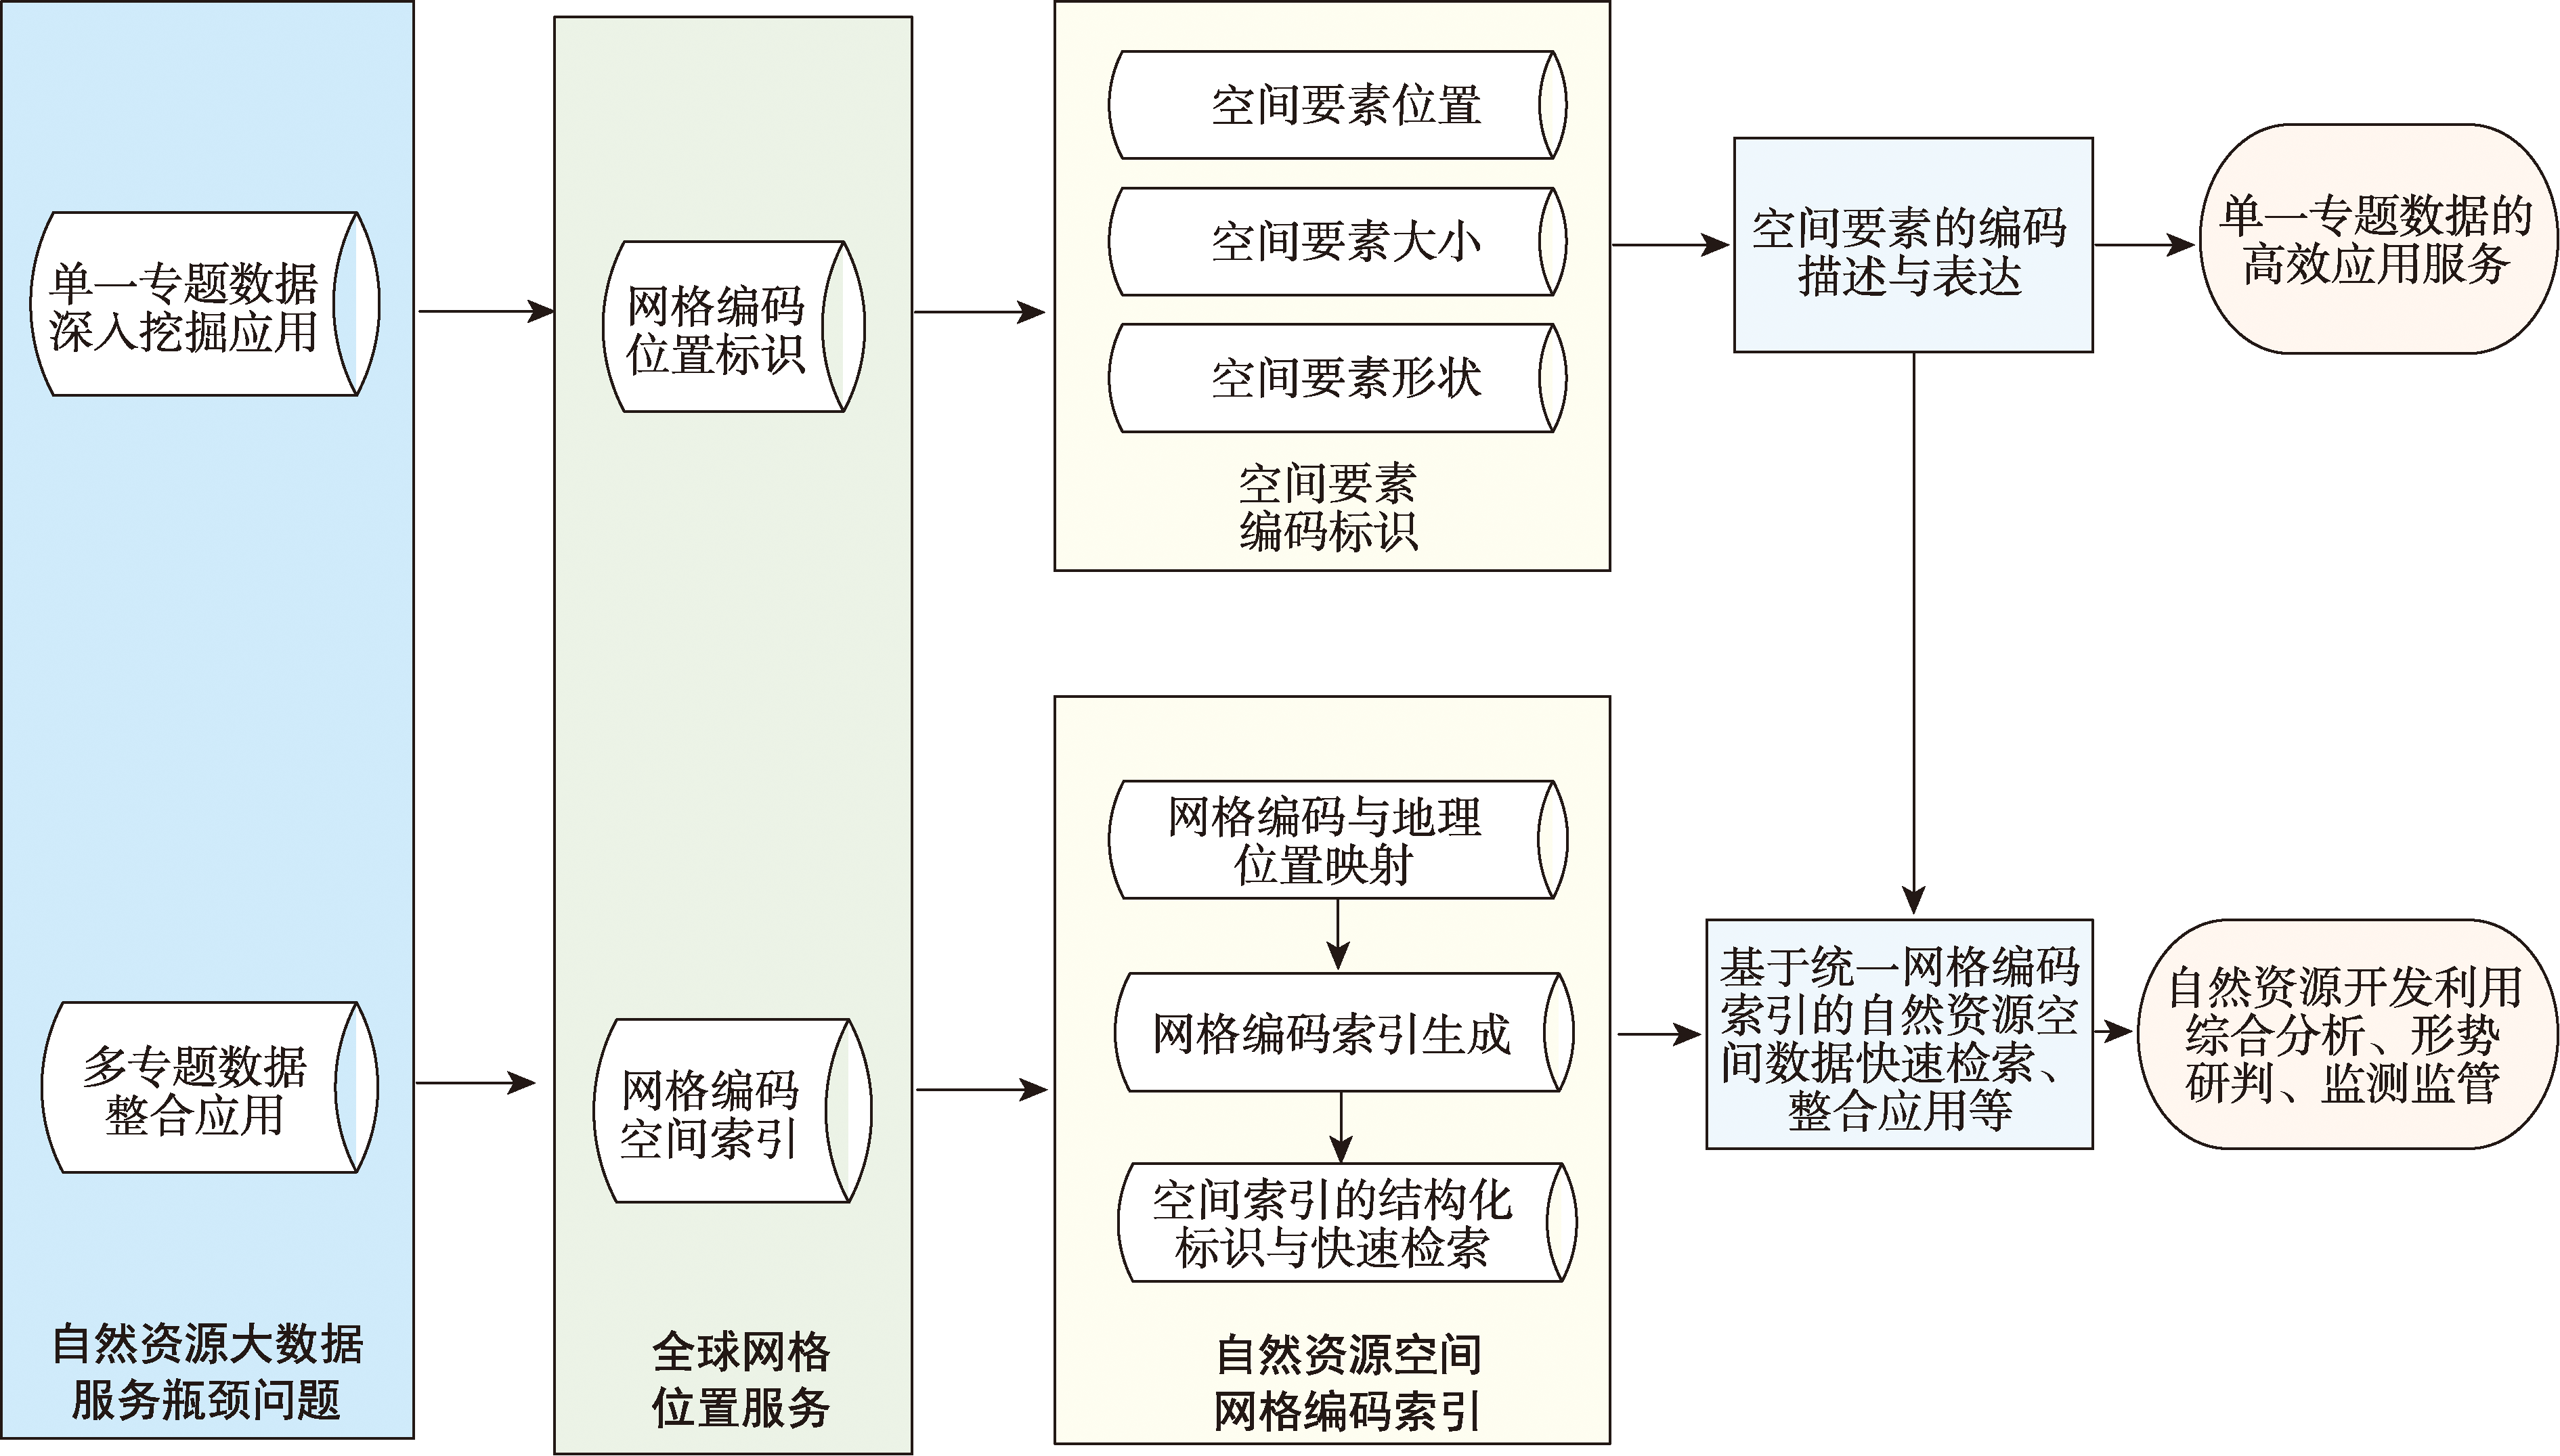
Based on the methods and standards of global grid subdivision, using the National Key Research and Development Program research achievement, i.e., Geo-grid location service in natural resources informatization, this paper investigated how to apply Geo-grid subdivision and grid encoding in real property registration information management and natural resources big data integration. This paper analyzed current situation of natural resources property registration information management and service and proposed a new real property identifier coding scheme based on the Geo-grid location service. This identifier coding scheme is based on the natural attributes such as location, size, shape of a real property unit. This new identifier coding scheme includes real property unit location identifier code and independent property right code. Real property unit location identifier code consists of location grid code, location scale code, longitude span code, latitude span code, and feature code. With a given longitude and latitude string of a real property unit, the real property unit location identifier code can be calculated automatically. Compared with the current identifier coding rule, this new identifier coding scheme realizes the functions of encoding stability, location correlation, and historical traceability. The encoding scheme can overcome the defects of current property identifier coding rule in information management and service. As a functional supplement, this identifier coding schema based on Geo-grid subdivision can be applied in real property registration information management and service with current coding rule. In natural resource big data integration, this paper studied data organization and indexes based on global grid subdivision. By means of setting mapping relationship between real locations of spatial elements and Geo-grid subdivision code, Geo-grid spatial index was established. This paper adopted land use data, land planning data, real property data of XiCheng District, Beijing, and compared two data indexes, Geo-grid spatial index and traditional spatial index. This paper tested the above index scheme in multi-data inquiry and retrieval of land planning, land use, and real property registration. As a result, the above data index scheme is efficient in multi-data integration of natural resources. The spatial index based on Geo-grid subdivision can break the bottleneck of traditional spatial index and improve the ability of multi-data integration. Also, the spatial index could improve the ability of natural resource survey, supervision, and macroscopic analysis. Our studies can promote the application of global grid subdivision and location service in natural resources big data, and improve the ability of natural resource big data management and data service.
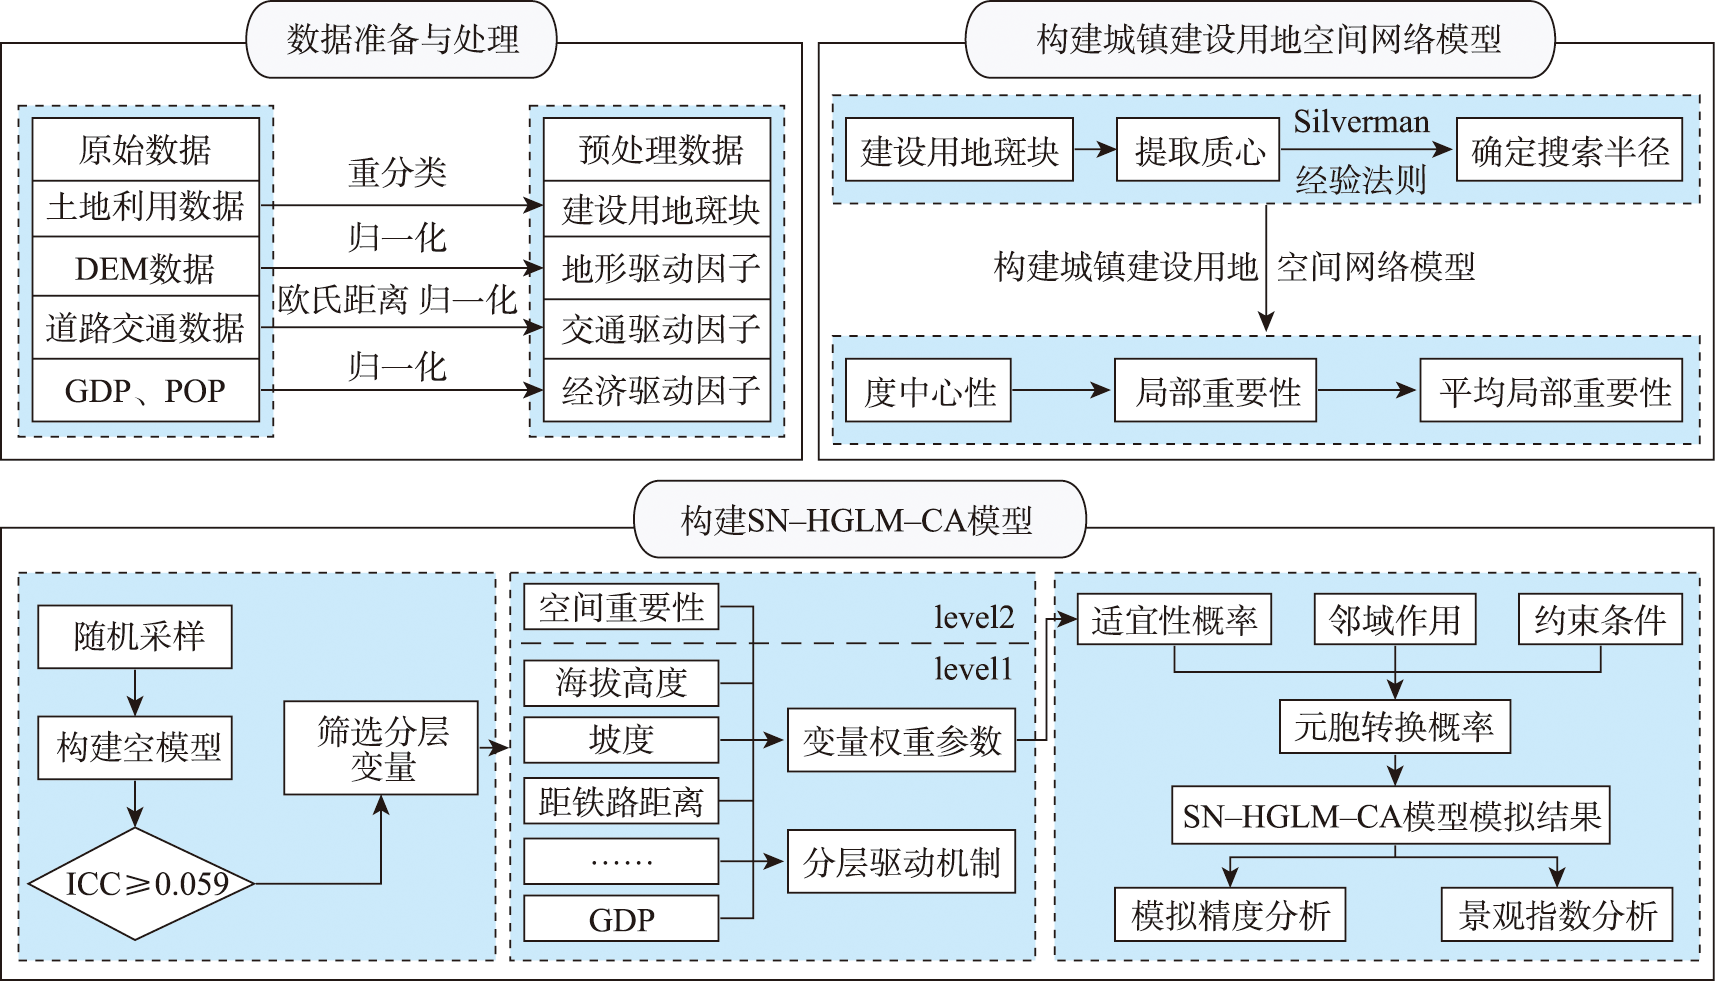
Requirements for the territorial spatial planning of the new era pose new challenges to the relationship between urban land expansion and agricultural and ecological spaces. Urban expansion is closely related to social and economic development as well as ecological environment protection. It is of great significance to study the urban expansion for promoting the urbanization process. The simulation of urban expansion can provide scientific support for formulating territorial spatial planning policies. The spatial characteristics of urban construction land patches are important factors affecting the expansion of urban land and are at different levels against the cell level. Therefore, hierarchically coupling the spatial characteristics of cells and patches can improve the simulation accuracy. Taking the Shanghai metropolitan area as an example, this paper constructs a cellular automata model (Spatial Network - Hierarchical Generalized Linear - Cellular Automata, SN-HGLM-CA) that takes into account both the spatial network structure of urban construction land and the hierarchical relationship of variables. Firstly, the spatial characteristics of patches are extracted through the spatial network model of urban construction land. The hierarchical relationship between variables is considered by using the HGLM to obtain the suitability probability of urban land expansion, and then embedded into the cellular automata model for urban land expansion simulation. This study draws the following research conclusions: ① The spatial network model based on urban construction land patches is of great significance for identifying the spatial importance characteristics of urban construction land and mining its expansion patterns; ② The HGLM model can reveal the hierarchical relationship between cells and patches during urban construction land expansion, which helps to improve the simulation accuracy of the cellular automata model; ③ The simulation of urban land expansion based on the SN-HGLM-CA model achieves good results in terms of simulation accuracy and landscape morphology, with the landscape similarity index exceeding 95%. In addition, compared to the SN-Logistic-CA model, the figure of merit value of our simulation increases by about 6.61%, which indicates that our simulation not only accurately reproduces the actual layout of urban construction land, but also improves the compactness of patch distribution. This paper explores the law of urban expansion from the spatial network structure characteristics of urban expansion, which can help urban planners to determine the reasonability of current trend considering the development status of urban expansion, and provide reference for the delineation of urban development boundaries.
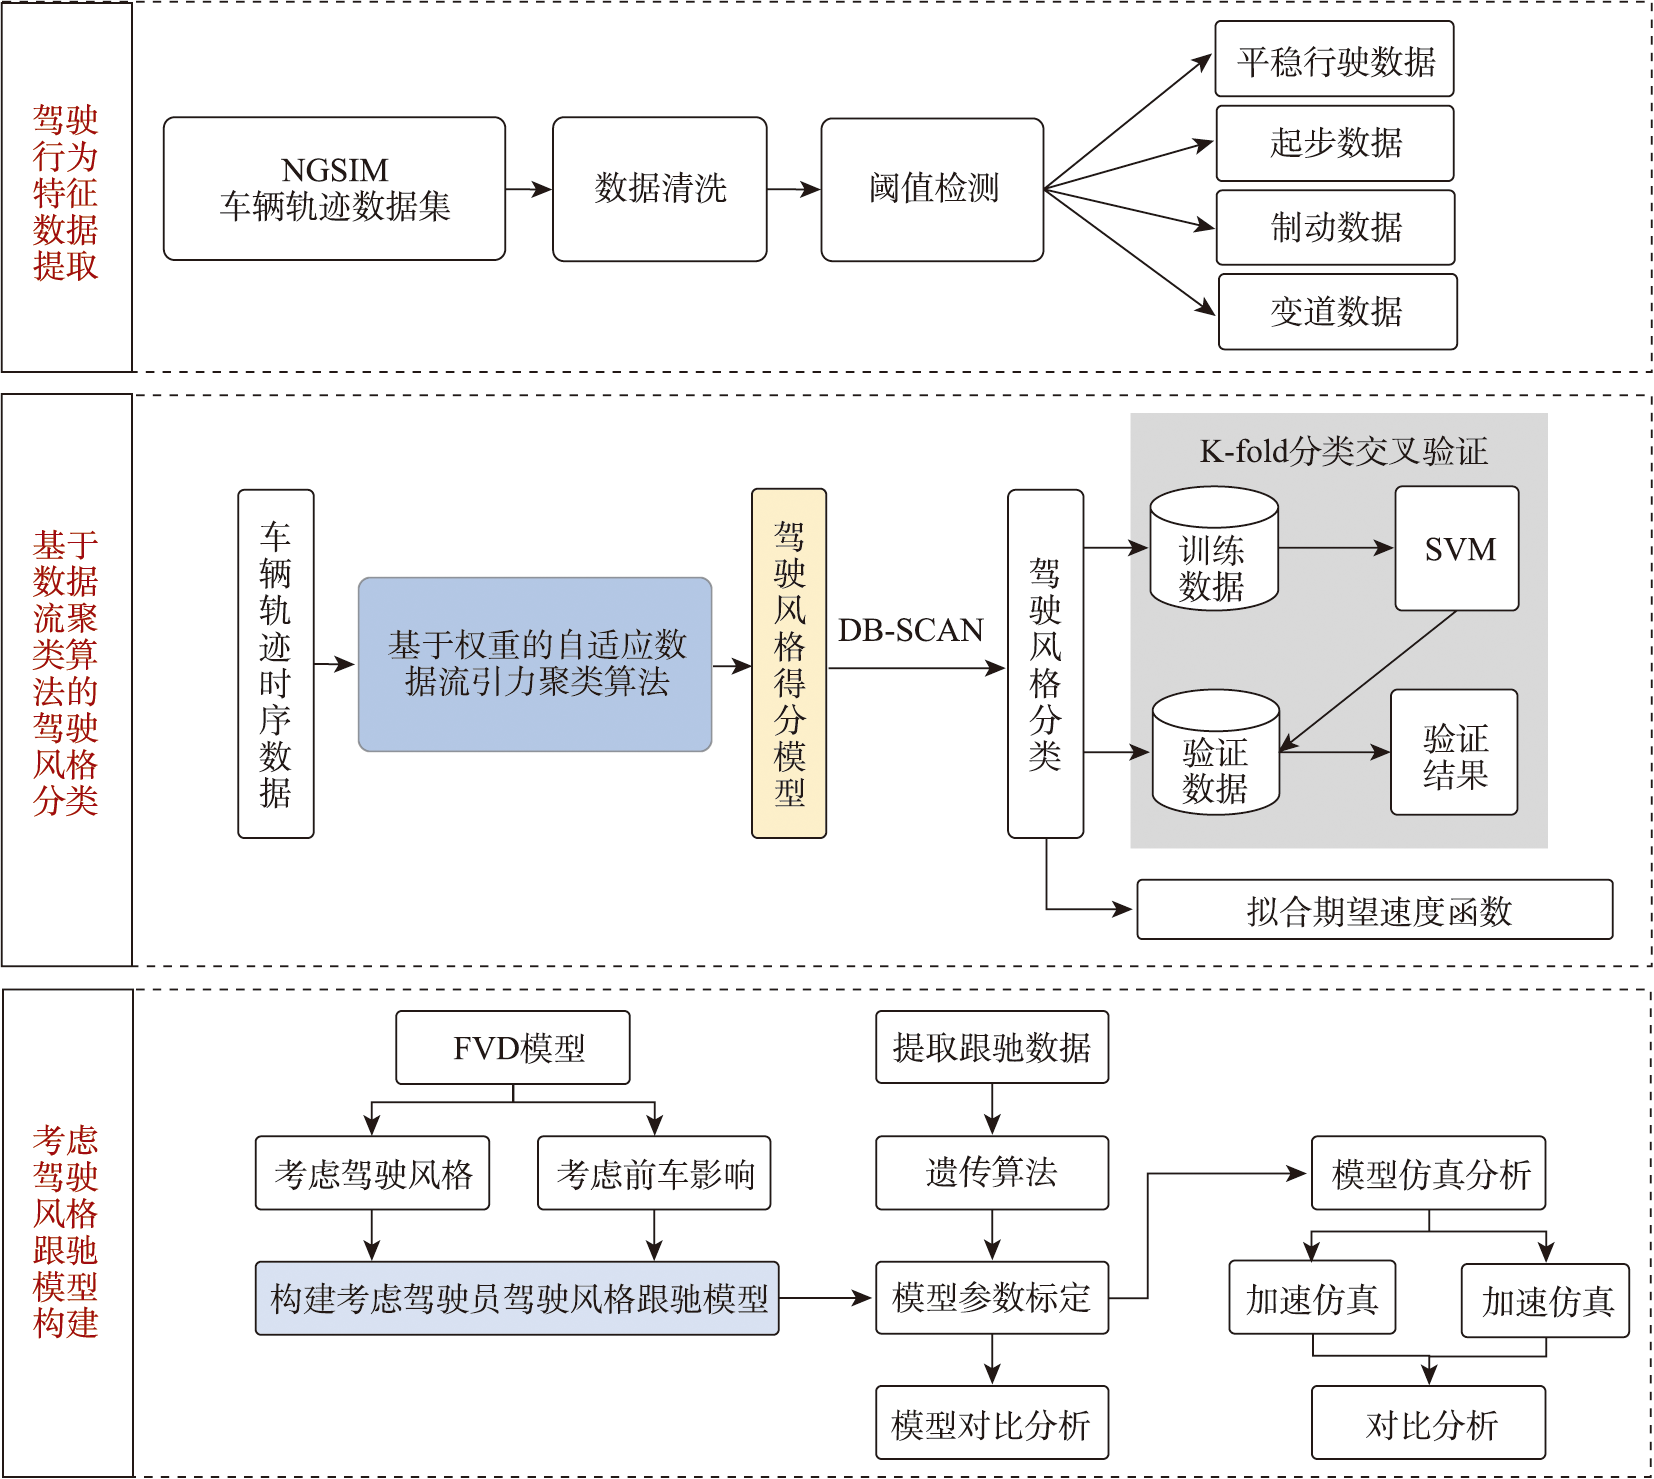
The research on car-following behavior aims to explore the impact of the leading vehicle's movement on the following vehicle's driving state on a one-way road. By establishing corresponding car-following models for simulation studies, it can reveal the underlying mechanism of traffic congestion, traffic flow oscillation, and other traffic phenomena, which is helpful for evaluating the stability, road capacity, and operational efficiency of traffic flow. Due to differences in driving experience, personality, and other characteristics, drivers may exhibit different car-following characteristics. Moreover, under the same conditions, the car-following behavior of different drivers may differ, and the car-following behavior of the same driver may also vary at different times. However, traditional car-following models often assume that drivers' driving behavior is homogeneous and rarely consider differences in driving styles among passing vehicles, which is inconsistent with actual situations. Therefore, this paper first extracts four driving behaviors of passing vehicles on the road (lane changing, starting, braking, and smooth driving), develops a Weight-based Adaptive Data Stream Gravity Clustering (WAStream) algorithm based on weights, and conducts clustering analysis on the time-series data of different driving behavior characteristics. Then, according to the driving style scoring model, the aggressiveness of different driving behaviors of drivers is quantified, the effective classification of driving styles of passing vehicles is achieved, and the overall driving behavior characteristics of different style driver groups are obtained. Next, by analyzing the car-following data of drivers with different styles, a speed expectation function for different style vehicles is constructed. Furthermore, the proposed car-following model considers the impact of speed and acceleration differences between the leading vehicle and multiple front vehicles in the driver's field of vision, which considers the driver's driving style. Finally, based on the NGSIM vehicle trajectory data, the key parameters of the car-following model considering the driver's driving style are calibrated using genetic algorithms, and the model's validation and numerical simulation analysis are achieved. The experimental results show that compared with the classical FVD model, the proposed car-following model can better fit the car-following data, and the MAE, MAPE, and RMSE are reduced by 1.511 m/s2, 6.122%, and 1.064 m/s2, respectively. At the same time, the model can effectively reduce the delay of vehicles in car-following behavior, construct traffic flow scenarios closer to reality, and improve the stability of traffic flow. The car-following model proposed in this study can provide effective decision-making information for transportation planning and management departments and provide model references for micro-traffic simulation studies.
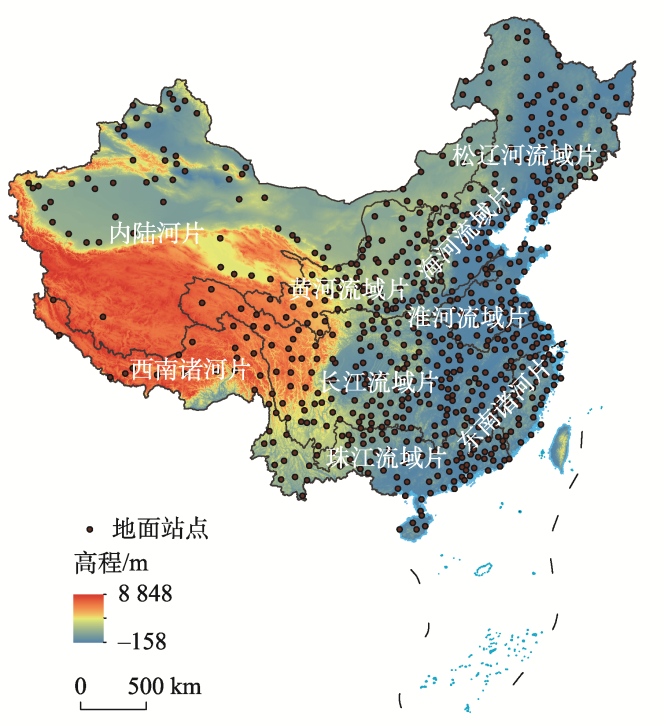
The Integrated Multi-satellitE Retrievals for GPM (IMERG) and Global Satellite Mapping of Precipitation (GSMaP) are two high-precision multi-satellite precipitation products. In order to evaluate the applicability of IMERG and GSMaP products (i.e., IMERG_Final and GSMaP_Gauge) for monitoring extreme precipitation events over the Mainland of China, six extreme precipitation indicators and commonly used statistical indexes were selected to quantify the performance of IMERG and GSMaP products by comparing with the gauged daily precipitation data obtained from the 698 meteorological stations in the mainland of China during 2015—2020. The results show that: (1) Both IMERG and GSMaP products can well reflect the spatial distribution characteristics of extreme precipitation indicators in the mainland of China and have better monitoring capability for extreme precipitation in low-altitude areas than that in high-altitude areas; (2) IMERG and GSMaP perform relatively higher accuracy in the Southeast Drainage Basin, the Haihe River Basin, and the Songhua and the Liaohe River Basin, while the accuracy in the Inland Drainage basins show relatively lower accuracy. Based on the result of error indicators, it is found that the accuracy of GSMaP is higher in the mainland area than the other areas; (3) The rate of rainfall detection in the southeast is higher than that in the northwest, while the accuracy is higher in the northwest. The rate of rainfall detection for low-threshold precipitation is higher, while the accuracy for high-threshold precipitation is higher. In addition, the capability of GSMaP in detecting weak precipitation is better than that of IMERG. Overall, IMERG and GSMaP have well monitoring capabilities for extreme precipitation in the mainland of China, which indicates the great prospect of their applications in extreme precipitation research.
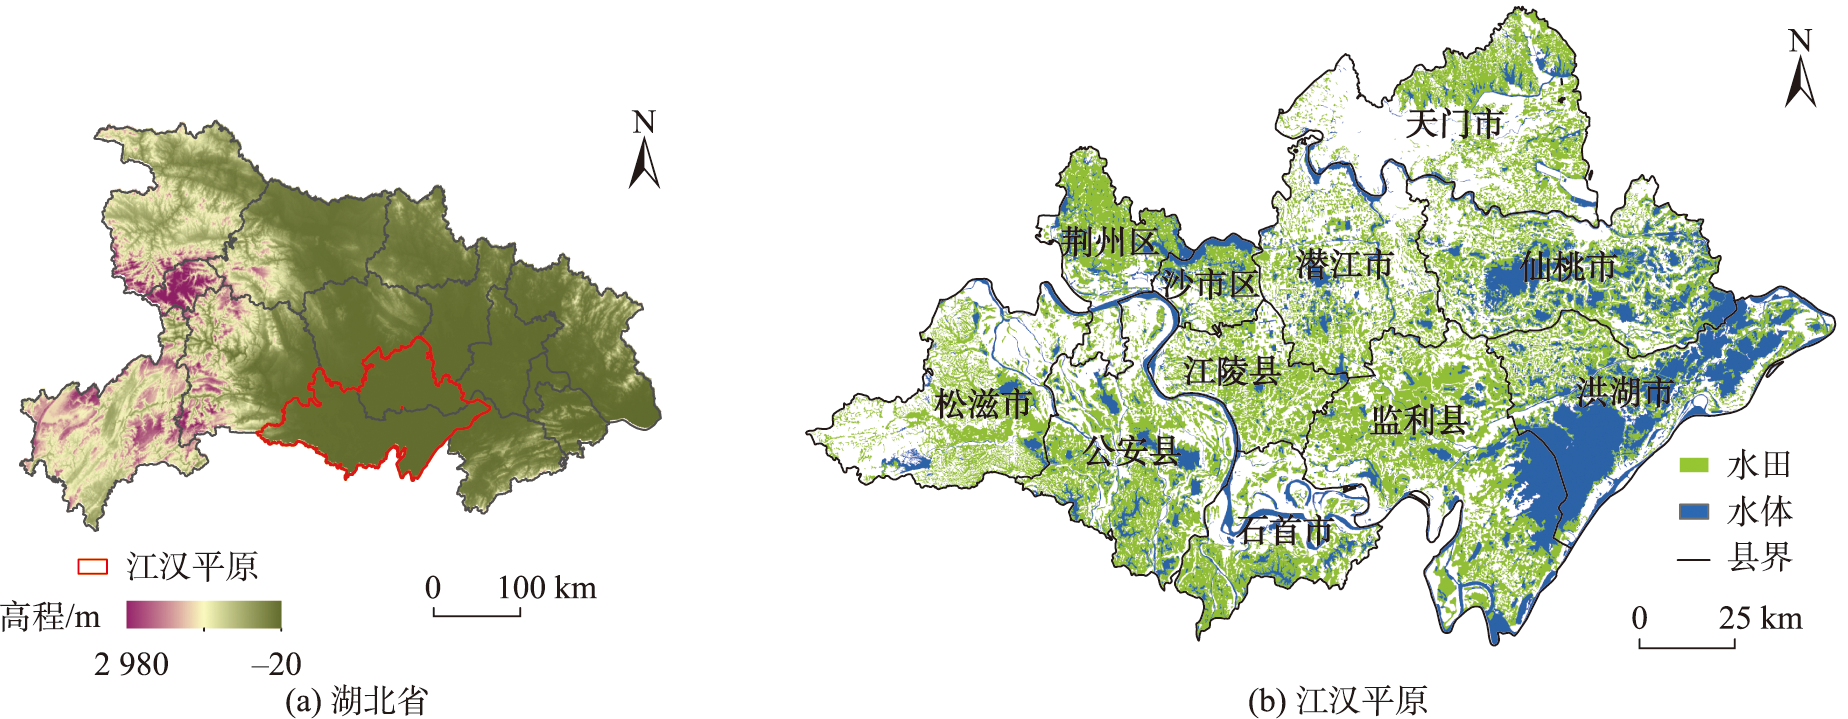
The spillover effect of a new agricultural technological innovation leads to its spatial diffusion with various characteristics, which affects the economic and social development of regional agriculture and farmers' welfare. Understanding spatiotemporal characteristics of technology diffusion is essential for obtaining basic information to manage this innovation in an effective way. Here, we investigated the diffusion pattern of the integrated rice-crawfish farming system, which is an emerging agricultural production in Jianghan Plain of China. Based on time-series Landsat images, we introduced CART classification algorithm and simple non-iterative clustering method to optimize the object-based water difference method and mapped the distribution of rice-crawfish farming from 2013 to 2019. We analyzed the characteristics of diffusion from aspects of area extent, spatial aggregation, and spatial interaction. We found that the rice-crawfish farming system showed a nonlinear expansion pattern from 2013 to 2019. It was expanded from a few hotspots to an extensive area in surrounding areas, with highest density distributed in the middle and southeast of Jianghan Plain. The spatial distribution of the adopted technology had characteristics of high aggregation at certain directions, with the core moving from the middle to southeast. Two motivative regions, Qianjiang and Jianli, respectively promoted the speed and extent of rice-crawfish technology diffusion at the early stage and late stage. Policy incentives, community effects, and industry chains effectively facilitated the adoption and diffusion of rice-crawfish farming system at both of individual level and regional level. Our study revealed the diffusion process and common characteristics of the new technology, which highlights the importance of information exchange and the radiation effect of the core area for technology adoption. The results not only provide essential data and knowledge for understanding the development condition and conducting relative research, but also give evidential references for decision-makers for efficient management of the technology at early diffusion stage.
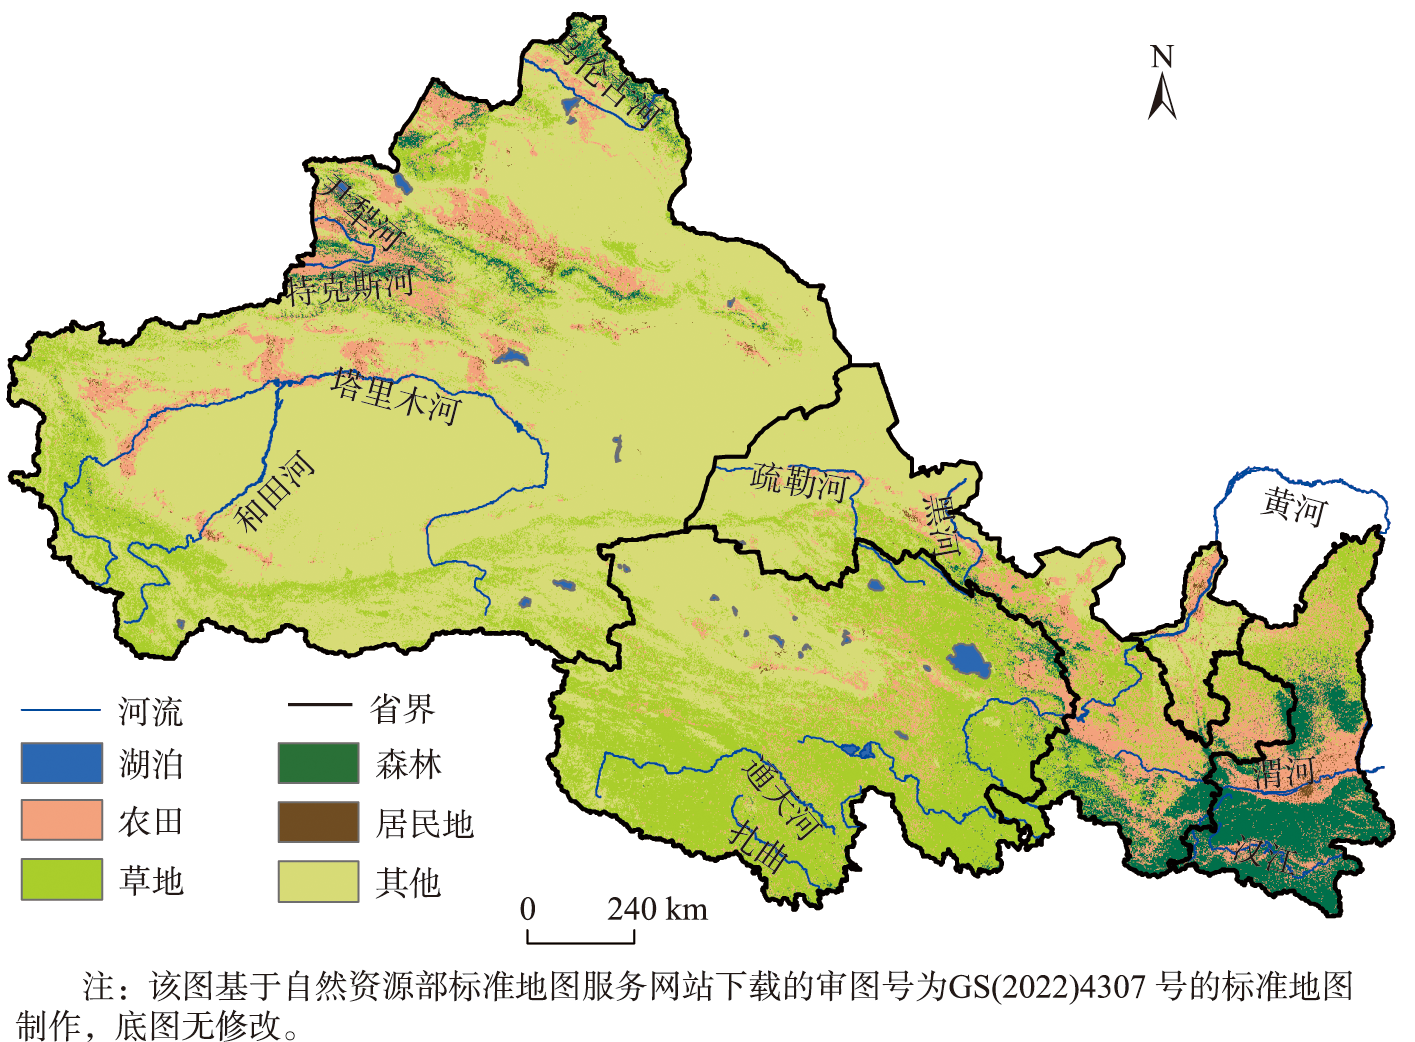
Freshwater is an essential landscape element in sustaining environment and socio-economic system in the Northwest China. Under the compounding impacts of climate change and human activities, the temporospatial patterns of freshwater in Northwest China (NWC) is undergoing substantial changes, which in turn is affecting socio-economic development and environment conservation in the region. This paper investigates the spatial and temporal patterns of freshwater in Northwest China in response to a changing climate based on a high-resolution global surface water dataset (JRC Monthly History v1.3) for the period 2000 to 2020. Seasonally, freshwater area within NWC is found increased rapidly from June to September, then dropped gradually from October with the reduction of available water. Interannually, the area of freshwater in NWC increased from 3.48×10⁴ km2 to 4.82×10⁴ km2 at a rate of 682.64 km2/a during 2000 to 2020. Spatially, the freshwater area expanded substantially along the Tarim River and in the western Qinghai Province. The expanding freshwater mainly occurs around perennial rivers or lakes such as the Tarim River, the Hotan River, Lake Taijinar, Lake Dabson and Qinghai Lake. Changes in freshwater area is found considerably affected by the changing climate in NWC. Based on the high-resolution climate reanalysis dataset (CMFD), it is found that the arid or semi-arid zone in the western NWC was experiencing a warm-wetting trend in climate, resulting notable expansion of freshwater. The increasing rate of freshwater area is the highest in the warm-wetting regions (with approximately 466.14 km2/a) followed by wetting regions. Joint distribution analysis of freshwater area and dominant climate factors shows freshwater area correlated positively to temperature and precipitation. The expansion of freshwater in Tarim River basin, northern Xinjiang and Qinghai province is more closely related to the increase in temperature and precipitation, with correlation coefficients greater than 0.4. The changes of freshwater area in NWC have contributed to strengthening the hydrological connectivity within the region, which could be conducive to regional environment conservation and socio-economic development.
Biomass burning is a significant source of smoke and greenhouse gas emissions, contributing to global climate change. Accurate and promptly identifying burned area is crucial for effective fire remediation, vegetation recovery, and estimation of atmospheric emissions. While medium to high spatial resolution satellite imagery, like Landsat-8, allows for mapping of small-scale and fragmented burn areas, data availability is limited by long revisit period and cloud cover constraints. Conversely, MODIS provides high temporal resolution, facilitating rapid generation of daily burned area products worldwide. However, it exhibits higher error of omission for small burn areas. To combine the strengths of MODIS' high temporal resolution and Landsat-8's high spatial resolution while addressing the challenges of extracting small and fragmented burn areas and reducing error of omission through continuous time series monitoring, this study proposes a burned area extraction algorithm based on a surface reflectance dataset supported by MODIS and Landsat-8 Operational Land Imager (OLI). Initially, the MODIS surface reflectance product (MOD09GA) is utilized to construct a priori surface reflectance dataset for the red, green, blue, near-infrared, and shortwave infrared bands before and after the burning dates. Subsequently, the Spatial and Temporal Adaptive Reflectance Fusion Model (STARFM) and linear fitting methods are employed to spatially and spectrally normalize the MODIS and Landsat-8 surface reflectance data. Finally, an automatic thresholding method is applied to determine the optimal threshold for delineating burned areas. Additionally, the algorithm's accuracy in extracting burned area is validated using four types of burn samples with varying sizes, achieving an extraction accuracy exceeding 75%. This study successfully combines the high temporal resolution of MODIS and the high spatial resolution of Landsat-8, addressing the limitations of using MODIS or Landsat-8 alone for extracting small and fragmented burn areas. It also validates the real-time extraction capability of the algorithm based on the surface reflectance dataset and enables near real-time observation of the burning process, providing visual insights into the fire's spread direction and the temporal expansion trend of burned areas. Furthermore, the effectiveness of the burned area extraction method supported by the surface reflectance dataset is validated by different sample types and scales. This research offers valuable insights for predicting and rescuing forest and grassland fires. Especially, for biomass burning characterized by small and scattered areas (such as straw burning), the algorithm still maintains a high level of identification accuracy.
Timely and accurate flood extraction can improve the ability of emergency management departments to respond to flood disasters and thus reduce the impact of disasters. Synthetic Aperture Radar (SAR) remote sensing is not affected by cloud and rain and acts as an effective tool for flood disaster monitoring. However, rapid and automated sample acquisition for accurately obtaining flood information still poses challenges in the post-disaster emergency stage. In addition, due to the satellite’s limited revisit period, flood extent extraction based on remote sensing images has a certain time gap. Therefore, how to delineate flood extent in real time is an urgent problem to be solved. In this paper, combining SAR images, Volunteered Geographic Information (VGI), and other multi-source data, an automated flood inundation mapping and estimation method is proposed to identify the flood in a nearly real-time way. Firstly, the Albert+CNN text classification model is constructed to extract flood information from social media. Secondly, based on the outlier elimination method, the Sentinel-1 SAR data are classified using VGI data such as social media and OSM instead of manual sampling, and the flood extent is extracted. Thirdly, in combination with social media, water level data, and other multi-source data, the flood inundation without SAR data is simulated based on SNIC segmentation and cost distance methods. The results show that the text classification model based on Albert+CNN model constructed in this paper can accurately classify the flood information of social media, with the classification accuracy up to 83.6%. The automatic sample generation method based on outlier elimination can effectively assist flood classification from SAR data. The accuracy of flood classification using the generated samples and random forest is 92.7%, which is more than 10% higher than that of the OSTU-based methods. Using VGI data and multi-source data such as water situation and DEM to simulate the flood extent can further increase the temporal resolution of flood monitoring. In this study area, two periods of flood simulation results are provided during the flood process, improving the flood disaster information. This study is helpful to improve the efficiency of flood information extraction and provide reference for VGI to support the emergency management of flood disasters. In the future, the picture information in VGI data can be comprehensively used to extract flood depth and hydrological models could also be used to further improve the flood situation awareness and prediction ability.
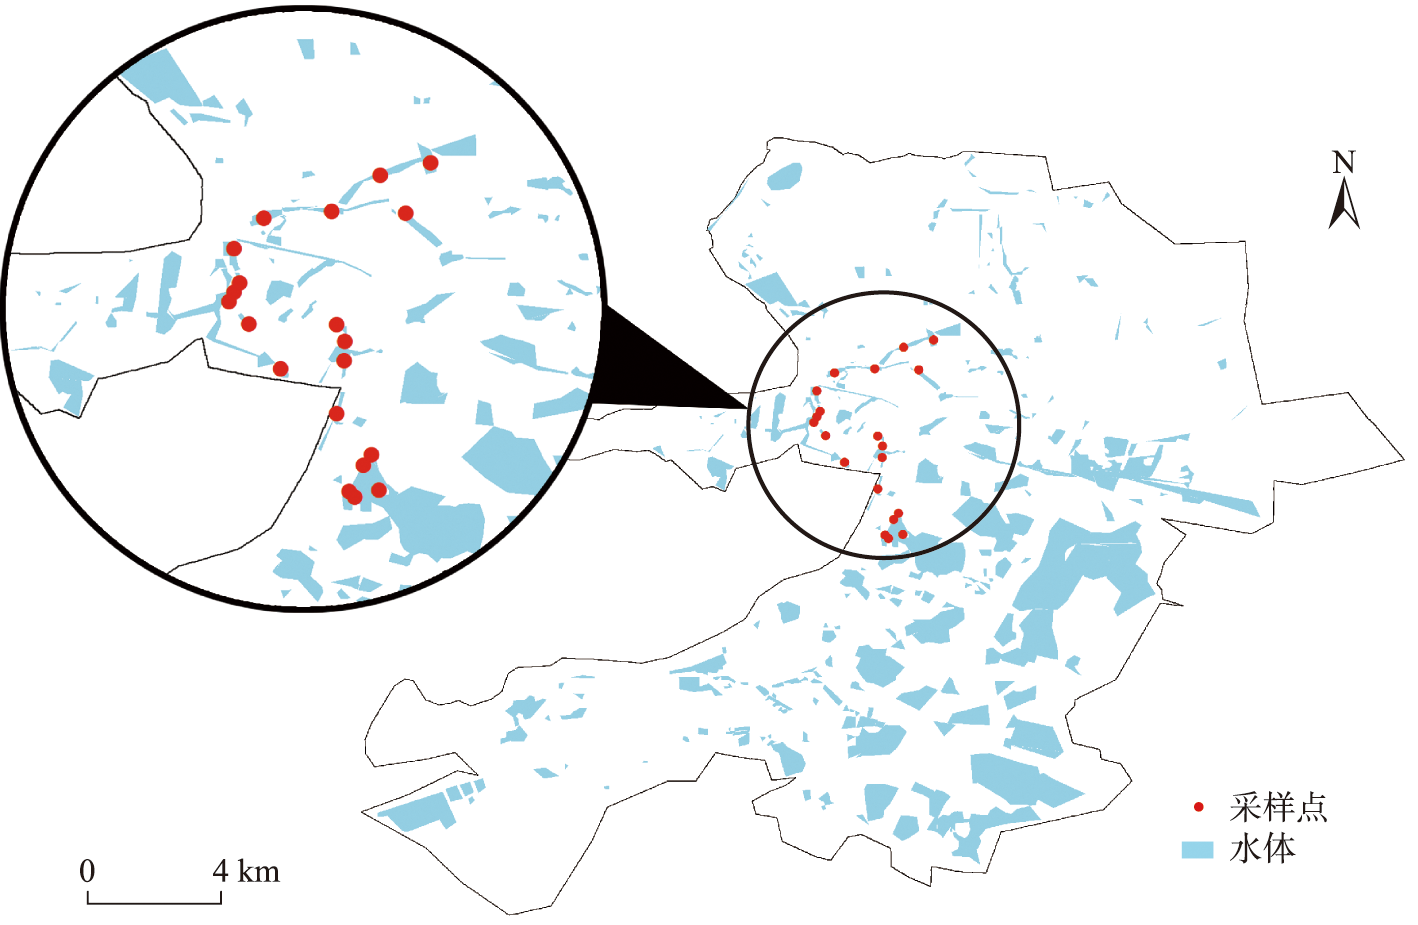
The concentration of Chlorophyll-a(Chl-a) has been the main indicator of eutrophication of inland waters and one of the important factors affecting the spectral characteristics of the reflectance of water. Monitoring the concentration of Chl-a in inland water bodies can provide valuable information for managing and mitigating the effects of eutrophication. In this study, hyperspectral data and water samples were collected from Baiyangdian Lake and villages in Baotou County, and water quality parameters such as Chl-a were determined in the laboratory, which were applied to Chl-a hyperspectral remote sensing inversion in Baiyangdian region. The stacked auto-encoder particle swarm optimization BP neural network model, the BP neural network model of hyperspectral data without dimensionality reduction, the BP neural network model of dimensionality reduction based on principal component analysis, and the BP neural network model of dimensionality reduction based on stepwise regression analysis were respectively established. To solve the problems of insufficient feature extraction ability of linear dimension reduction method and low learning efficiency and poor generalization ability of Chl-a hyperspectral remote sensing inversion model constructed by neural network, an inversion model of Chl-a concentration was proposed based on stacked auto-encoder particle swarm optimization BP neural network. This model used the powerful nonlinear transformation ability of stacked auto-encoder to learn the features of hyperspectral data by minimizing the reconstruction error. It achieved the dimensionality reduction of data while preserving the radiation information of the original spectral data to the greatest extent, and extracted the depth features of the measured water spectrum. The initial weight of BP neural network was taken as the position vector of the particle. Particle swarm optimization algorithm was used to search for the optimal initial weight of the network, reduce the probability of local extreme value, and improve the stability of the model and the accuracy of inversion. Compared to the BP neural network model without dimensionality reduction of hyperspectral data (R2=0.75, RMSE=3.16 μg/L, MAE=2.39 μg/L), the BP neural network model based on principal component analysis for dimensionality reduction (R2=0.79, RMSE=2.85 μg/L, MAE=2.29 μg/L), and the BP neural network model based on stepwise regression analysis for dimensionality reduction (R2=0.80, RMSE=2.79 μg/L, MAE=2.38 μg/L), the stacked auto-encoder particle swarm optimization BP neural network model (R2=0.82, RMSE=2.65 μg/L, MAE=1.89 μg/L) had higher accuracy in hyperspectral remote sensing inversion of Chl-a in inland water bodies. This study provides a theoretical basis and technical support for hyperspectral remote sensing inversion of Chl-a in inland Class II water bodies, helps with continuous monitoring of water quality in Baiyangdian Lake, and provides new ideas for future hyperspectral satellite remote sensing image inversion of Chl-a.
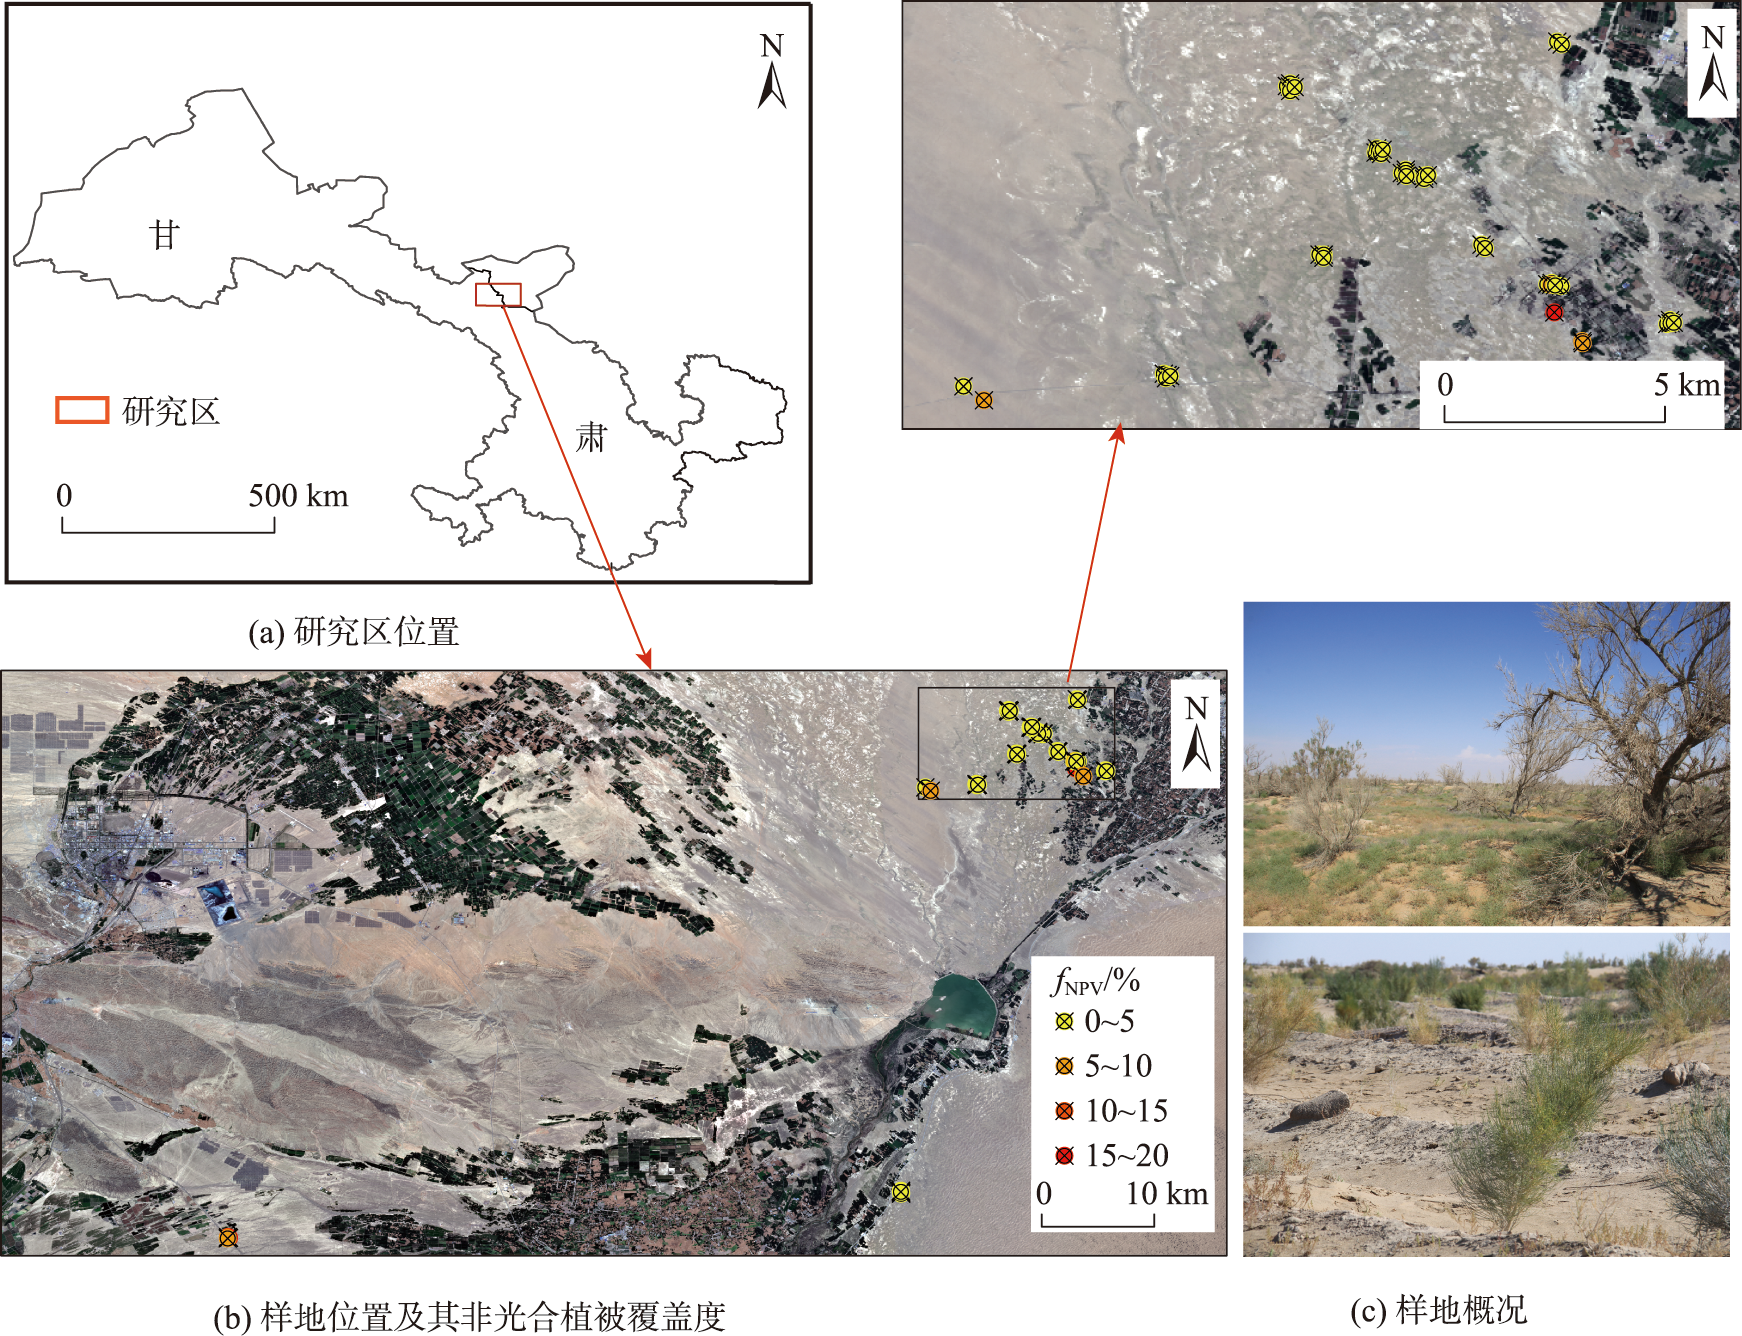
Non-photosynthetic Vegetation (NPV) is a key component in the ecosystem of arid and semi-arid regions and plays a vital role in the carbon cycle of vegetations. Obtaining the quantitative information of NPV is of great significance for scientific assessment of land desertification and scientific prevention and control of desertification. This study takes Minqin County, Gansu Province as the research area, analyzes the NPV and other end-component spectral information collected by the hyperspectral instrument in the research area, and constructs the vegetation index for extracting sparse NPV coverage based on Sentinel-2 MSI image. The measured NPV coverage is used as the verification data, and the coefficient of determination (R2), root mean square error, and significant p-value are used for model accuracy evaluation. The results show that: ① Based on the spectral analysis using the original spectral method, the first derivative transformation method, the reciprocal logarithm method, and the continuous elimination method, it is found that the envelope value of the NPV spectrum obtained by the continuous elimination method is significantly different from that of Photosynthetic Vegetation (PV) and Bare Soil (BS); ② After calculating the envelope difference of the green light band and the spectral reflectance ratio of the short wave infrared band, the difference between the NPV and PV and BS spectral eigenvalues can be effectively detected, in order to extract the NPV information and obtain a new index representing the NPV coverage information; ③ Through precision verification, it is found that the newly constructed NPV index-Envelope Difference Vegetation Index (EDVI) has the best correlation with the measured NPV coverage on the ground (R2=0.71, RMSE=0.0170, p<0.01), followed by the four-band red edge soil adjusted NDTI (S_NDTI4RE) (R2 is 0.57 with weight γ=0). While other NPVIs models have poor accuracy in estimating sparse NPV coverage. Our results indicate that the EDVI index model constructed in this paper can effectively achieve the rapid extraction and monitoring of NPV at large scale in arid and semi-arid regions through spectral feature analysis.
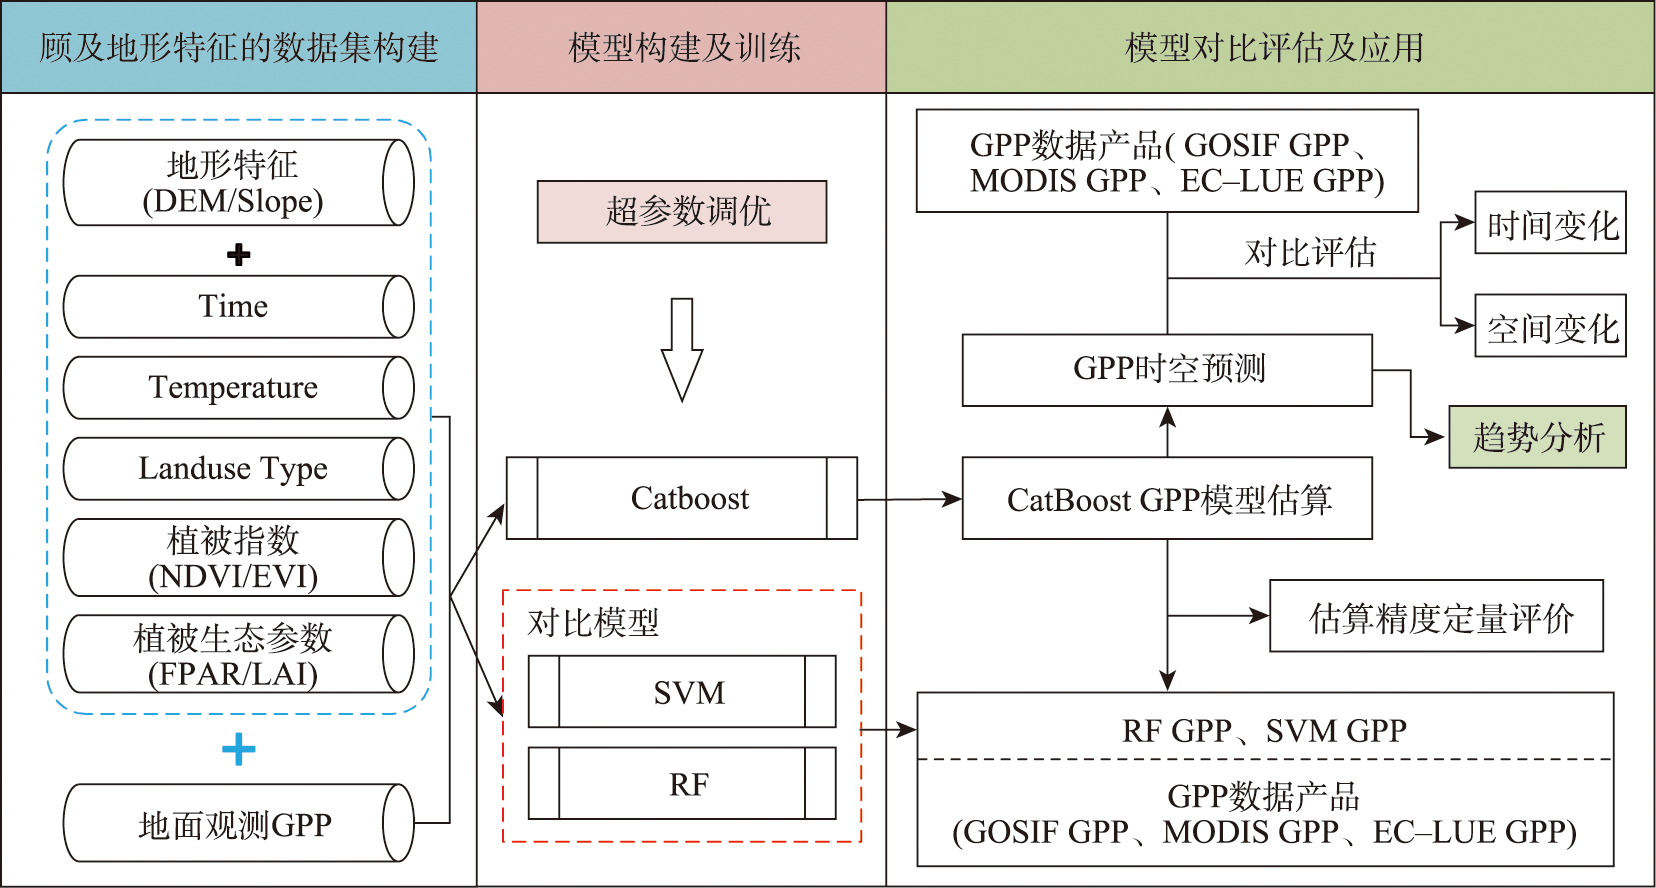
As an important indicator to measure the health of terrestrial ecosystems, the Gross Primary Productivity (GPP) of vegetation can directly reflect the improvement of regional environment. Therefore, accurate estimation of vegetation GPP changes is of great significance to regional sustainable development. In this paper, a GPP estimation model using the CatBoost algorithm integrating topographic data was developed. Using the vorticity flux observation data from China and Japan, this model was applied to simulate the long term GPP of Fujian Province where the topographic effect is significant. The results show that: (1) Terrain features are important parameters for the estimation of GPP using machine learning methods. The accuracy of GPP simulation results with terrain features included is significantly improved, and the Root Mean Square Error (RMSE) is decreased by 16%; (2) The GPP estimation model based on CatBoost has higher accuracy and stronger robustness and effectively reduces the overestimation and underestimation phenomena existing in traditional GPP estimation models and commonly used machine learning models (e.g., random forest and support vector machine). The coefficient of determination (R2) is 0.888, the RMSE is 1.164 gC·m-2·day-1, and the Mean Absolute Error (MAE) is 0.773 gC·m-2·day-1; (3) The multi-year GPP changes in Fujian Province simulated by the CatBoost GPP estimation model are highly consistent with the GOSIF GPP estimation results, indicating a more accurate GPP spatial distribution in Fujian Province. It is found that the mean GPP of Fujian Province from 2002 to 2020 was 1 697 gC·m-2·a-1. The overall spatial distribution is characterized by "decreasing from southeast to northwest", and the multi-year GPP variation shows a trend of "non-significant fluctuation increase". This study provides a new method and useful data for regional GPP estimation and ecological environment management.