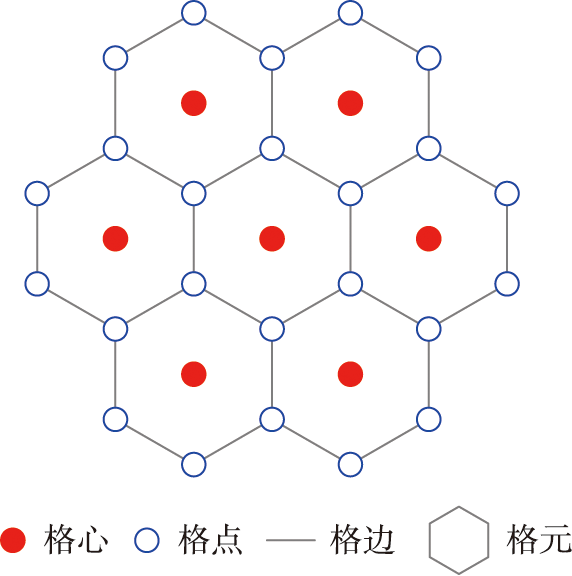
Grid is a data organization model for geographic environment digitization. Utilizing a grid model to model geographic environment is a basis for deducing, analyzing, and deciding important events from a global perspective. Traditional local projection-based grids have disadvantages including small range, limitation in gloal extrapolation, and large grid deformation. Most of existing new spherical grid models, namely Discrete Global Grid Systems (DGGS), only focus on the grid centers, ignoring roles of grid vertexs and edges. Therefore, the existing functions of DGGSs are limited to data modeling and are challenging in the caculation of location-based events. Herein, a unique description model for multi-structural elements (i.e. center, vertex, edge of a cell) of a hexagonal DGGS is established mathematically, and the coding and operation methods are designed accordingly. Then, geographic environment modeling with DGGS and route caculation experiments are designed to demonstrate the feasibility and superiority of our methods. The results show that the hexagonal DGGS proposed in this study has the advantages of small grid deformation and concentrated deformation distribution compared with the projection-based plane grids. The error rate of area, perimeter, and angle deformation of hexagonal grids is less than 7.5%, the error rate of area and perimeter deformation of Lambert Conformal Conic projection grids is more than 10% in mid and low latitude region, and the error rate of Mercator projection grids is more than 60% in high latitude region. Compared with the single cell model, multi structure elements can accurately express environmental information according to the event caculation requirements, which is more conducive to calculation of event results accurately. The methods proposed in this study have good application prospects in the field of geographic environment modeling and event caculation in a wide range and across the global scale.
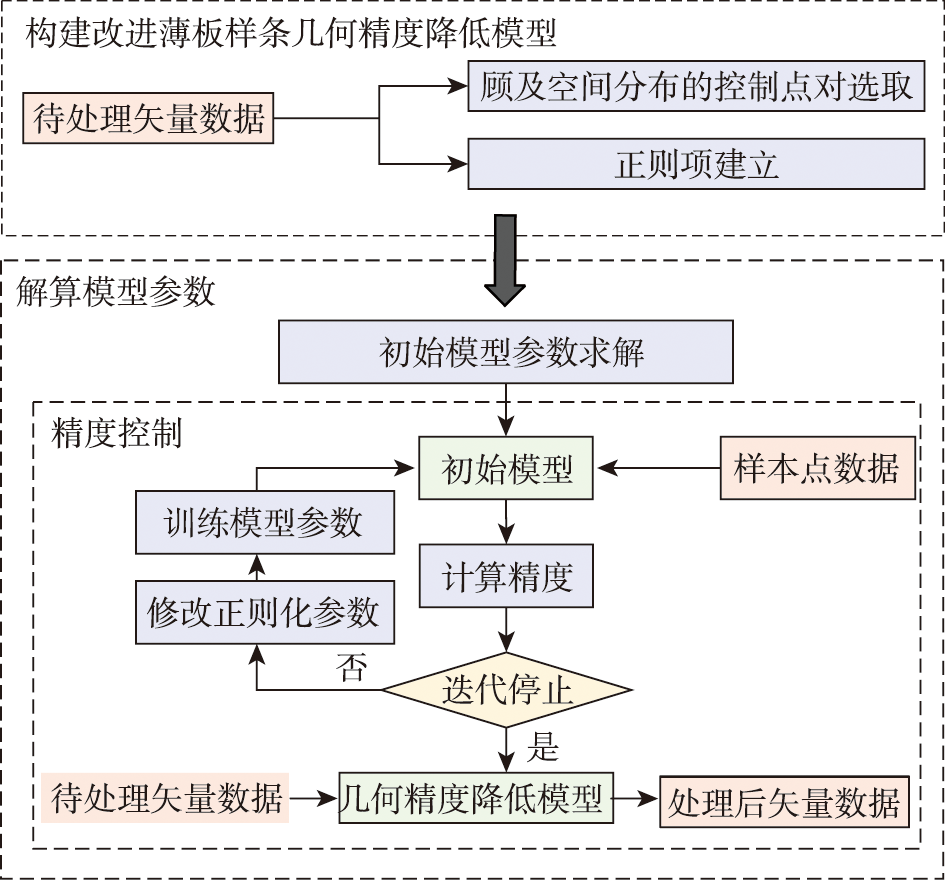
With the sharing and application of surveying and mapping geographic information data, the accuracy reduction of geographic data prior to data release has become an essential step to avoid leaks of classified high-precision data that could threaten national security. Geometric accuracy reduction is an important component of geographic data accuracy reduction, which refers to transforming the coordinates of element points and reducing the precision of the publicly available data. The traditional thin plate spline interpolation model can achieve coordinate transformation with its advantages. However, this model is easily influenced by the accuracy of control points and is not robust against noise. For example, if the control points are not selected reasonably, data morphological distortion easily occurs due to noisy control points, resulting in poor data quality. In this article, a vector data accuracy reduction method considering spatial distribution based on the improved thin plate spline model is proposed. Firstly, the grid is divided by quadtree index structure. The control points are selected in each grid, so that the selected control points are consistent with the original vector data in terms of spatial distribution and quantitative characteristics. Then, regularization terms are added to the traditional function based on Tikhonov regularization to weaken the constraint imposed by control points and enhance the anti-noise ability of the model. We choose vector geographic data with different scales and types and multi-layer vector geographic data for experiments. Results show that: (1) Based on different experimental data, our algorithm can meet the requirement that the procerssed data precision should not exceed 10 meters according to the No.95 official document from the Ministry of Natural Resources, which demonstrates the model adaptability and efficiency; (2) The algorithm can effectively improve model stability and reduce abrupt changes in coordinates. The experiment conducted on the line data of Gulou District in Nanjing shows that, the processed data exhibit a spatial directional consistency of 99.62% and a graphical morphological similarity of 99.99%, which outperforms the results based on traditional thin plate spline model and guassian radial basis function model; (3) The offset effect is locally consistent and globally random. The processed of the processed data after either direct attacking or blind attacking remains around 10 meters, indicating the difficulty of recovering processed data to original results. This research proves that the proposed model can balance data's security and availability, promoting social application of vector geographic data.
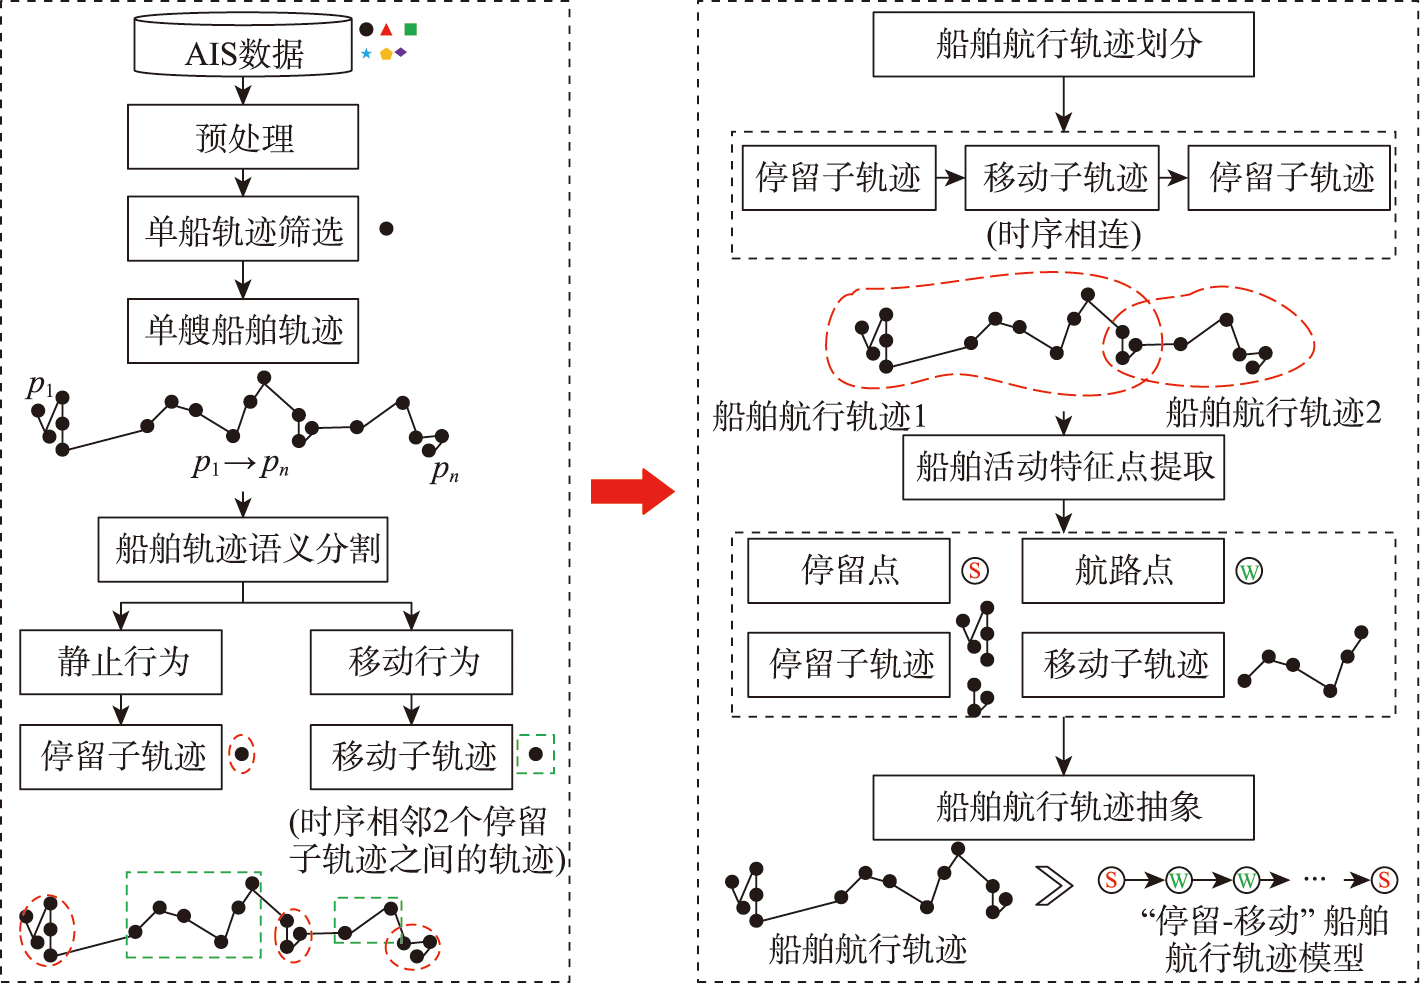
Extraction of ship routes and analysis of traffic flow are the basis of route design, maritime management, and trade analysis. Based on the massive ship trajectory data, existing ship route extraction methods still have limitations in terms of adaptability to large sea areas, model complexity, and consistency with real maritime traffic routes. In this study, we propose a ship trajectory extraction model and traffic flow analysis based on massive ship Automatic Identification System (AIS) data. Firstly, the ship's navigation trajectory is abstracted as the combination of a ship's stay points (stop points) and movement points (waypoints). Stop points represent the characteristic of a ship's stop trajectory at the port, and the waypoint represents the ship's moving trajectory characteristic, e.g., the sailing speed or sailing angle changes significantly. The navigation trajectory abstraction model denoted as "departure port (stop point)→movement (waypoint)→destination port (stop point)" of a ship is constructed, enabling the division of ship navigation trajectory. Secondly, based on the abstract model of ship navigation trajectory, further clustering of stop points and waypoints of the massive ship navigation trajectory based on graph theory is implemented to extract route points (stop points and waypoints) of ships. Finally, a route point connection matrix is established to realize ship route extraction in the form of ship traffic map, which provides a new method for ship route extraction and traffic flow analysis. Taking the Silk Road area in the South China Sea as the study area, the historical AIS data for the entire year of 2017 are used to analyze the traffic flow characteristics and ship routes of typical merchant ships (i.e., container ships, bulk carriers, and oil tankers). The results show that the extracted ship routes are highly consistent with the maritime traffic in high-density areas and can reflect the real maritime traffic routes. Compared with the existing shipping route data, the details of extracted routes are enriched, and the structure is more comprehensive. In addition, compared with the existing shipping route extraction methods, the proposed method has two following advantages. First, the shipping routes extracted by the proposed method have greater richness. The proposed method not only extracts the shipping routes but also identifies the characteristic points during ship navigation, i.e., the stopping points and the waypoints of the ship route, which provides important knowledge support for route design and navigation safety. Second, the extracted routes can be easily applied to analyze the maritime traffic network. Since the extracted routes are in the form of point-to-point starting from the port, it is easy to construct a maritime traffic network, allowing for potential transportation network analysis. This study contributes decision-making support for ship route planning, traffic flow analysis, navigation safety, etc.
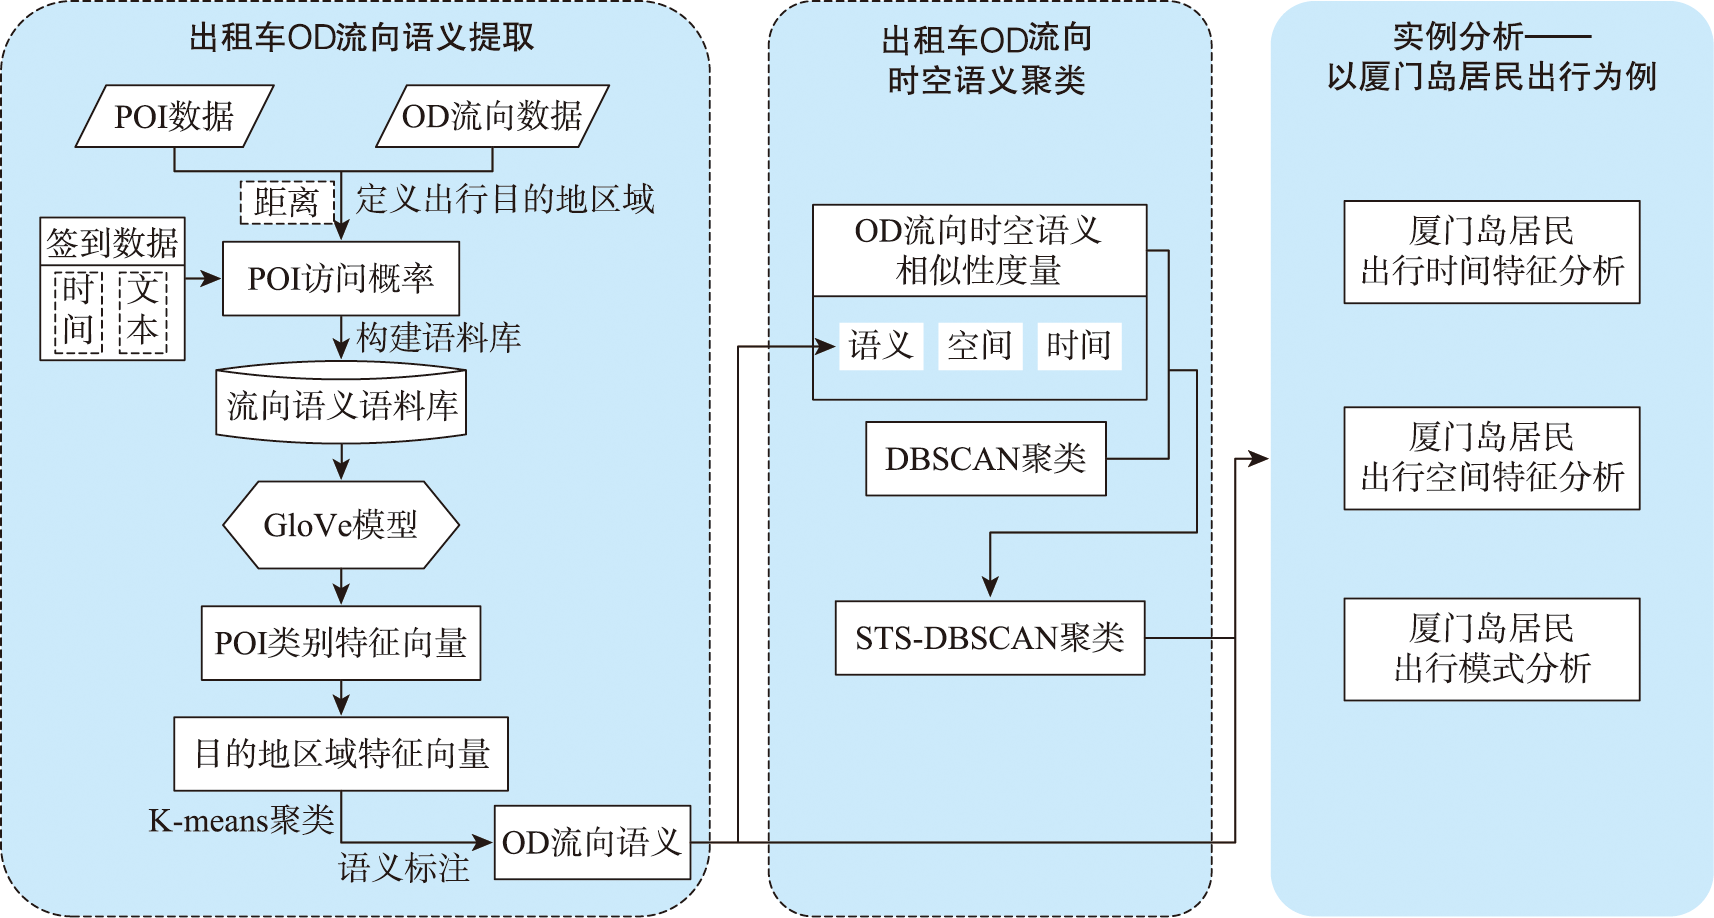
While rapid urbanization endows people with a modern life, it also brings many urban diseases such as traffic congestion and uneven distribution of resources. Taxi is one of the main transportation methods for urban residents. Taxi data effectively record the spatial and temporal information of residents' travel and can be widely used for residents' travel characteristics mining. Analyzing residents' travel characteristics is an important way to solve and alleviate the increasingly prominent urban problems. At present, rich research results have been achieved in mining residents' travel characteristics using taxi OD flow data. Cluster analysis, which is based on taxi OD flow data, represents one of the primary methods for uncovering the travel characteristics of residents. But most of the studies ignore the semantic information of OD flow. Urban POI data is an important data support for semantic extraction of OD flow, and semantic information can be extracted by studying the relationship between OD flow and POI. To address the problem of insufficient consideration of semantic information in spatiotemporal clustering algorithms, a method for extracting semantics of OD flow based on Global Vectors (GloVe) model and density based spatiotemporal semantic clustering algorithm (STS DBSC AN, Spatial Temporal Semantic DBSCAN) is proposed in this paper. Firstly, OD flow semantics are extracted by combining POI visiting probability and GloVe model, the GloVe model not only fully considers the local geographic context information of POIs, but also takes into account its global statistical information in the corpus. Based on this, a spatiotemporal semantic similarity measurement rule for OD flow is proposed, which comprehensively considers temporal, spatial, and semantic information. Then, the DBSCAN clustering algorithm is improved according to the spatiotemporal semantic similarity measurement rule, and the spatiotemporal semantic clustering of OD flow data is realized. Finally, analysis of travel characteristics of residents in Xiamen island based on OD flow semantics and spatiotemporal semantic clustering, and a total of seven types of residents' travel semantics are extracted. Results show that: 1) Residents' travel semantics are influenced by the time factor, and the main residents’ travel semantics are different in different time periods; 2) residents' travel hotspots are mainly distributed in the central developed area of Xiamen Island; 3) seven typical residents' travel patterns are extracted from four main residents' travel semantics through spatiotemporal semantic clustering analysis. The results demonstrate that OD flow semantic and the spatiotemporal semantic clustering method can effectively mine the travel characteristics of urban residents.
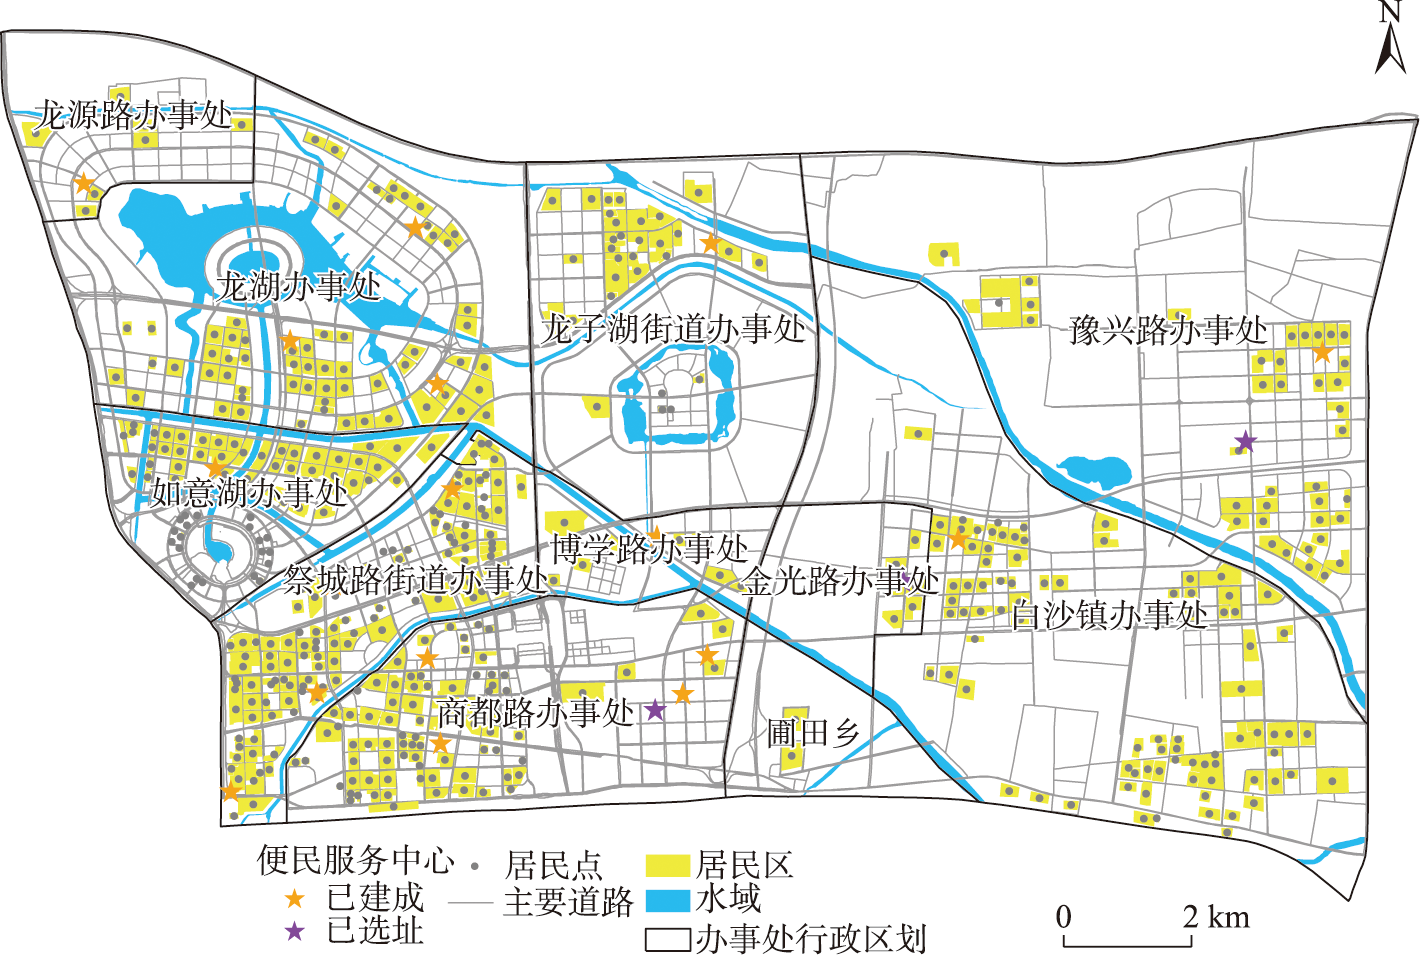
The 15-minute community-life circle is defined as an ideal geographical setup where most human needs are located within a 15-minutes travel distance. This concept represents a new trend for green, low-carbon, and sustainable urban development. However, there are challenges in building 15-minutes community life circles effectively, efficiently, and equality, such as how many service facilities are required, where to locate the facilities, and how to promote service efficiency and equality for urban residents. In this paper, a novel facility location model, DC-CFLP, is proposed for facility site selection within the 15-minute community-life circle and addressing the aforementioned facility planning challenges. First, we use a maximum service radius, a recommended service radius, a minimum percentage of demand covered by facilities within the recommended service radius, and an optional maximum number of facilities to extend the single-source facility location problem (SSCFLP). Second, the constraints on the facility capacity, such as maximum service radius and minimum percentage, are formulated as soft constraints, which are addressed through penalties in the objective function. The proposed model is tested in Zhengdong New District, Zhengzhou, China. Based on the geographic condition of the region and its detailed urban planning maps for the year of 2035, three different scenarios are designed for locating the community convenience service centers, each with three sets of planning parameters. In this case study, we solve nine model instances using a metaheuristic algorithm. The planning results show that our proposed model can efficiently select facility locations that satisfy planning criteria, including balancing service demand and supply, minimizing cost service and travel costs, achieving a minimum percentage of demand covered by facilities within the recommended service radius, and reducing spatial inequality of service, while considering service cost, accessibility, and equity. Based on the model results, several planning recommendations are provided for the study area. Moreover, to demonstrate the superiority of the proposed model, we conduct comparison experiments with the SSCFLP, the Capacitated P-Median Problem (CPMP), and the DC-CFLP. These experiments show that the facility location selection using SSCFLP is the most efficient, the CPMP results are largely dependent on the number of facilities, and the DC-CFLP results archive a better balance between service quality, cost, and equality. In conclusion, our study demonstrates that our proposed model is a planning-parameter-driven, efficiency-equality balanced model, and highly flexible for the site selection of public facilities.
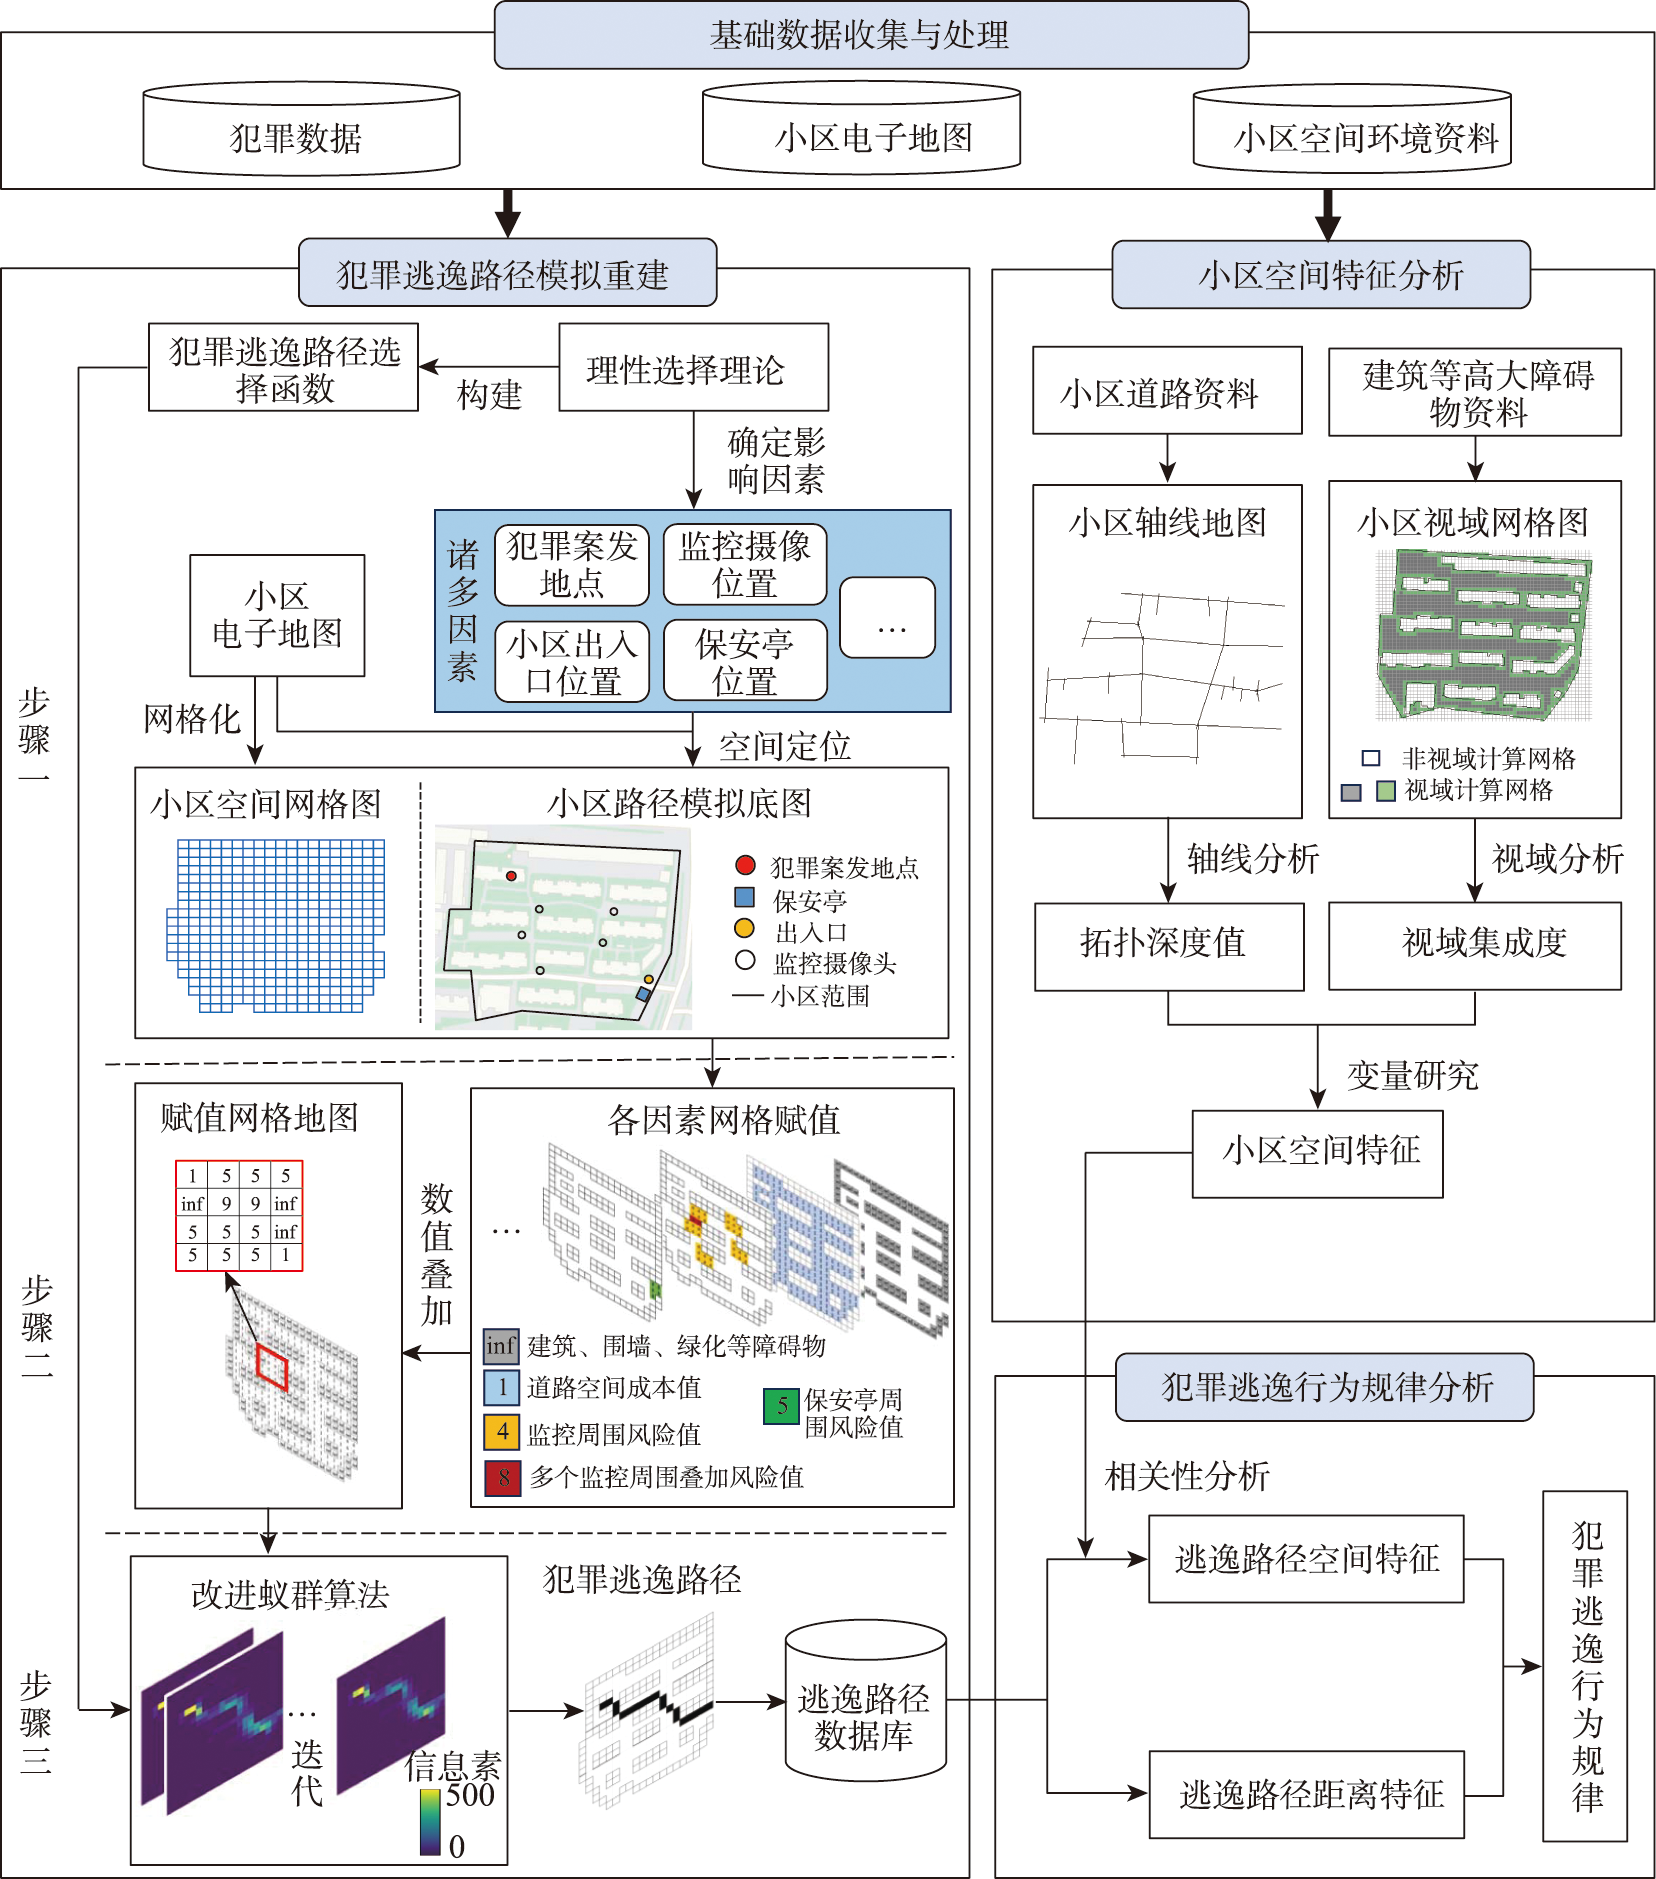
Studying the journey-to-crime contributes to a better understanding of the mechanisms behind crime occurrence. However, existing research has primarily focused on pre-crime travel behavior, lacking sufficient investigation into post-crime travel, specifically criminal escape behavior. This paper focuses on the escape behavior of criminals in closed non-gated communities and proposes a research methodology that combines micro-level path simulation with macro-level spatial analysis to study criminal escape behavior. The method begins by addressing the problem of limited research data through the simulation-based reconstruction of criminal escape paths. Specifically, it involves constructing an escape path selection function based on rational choice theory, quantifying the spatial environment of the community using an assignment grid map, and iteratively simulating path data using an improved ant colony algorithm on the assignment grid map. Next, the method employs spatial syntax theory to deconstruct the spatial characteristics of the community in terms of topological depth and visual integration. Finally, by integrating the criminal escape path data with the spatial characteristics of the community, the spatial logic of criminal escape behavior is explored. The study conducted an empirical research focusing on night theft cases committed by outsiders in five typical communities in Z city, and the results show that: (1) Criminals' escape distances displayed a clear distance decay characteristic, and it also shows the decay effect at both ends; (2) The unique built environment and spatial structure of the community significantly affect the criminal behavior. Communities with too many entrances and exits tend to have shorter escape distances for criminals; (3)Criminals will avoid places with high visual integration and look for more concealed spaces to escape; (4) Criminal escape behaviors conform to the rules of space topology, that is, they will choose spaces with small topological depths to escape and follow the descending path of topological depths escape. The research findings provide a reference for the planning and construction transformation of communities. For example, communities should: emphasize the layout of entrances and exits, providing convenience for residents while minimizing the number of entry and exit points; strengthen the management of areas with a moderate distance from entrances and exits, and allocate more crime prevention and control resources in this area, such as increasing security patrols; integrate landscape design with community safety considerations, such as limiting the planting of shrubs that may obstruct pedestrians' sightlines, thus increasing the visual integration of community space.
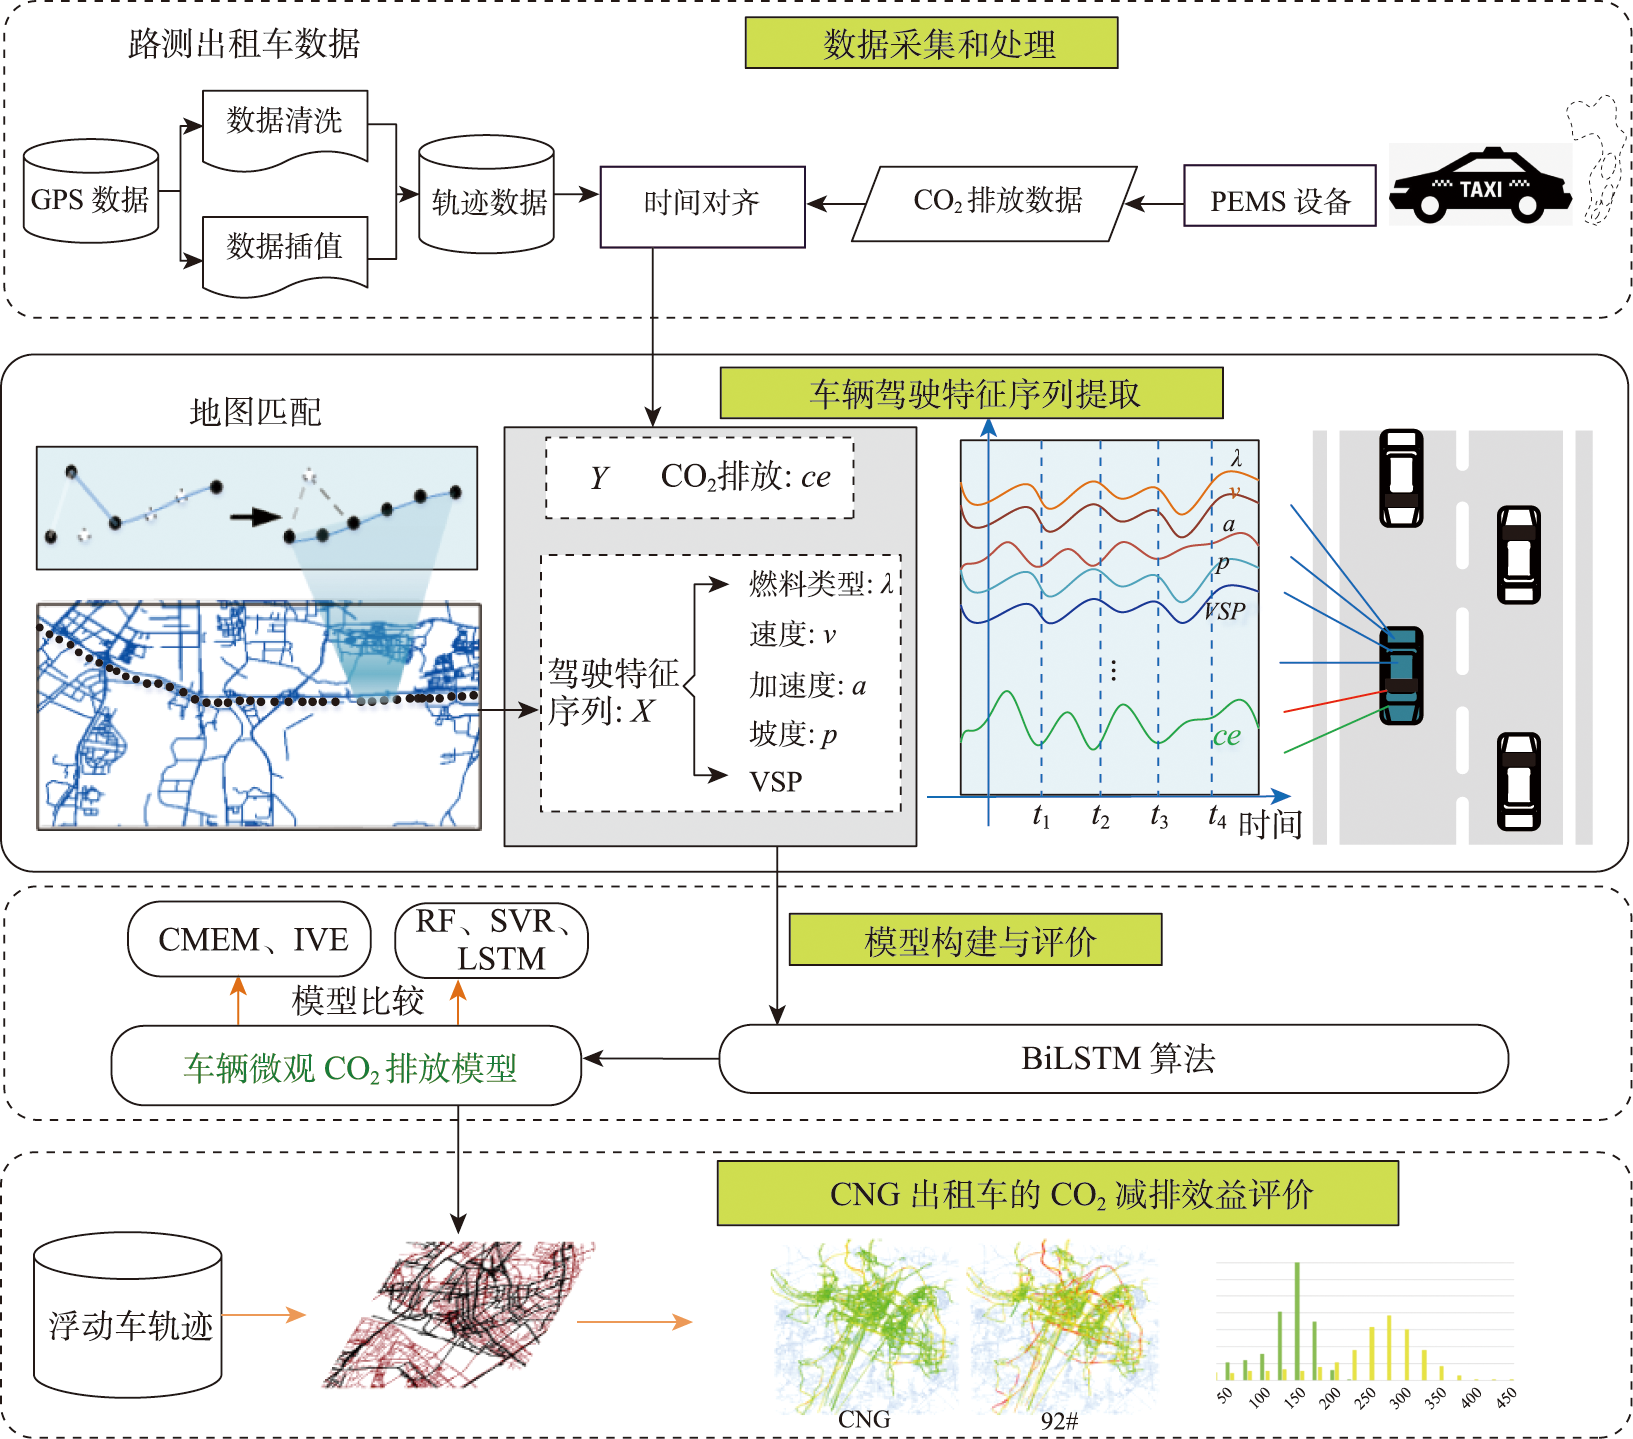
Many large cities have been actively promoting the policy of "replacing oil with gas" for taxis. Taxis are converted from traditional gasoline consumption to Compressed Natural Gas (CNG) to achieve energy conservation and emission reduction goals. To accurately evaluate the carbon dioxide (CO2) emission reduction benefits of CNG taxis, taking Wuhan as an example, a vehicle microscopic CO2 emission model based on deep learning method and trajectory data was proposed to investigate the spatial-temporal characteristics of CO2 emissions of taxis under different fuel scenarios. Considering the driving feature sequence and fuel type of vehicles, the Portable Emission Measurement System (PEMS) was used to collect vehicle CO2 emission data in the road test experiment, then we constructed a vehicle microscopic CO2 emission model by the BiLSTM algorithm and further verified its accuracy. Based on the proposed CO2 emission model and the trajectory data of 15 752 Wuhan taxis, the CO2 emissions throughout the entire lifecycle of urban taxis by 92# gasoline and CNG were estimated respectively to quantify the CO2 emission reduction benefits of CNG taxis. The results show that the proposed model had a higher accuracy than common regression algorithms such as SVR and LSTM, and the predictions matched well with real vehicle CO2 emission changes, meeting the accuracy for a large-scale estimation of urban taxi CO2 emissions. In addition, the accuracy of taxi CO2 emission estimation based on deep learning methods was also higher than that of physical microscopic models such as IVE and CMEM. Especially, when using CNG as vehicle fuel, the physical models had significant computational errors due to not involving technical parameters. The empirical results show that, taxi CO2 emissions using CNG were reduced by 22.05% during the PTW process and by 49.45% during the WTP process, compared to emissions using 92 # gasoline. Our results reveal both the temporal and spatial patterns of taxi CO2 emission as well as the CO2 emission reduction benefits of CNG taxis. The outperformance of deep learning methods over other methods for estimating vehicle CO2 emissions provides new ideas for large-scale and high-precision estimation of vehicle emissions. The CO2 emission reduction benefits of using CNG as fuel in taxis are significant, which provides a reference for the government to formulate relevant energy-saving and CO2 emission reduction policies.
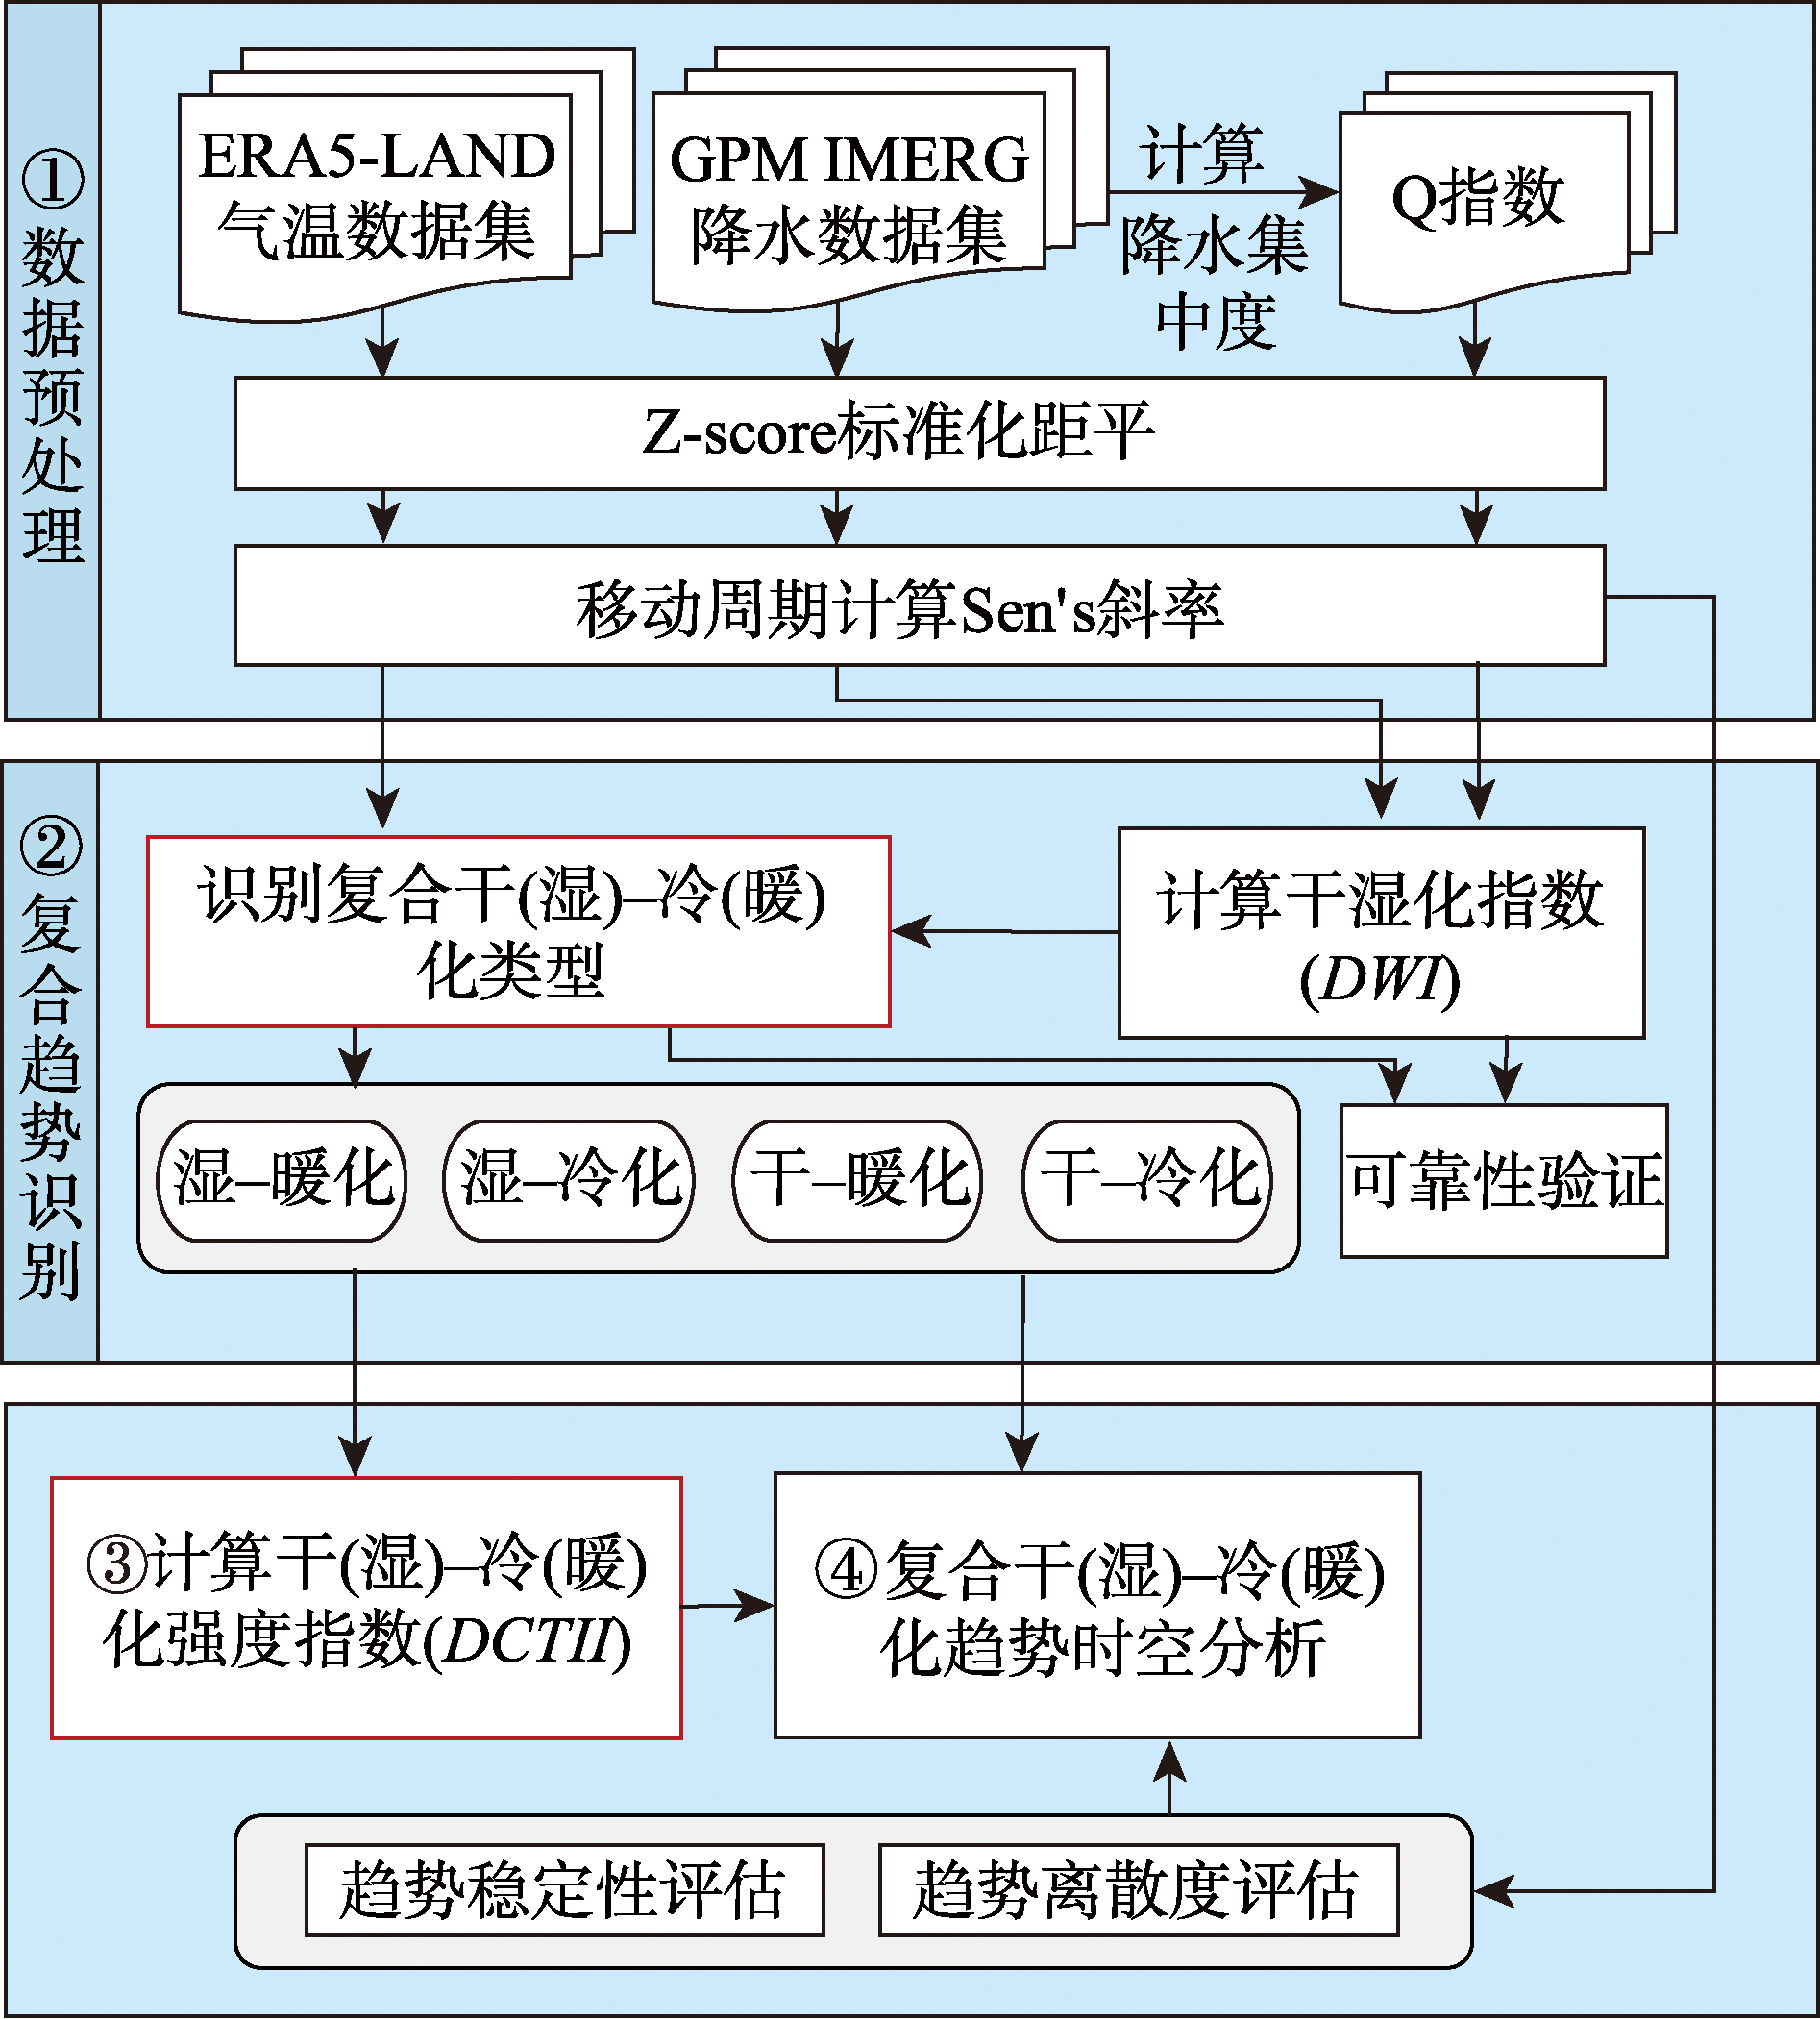
Climate change has been one of the most important environmental concerns in the 21st century. Temperature and precipitation are two of the most important variables for evaluating the magnitude and pattern of climate change. Assessing changes in long-term temperature and precipitation trends has important implication for understanding the underlying mechanisms of climate change and developing effective strategies to mitigate its impacts. In this study, we propose a method to identify and quantify compound Dry(wet)-Cool(warm) Trends (DCT) of climate, which include drying-cooling, wetting-cooling, drying-warming, and wetting-warming trends. We use long-term Global Precipitation Measurement (GPM) precipitation data and Fifth Generation European Reanalysis (ERA5-Land) temperature data to test this method. We also create a compound Dry(wet)-Cool(warm) Trend Intensity Index (DCTII) to quantitatively evaluate the magnitude of change in compound trends, which provides a useful tool for analyzing the strength and direction of trends in compound dry(wet)-cool(warm) trends over time. To test the effectiveness of this method, we apply it to analyze the temporal and spatial characteristics of compound trends in the Huang-Huai-Hai Plain, one of the most important agricultural regions in China, from 2001 to 2021. Our results show that: (1) the compound dry(wet)-cool(warm) identification and quantification method not only considers the change pattern and magnitude of dry-wet and cold-warm structures but also integrates the distribution characteristics of precipitation over time. The validation results show a reliability of 85%; (2) temporally, the Huang-Huai-Hai Plain gradually shifted from drying-cooling to wetting-warming from 2007 to 2018, and the wetting-warming trend has been increasing in recent years; (3) spatially, the long-term trend in the Huang-Huai-Hai Plain over the past 20 years was dominated by wetting-warming and drying-warming trends, with most of the areas experiencing wetting-warming trends, mainly distributed in the north of the Yellow River and the southernmost area of the plain; (4) the DCTII combined with trend stability and dispersion evaluation show that the strong trend in the Huang-Huai-Hai Plain is mainly located in the eastern and coastal areas. Among the three basins, the Yellow River Basin has the strongest trend; the intensity of the wetting-warming trend in the Haihe River Basin is higher than that of the drying-warming trend; and the trend stability in the Huaihe River Basin is more significant. Overall, our study highlights the importance of considering both temperature and precipitation in the analysis of climate change. The method we propose offers a useful framework for understanding long-term changes in dry-wet/cold-warm structures under the context of global warming. The findings provide valuable insights into the impact of climate change on the Huang-Huai-Hai Plain, which could help inform future climate change adaptation and mitigation strategies.
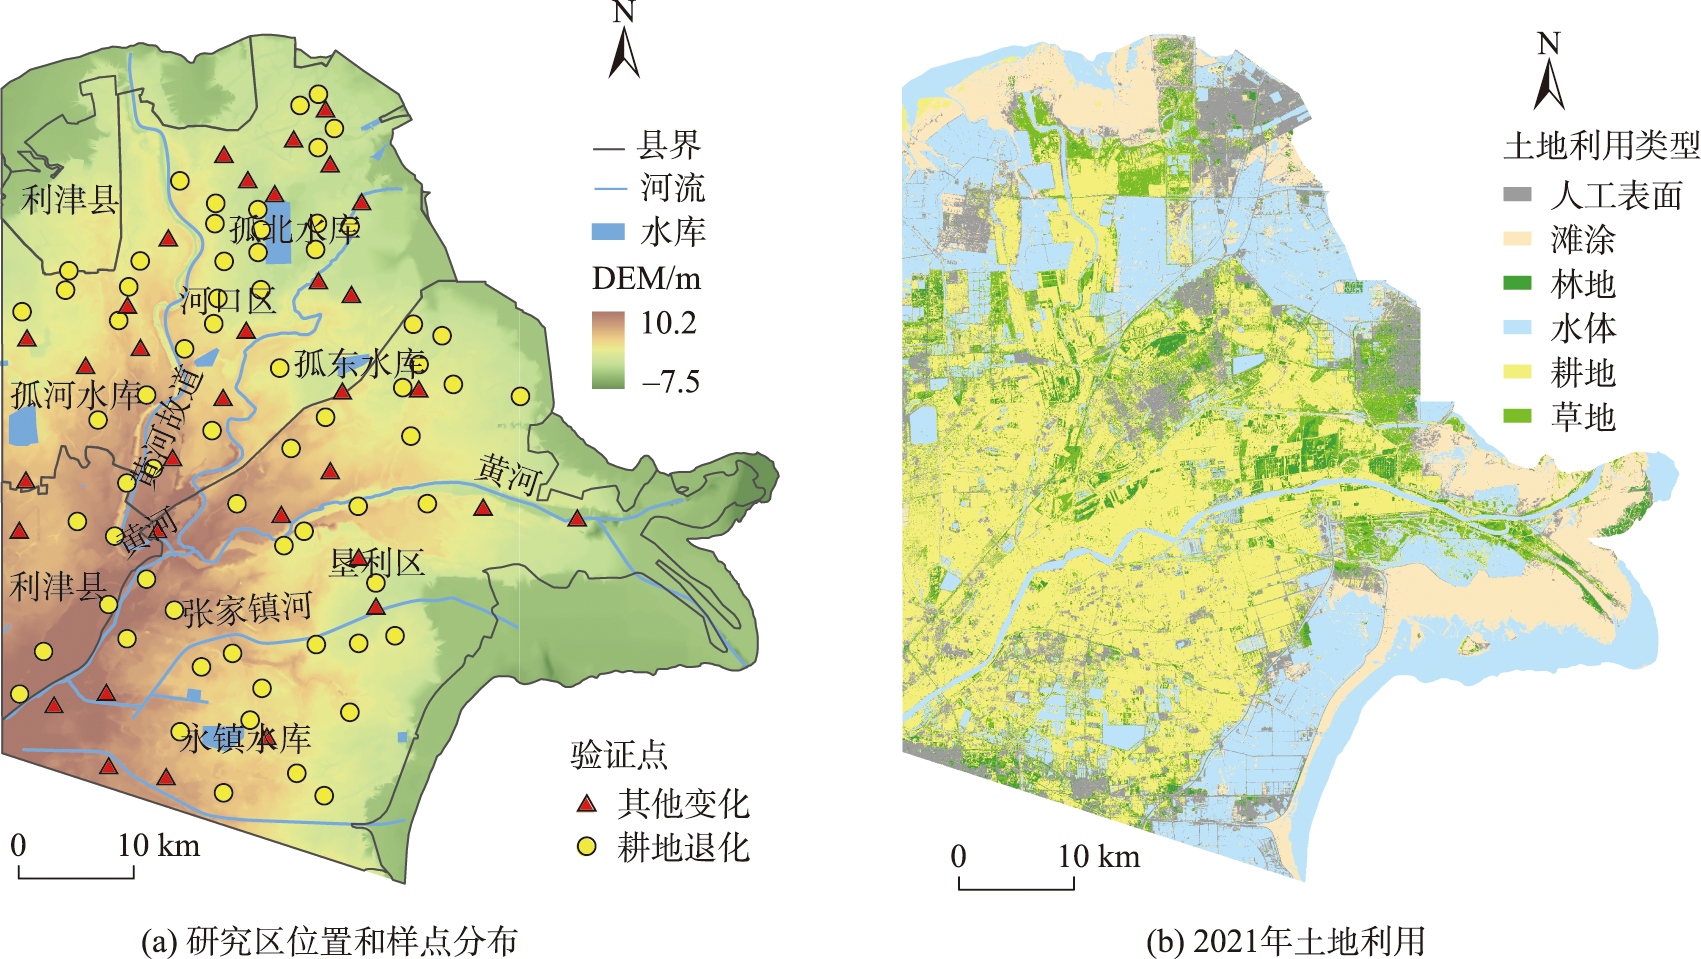
The degradation of cultivated land has profound implications for regional economic development, ecological security, and food security. Notably, the Yellow River Delta (YRD) is one of China's major grain-producing regions. Studying the degradation status and clarifying the driving mechanism of cultivated land in the YRD is crucial for ensuring regional food security and promoting cultivated land protection. Based on the MODIS NDVI data from 2001 to 2021, this paper uses the Breaks For Additive Seasonal and Trend (BFAST) method to explore the degradation status of cultivated land in the YRD. The study also uses the Geographic Detector to investigate the impact and driving mechanism of various natural and human factors and their interactions on the spatial differentiation of the degradation status of cultivated land at different scales, aiming to provide decision support for cropland protection and human activity regulation in the YRD. The results show that: (1) Compared to the linear trend, the non-linear trend method has higher accuracy in detecting the degradation status of cultivated land. It not only detects the overall trend of cultivated land changes but also detects phase-change information in long-term changes, which can comprehensively and accurately evaluate the degradation status of cultivated land; (2) The BFAST detection results indicate that 31.75% of cultivated land in the YRD is undergoing degradation, 61.06% is expirencing improvoment, and 7.19% exhibits non-significant trend. Most of the cultivated land in the YRD exhibits short-term fluctuations due to external disturbances in the long-term change process, e.g., 31.31% of these fluctuations are interrupted decreases, mainly distributed in areas such as Gubei Reservoir, the western side of the old Yellow River, and the southeastern coast. They show a spatial distribution pattern that gradually decreases and becomes more scattered from the coastal areas to the inland. The interruption increase accounted for 55.13%, mainly distributed in the southern region of the Yellow River, freshwater river areas, and near reservoirs, showing a large-scale concentrated distribution pattern; (3) The spatial differentiation of the degradation status of cultivated land at different scales in the YRD is primarily driven by land use, with significantly higher influence from interactive effect of two factors compared to their isolated effects. Specifically, land use ∩ elevation and distance to the sea ∩ land use are the dominant interactive factors affecting the degradation and improvement status of cultivated land, and the spatial differentiation of the degradation status of cultivated land in the YRD results from the dominant human-driven factors and the collaborative effect of natural factors.
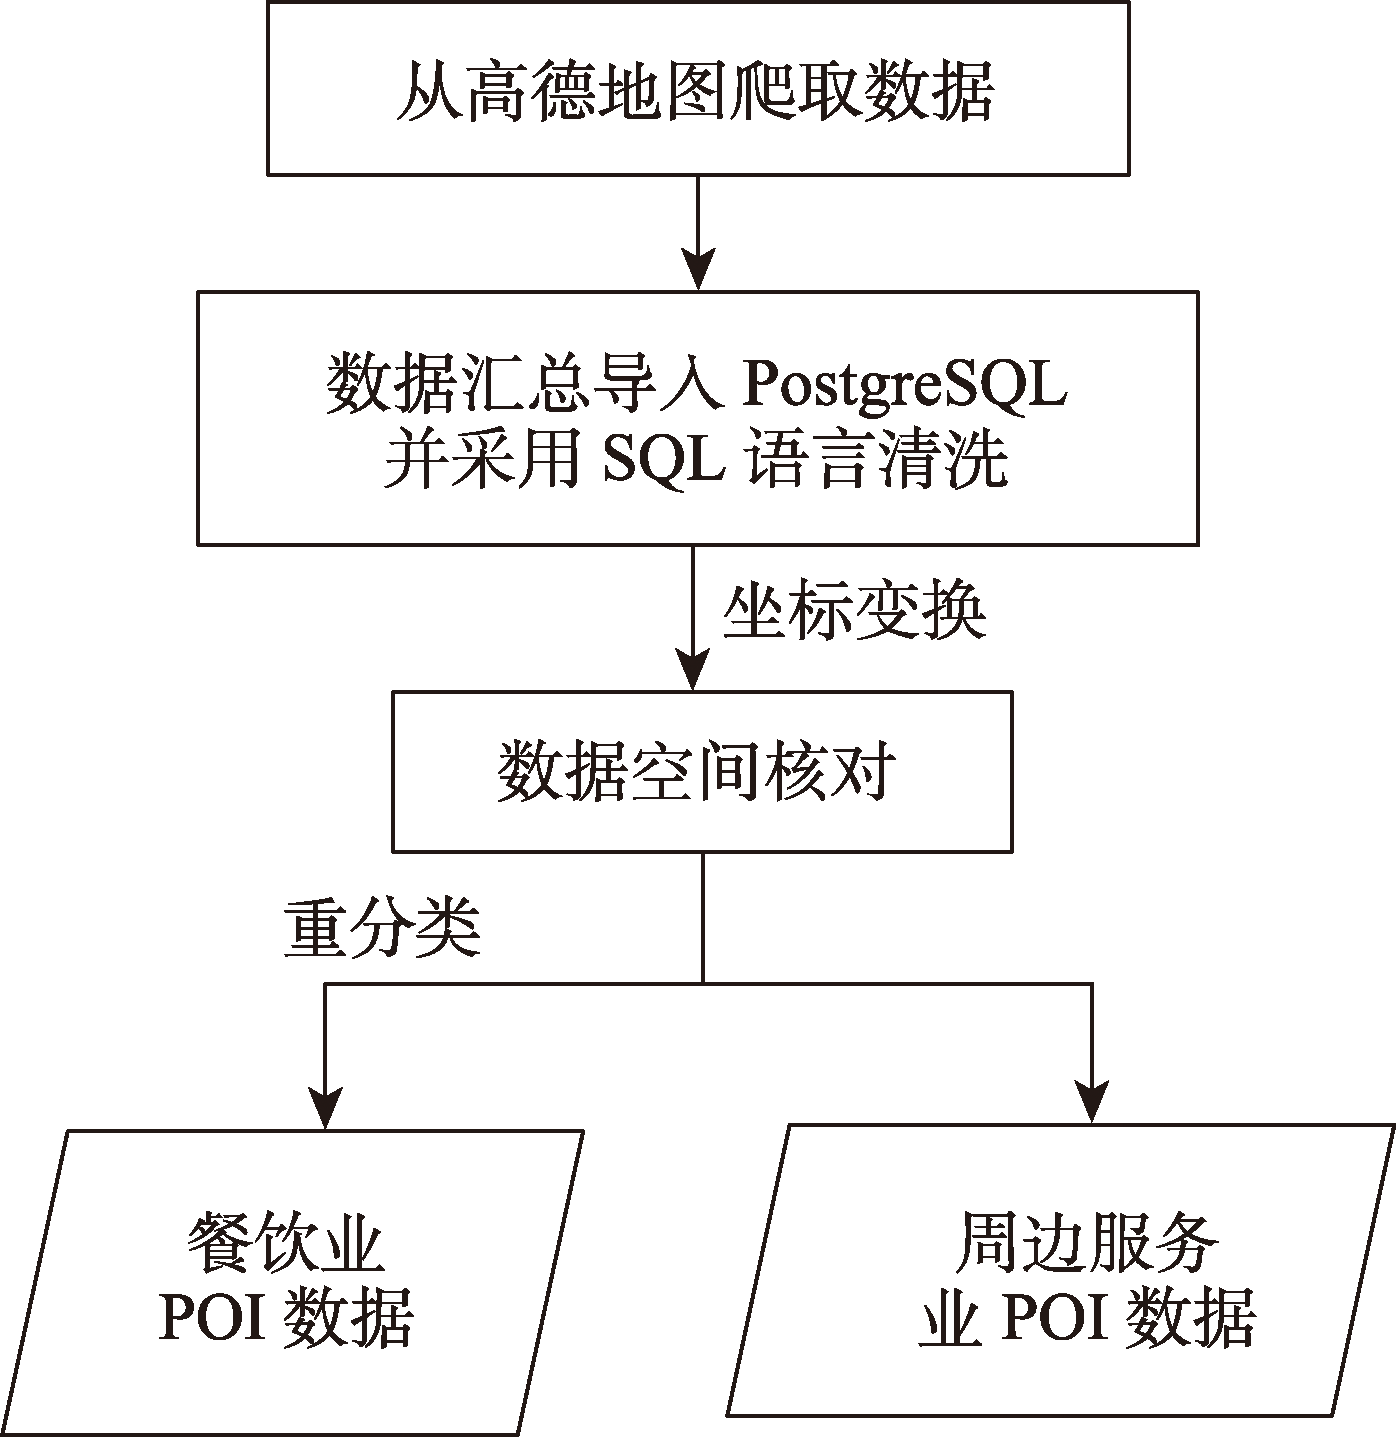
Based on the Point of Interest (POI) big data of the catering industry and related service industries in Guangzhou in 2021, this study analyzes the spatial distribution characteristics, influencing factors, and the spatial spillover effects of the overall and subdivided catering industry in Guangzhou based on the methods of HDBSCAN clustering, Collaborative Location Quotient, and Spatial Durbin Error Model. The study mainly explores the overall and local spatial relationships between the catering industry and surrounding service industries. The results show that: 1) Different catering density areas show variations in the spatial distribution of the catering industry in Guangzhou. The catering industry in high-density areas is characterized by a muti-central agglomeration pattern, while the catering industry in low-density areas is characterized by central agglomeration with surrounding radiation. The local distribution of restaurants are related to population features, such as population density, population education level, and so on; 2) There are variations in the spatial correlation between the catering industry and its surrounding service industries across different catering density areas. Areas with high catering density have the strongest spatial correlation, while areas with moderate catering density have the weakest spatial correlation; 3) the influence of surrounding service industries on different types of catering industry also varies. In general, the spatial correlation strength from strong to weak is as follows: fast restaurants, dinner restaurants, snack bars, and cold beverage shops. The local spatial differences are similar but the spatial difference of dining restaurants is the most obvious; 4) The estimation results of the Spatial Durbin Error Model at the street-town scale show that transportation facilities services, shopping services, and population size have the most direct impact on the POI number of local catering industries, with obvious spatial spillover effects. Both the population size and surrounding service industries are the main factors that influence the spatial distribution of fast food restaurants, while dinner restaurants, snack bars, beverage shops, and other catering industries are easily affected by transportation facilities and shopping services. In general, from the perspective of spatial correlation, this study deepens the research on the location theory of service industries. It also provides references for the study of commercial geography and the optimization and adjustment of the spatial pattern of the catering industry in big cities.
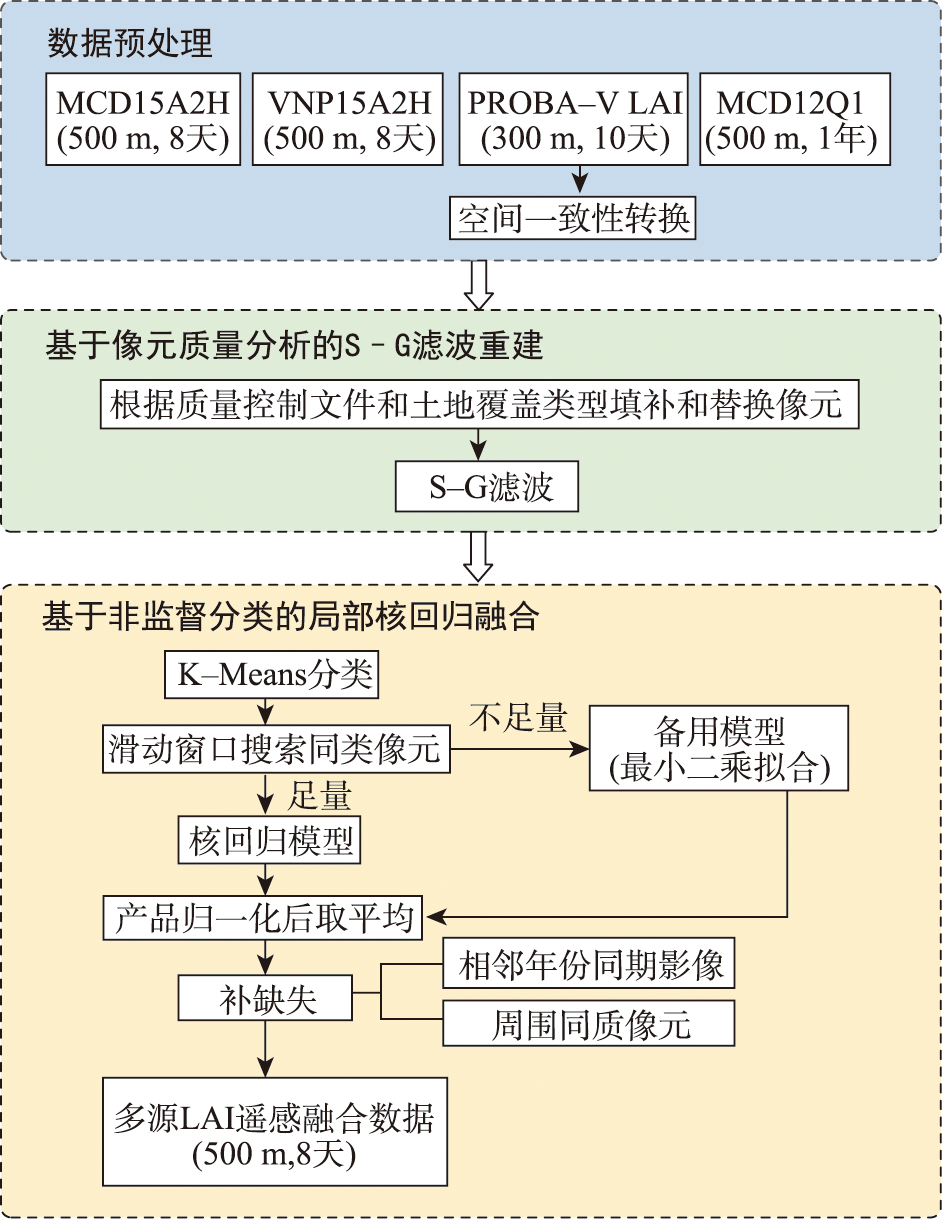
Leaf Area Index (LAI) is an important parameter for characterizing the canopy structure of vegetation. Remote sensing products of LAI are often affected by factors such as clouds, aerosols, snow, algorithms, and instrument issues, which result in poor data quality or missing data, seriously affecting the application of LAI datasets. In this paper, we propose a LAI time-series data fusion method based on improved S-G filtering and unsupervised classification local kernel regression. The normalized fusion is carried out using MODIS LAI, PROBA-V LAI, and VIIRS LAI products from 2014 to 2020 to improve the consistency, continuity, and accuracy of the products. Results show that the fused LAI shows good consistency in frequency distribution and temporal variation with the source products and other LAI products (MCD15A2H, MOD15A2H, VNP15A2H, PROBA-V), with a R2 of 0.85, 0.77, 0.84, and 0.89, respectively. Compared to other four products, the frequency of data missing is generally reduced, and the temporal continuity is improved. The averaged missing frequency of the fused LAI is reduced to 5.04%, compared to MCD15A2H LAI (19.59%), MOD15A2H LAI (25.54%), VNP15A2H LAI (23.33%), and PROBA-V LAI (9.64%). Also, the fused LAI shows the strongest correlation with ground measurements, with a R2 of 0.76,which is 0.03~0.20 higher than other products, and a root mean square error (RMSE) of 1.16 m2/m2, which is lower than other products (0.10~0.66 ) m2/m2, indicating a higher accuracy.
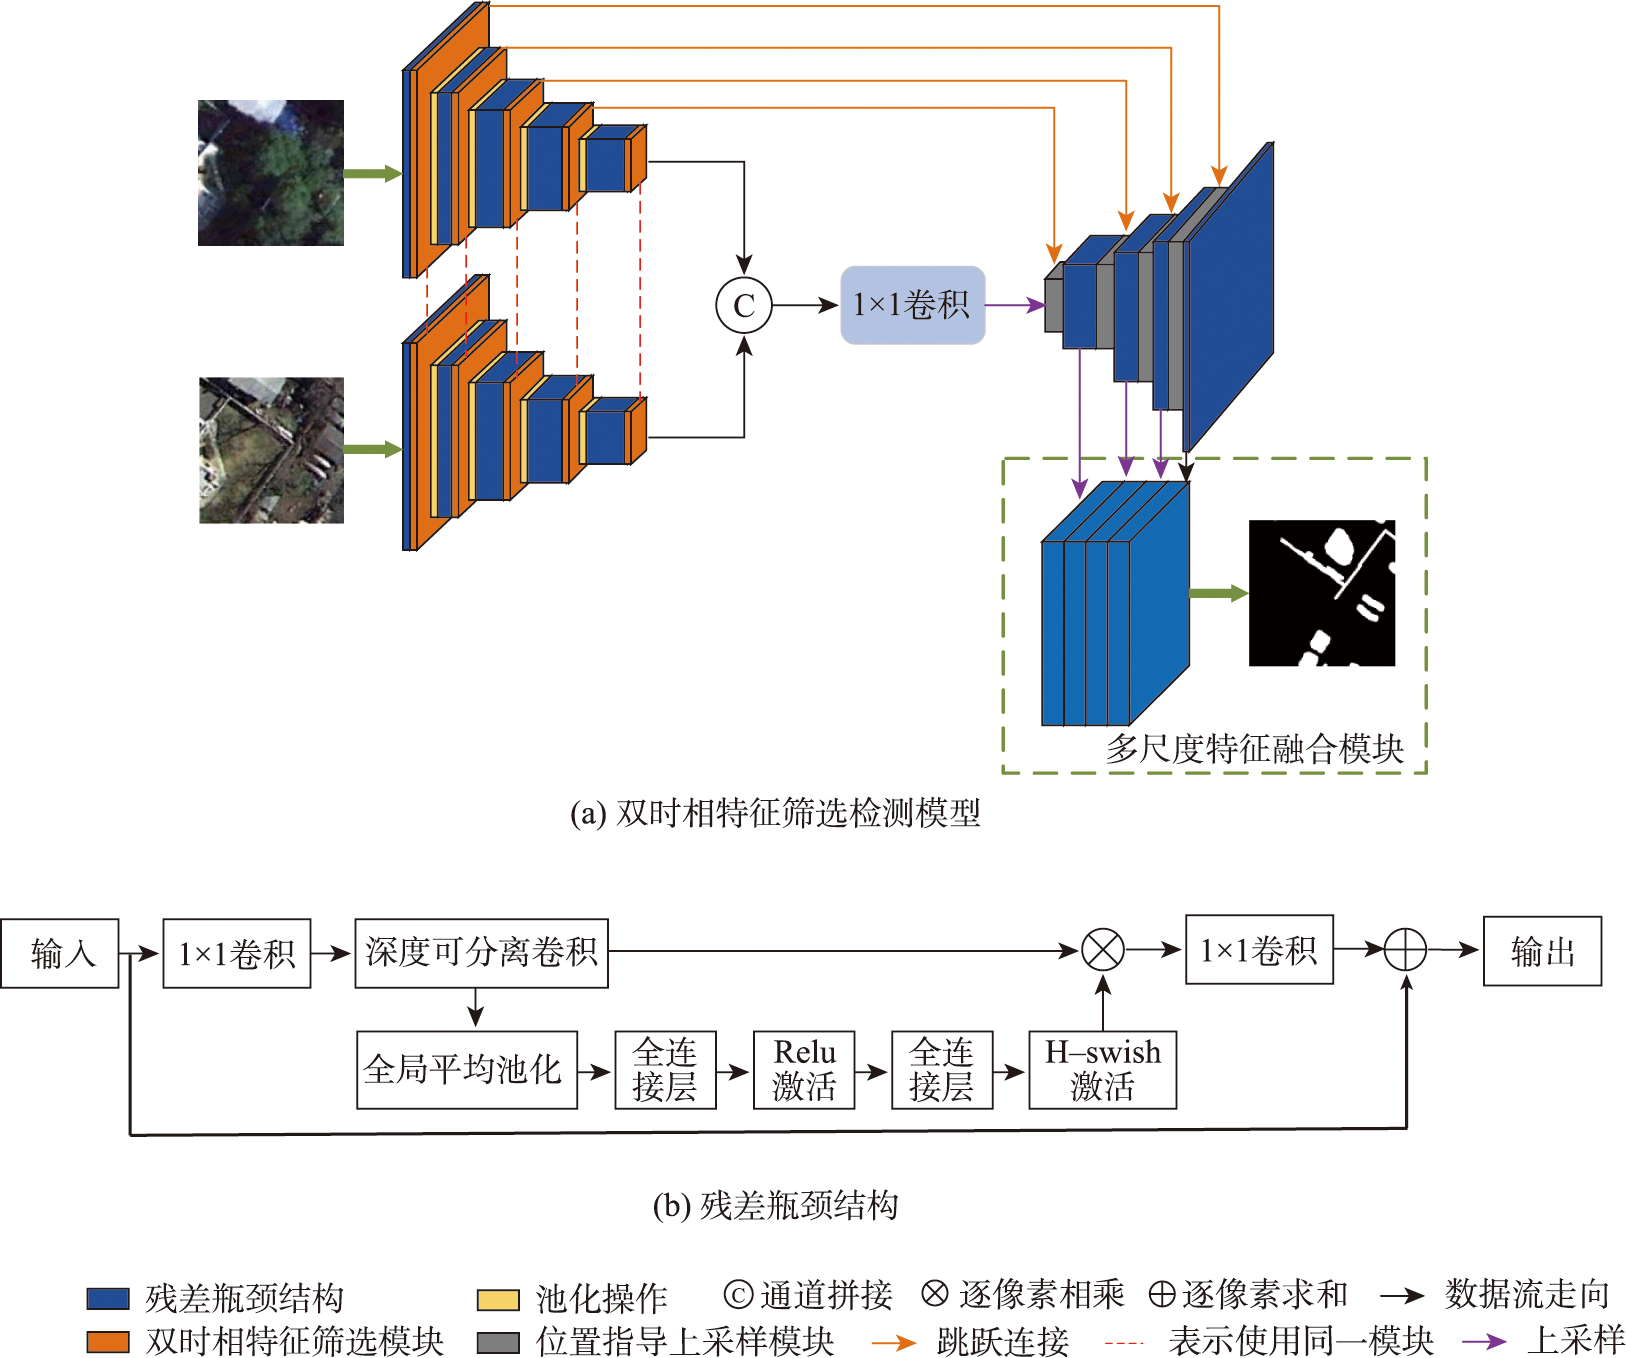
Real time monitoring of buildings using remote sensing image change detection is critical for the management and investigation work of land, resources, and environment departments. This study proposes a lightweight remote sensing image change detection model based on dual-temporal feature screening. This model is designed to solve the problem that the interdependency between dual-temporal images is not fully utilized in existing remote sensing image change detection tasks, and the detection accuracy is degraded due to the loss of spatial detail information. In the encoding part of the model, in order to reduce network size and improve latency, a simplified MobileNetV3 is used to extract features at different levels from dual-temporal remote sensing images. To fully utilize the spatiotemporal dependencies between dual-temporal remote sensing images in change detection tasks, a dual-temporal feature filtering module is proposed in the encoding part. The features at the same level are input into the feature filtering module to establish relationships between dual-temporal images through attention mechanisms and threshold filtering, generating more discriminative features and enhancing the model's ability to recognize changes and obtain global information. In the decoding part of the model, a position-guided upsampling module is introduced to solve the problem of incorrect assignation of boundary pixels with ordinary upsampling methods. By using the relationship between dual-temporal images to assign different weight coefficients for the feature maps output by DFSM, it is fused with the feature maps after upsampling and convolution to highlight useful information and suppress complex background information in remote sensing images. To address the issue of spatial detail information loss caused by downsampling operations, a multi-scale feature fusion module is proposed to aggregate multi-level features in the decoder and generate a change map with more spatial detail information. The effectiveness and real-time performance of our proposed model is verified based on CDD and DSIFN datasets, and compared with six advanced methods including FCN-PP, FDCNN, IFN, MSPSNet, SNUNet-CD, and DESSN for remote sensing image change detection. The experimental results show that the precision, recall, F1 scores, and IoU of the proposed model on the CDD dataset are 91.28%, 87.63%, 89.42%, and 81.34%, respectively. The parameter size, computational complexity, and prediction time are 1.89MB, 5.72GFLOPs, and 0.02s, respectively. Compared to these six models, the proposed model has significant advantages in terms of accuracy and real-time performance, making it particularly suitable for deployment on mobile devices. Also, the visualization results of the model detection in this study are more complete, and the detected change boundaries are smoother. This study demonstrates that the proposed model achieves a better balance between accuracy and real-time performance.
Each year, approximately 2.1 million sheep are released to graze freely in vast, forest-covered, and mountainous areas throughout Norway. At the end of the grazing season, farmers must find and round up their sheep. This can be a time consuming and challenging process because of the large area and cluttered nature of the sheep grazing environment. Existing technologies that help farmers find their sheep, such as bells, radio bells, electronic ear tags and UAVs, are limited by the cost, signal coverage, and low degree of automation, which cannot efficiently and automatically locate sheep in the wild. This study proposes an automatic sheep detection algorithm using UAV images. A model architecture using the ResNet and ResNeXt as the backbone networks is designed to address the automatic sheep detection task from UAV RGB and infrared images. Our study evaluates how well this model meets performance and processing speed requirements of a real-world application. We also compare models using fused RGB and infrared data to models using either RGB or infrared as input, and further explore the model complexity and generalization ability. Results show that fusion of RGB and infrared data yields better average precision results than using single RGB or infrared dataset in the model. The set of optimal solutions achieve average precision scores in the range of 69.6% to 96.3% with inference times ranging from 0.1 to 0.6 seconds per image. The most accurate network achieves a grid precision of 97.9% and a recall of 90.1%, at a confidence threshold of 0.5. This corresponds to the detection of 97.5% of the sheep in the validation dataset. These satisfactory results demonstrate the great potential of the proposed automatic sheep detection method using multi-channel UAV images for improving sheep roundup.
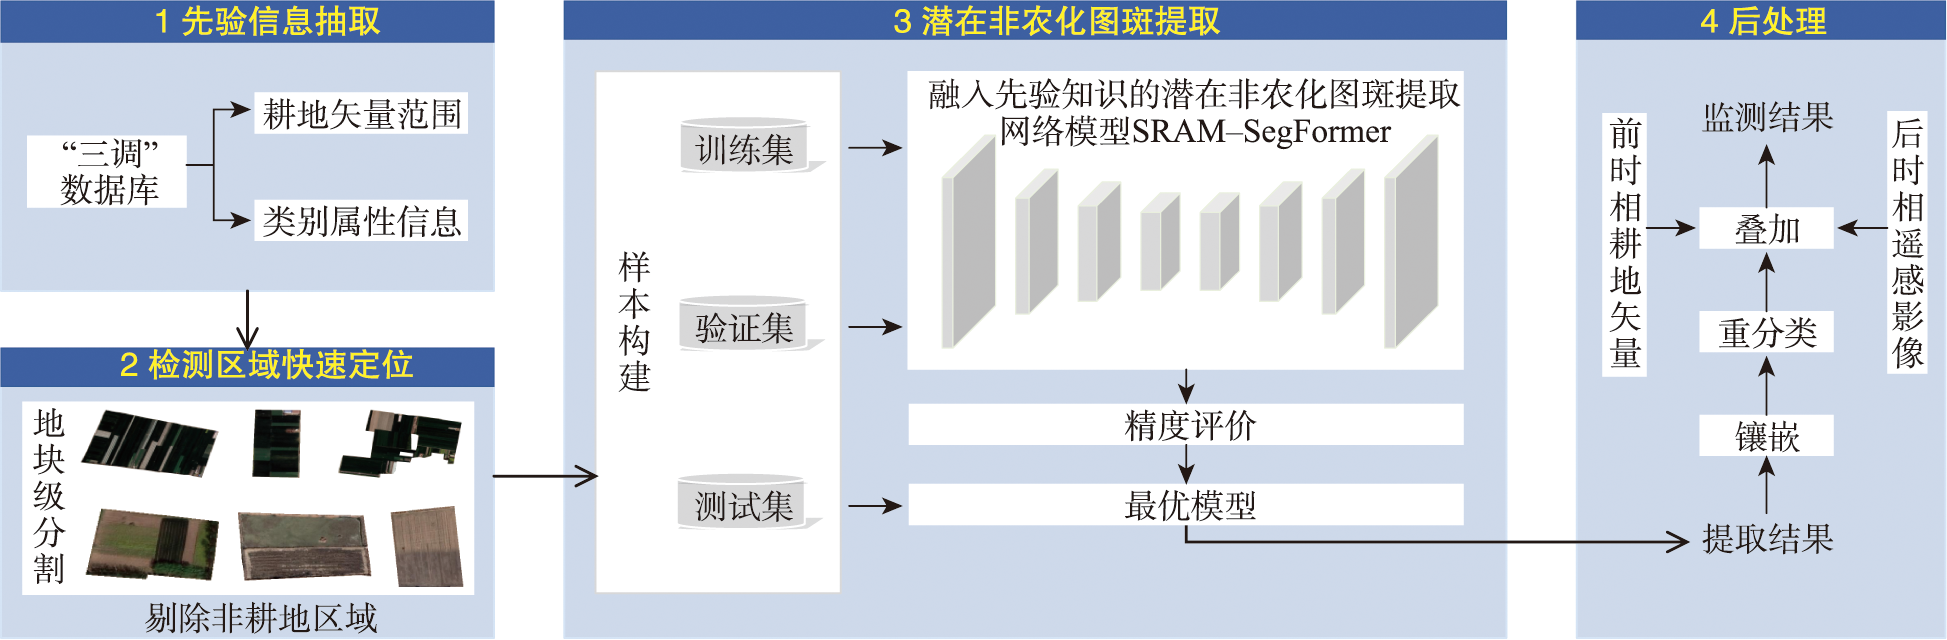
Accurate and automated monitoring of the non-agriculturalization of cultivated land has important implications for upholding the arable land red line and ensuring sustainable socio-economic development. This paper proposes a deep learning method guided by prior knowledge to achieve precise monitoring of the illegal occupation of cultivated land by buildings and greenhouses, with the ultimate goal of issuing timely warnings. Firstly, the vector range and category attributes are obtained from the third national land survey database, serving as prior knowledge. Then, parcel-level segmentation of high-resolution remote sensing images is performed using the front-phase vector data of the cultivated land to locate detection areas. Next, the SRAM-SegFormer model, integrated with prior knowledge, is employed to extract potential non-agricultural patches. Finally, post-processing operations such as mosaic, reclassification, and overlay are performed to obtain final monitoring results of arable land non-agriculturalization. Taking the Peixian County in Xu Zhou City as the study area, the performance of common sematic segmentation networks, including Deeplabv3+, PSPNet, U-Net, HRNet, SegFormer, and SRAM-SegFormer, in extracting potential non-agricultural patches are compared. The results show that Deeplabv3+ and PSPNet are prone to omissions and false detections in complex areas; U-Net tends to miss large-scale buildings; HRNet exhibits irregular boundaries in extracted non-agricultural patches; SegFormer has poor extraction ability for small-scale buildings and greenhouses, and tends to merge buildings and greenhouses in densely populated areas; SRAM-SegFormer shows the best results, with the highest accuracy rate for Mean Pixel Accuracy (MPA) (84.30%), Mean Intersection-Over-Union (MIoU) (73.76%), and Overall Accuracy (OA) (97.91%), especially in extracting small-scale buildings and greenhouses. Therefore, the proposed method in this paper can achieve more efficient and automated monitoring of arable land non-agriculturalization.