尹凌 , 姜仁荣
, 姜仁荣
YIN Ling, JIANG Renrong
通讯作者:
收稿日期: 2016-09-11
修回日期: 2016-10-16
网络出版日期: 2017-06-20
版权声明: 2017 《地球信息科学学报》编辑部 《地球信息科学学报》编辑部 所有
基金资助:
作者简介:
作者简介:尹 凌(1981-),女,重庆人,博士,副研究员,研究方向为时空数据分析。E-mail: yinling@siat.ac.cn
展开
摘要
手机通话位置数据已经成为全球范围内广泛使用的人类活动研究数据,其为高时空分辨率的人口分布估计提供了一种新的途径。然而,手机通话位置数据具有不规则稀疏采样的特点,其反映出的人口分布可能具有一定误差。本研究以深圳市为例,首次结合24 h连续定位的手机信令数据,分别从时间和地理维度量化分析了使用手机通话位置数据估计24 h人口分布的偏差,同时探讨了剔除低频用户对上述偏差的影响。本研究揭示,在居民活跃时间段,使用通话用户的分布估计人口分布时,相对误差的中位数在25%~30%之间;城市内部的土地利用类型与通话用户人口估计偏差具有显著的关联;剔除低频用户会略微减小土地利用对人口分布偏差的影响。本研究成果可帮助理解手机通话位置数据在估计高时空分辨率人口分布上的局限性和适用性,为合理使用手机通话位置数据进行相关研究和应用提供科学依据。
关键词:
Abstract
Call detail records (CDRs) have been widely used to study human activities over the world. They offer a new channel to estimate population distribution with higher spatiotemporal resolution. However, the samples of CDRs distribute irregularly and sparsely, which could cause certain bias in the derived population distribution. This study is the first assessment that takes a mobile signaling dataset of 24-hour tracking users as a benchmark to evaluate the bias in population distribution derived from CDRs. Particularly, taking Shenzhen City as an example, this study quantifies the relative errors of 24-hour population distributions from both temporal and geographical dimensions, and also discusses the impact of excluding low-frequency call users on these errors. This study found that the medians of relative errors lie between 25%~30% when using caller volume to estimate population distribution during human active hours and the errors will increase during sleeping time. Such bias should be made aware of for researchers and application practitioners. This study also demonstrated that the urban land use types strongly relate with estimation errors of population distribution derived from CDRs. Especially, the population in rural residential land and industrial land will be significantly underestimated, while that in transportation land will be highly overestimated. For applications such as emergency evacuation or facility allocation based on population derived from CDRs, these results can support correcting population estimation errors and help to locate rescuing support or public resources more properly. At last, this study showed that excluding low-frequency call users can slightly mitigate the impact of land use on the estimation errors, suggesting excluding low-frequency users in a rigorous way. Overall, the findings of this study can help understand the limitation and suitability of applying CDRs to estimate population distribution with high spatiotemporal resolution, as well as offering scientific support for research and applications of using CDRs in an appropriate way.
Keywords:
人口时空分布是城市、交通、健康、灾害等众多研究与应用领域的重要依据[1-4]。长期以来,由于数据源的限制,准确生成24 h人口数量的空间分布一直是一项挑战[5-6]。近年来,由于手机的高普及率,大规模持续采样的手机定位数据为估计更高时空分辨率的人口分布提供了一种新的途径[7-13]。
国内外研究与应用领域广泛使用的一种手机定位数据为呼叫详细记录(Call Detail Records,CDRs),是手机运营商计算营收的一种基本数 据[14-15]。由于该类数据记录了手机使用事件(如接打电话或收发短信)发生时连接的基站编码与时间,因此产生了一种记录个体轨迹的数据。为体现该类数据的时空特征,本研究称之为手机通话位置数据。然而,打电话或发短信的此类手机使用事件往往具有随机性和短期爆发性[16-18],使手机通话位置数据在时间维度上具有不规则稀疏采样的特点,其反映出的个体时空特征在某些研究和应用上具有有偏性甚至是误导性[19-21]。
为了在实际应用中对手机定位数据的分析结果进行科学的判读与调整,研究人员和行业应用人员不仅对这种新数据的优势感兴趣,同样也关心它的局限性,如偏差。文献[22]-[23]对手机通话位置数据在估计人口分布中的可用性和局限性进行了探讨,研究表明:相比于通话数量和话务量(Erlang值)等指标,手机通话位置数据中的通话用户量能够更准确地估计人口分布[23];使用手机通话位置数据估计的每小时人口分布与由全球人口数据(LandScan数据)[24]提供的全天平均人口分布相比,二者相关系数不高,具有明显的差异,并且此差异呈现空间异质性[23];使用手机通话位置数据估计的夜间人口分布与人口普查数据的相关系数较高,但仍有一定的差异[22-23]。
基于现有研究,针对24 h人口分布的估计,使用手机通话位置数据造成的偏差问题仍然有待进一步定量分析与讨论。首先,为了准确的评价手机通话位置数据估计的24 h人口分布偏差,较为理想的对比基准是更为可靠的24 h人口分布数据。现有研究[22-23]中使用的全天平均人口分布(LandScan数据)和居住人口分布(人口普查数据)均是一种相对静态的对比基准,不能准确地反映不同时段的人口分布估计偏差。其次,文献[23]提出,手机通话位置数据估计的24 h人口分布偏差受地理环境的影响。然而,地理环境(如土地利用)如何影响偏差有待进一步量化分析。此外,手机通话位置数据中通常存在一部分低频的电话/短信用户,如平均通话频率低于1次通话/天,或在一段时期的数据集中只有少量时间存在记录。基于分析需要,现有相关研究通常将低频用户剔除以确保数据集中用户轨迹的连续性[25-26]。文献[20]表明,剔除低频用户会导致部分常用的移动性测量指标出现偏差,如会导致测量活动地点离散度的香农熵分布整体偏低。因此,在使用手机通话位置数据估计24 h人口分布的研究中,是否应该剔除低频用户以及剔除低频用户会造成何种影响值得探讨。
本研究旨在深入讨论手机通话位置数据在估计24 h人口分布中的偏差,并给出量化的数据应用方式建议。本研究以一套深圳市手机通话位置数据为例,以另一套深圳市24 h连续定位的手机数据作为对比基准,分析并讨论了基于手机通话位置数据估计的不同时段的人口分布偏差、不同土地利用对人口分布估计偏差的影响、以及剔除低频用户所产生的影响。
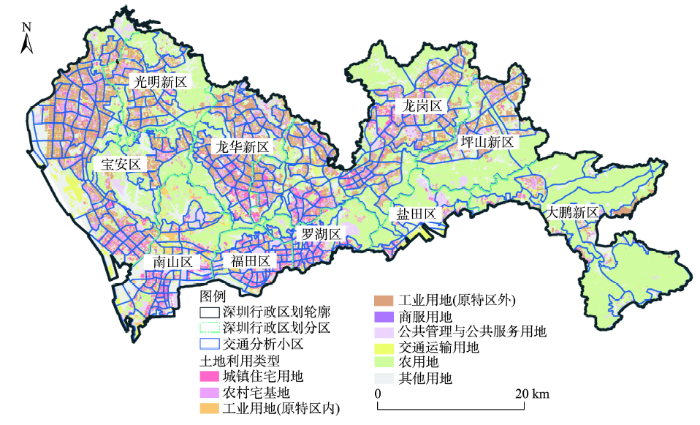
本研究以深圳市为研究区域。深圳市总面积为1996.85 km2,现有10个辖区(图1),包含6个行政区:福田区、罗湖区、南山区、盐田区、宝安区和龙岗区,以及光明新区、龙华新区、坪山新区和大鹏新区4个功能区。2010年以前,福田区、罗湖区、南山区、与盐田区属于深圳市经济特区,“特区”与“非特区”被分割管辖。
图1 深圳市行政区划及土地利用分布图
注:该地图中没有包括岛屿
Fig.1 The administrative zones and land use distribution of Shenzhen City
本研究使用了2套手机定位数据集。第1套数据集是深圳市手机信令数据,较高采样频率的记录了手机连接的基站坐标及时间戳,其中部分用户的时间采样间隔达到0.5-1 h,在本研究中作为24 h人口分布的基准数据源。该原始数据集包含了运营商A的1600万手机用户2012年某一工作日的信令记录,基站的平均覆盖半径约为250 m①(①平均覆盖半径的计算方法为:计算与每个基站覆盖范围面积对等的圆的半径,然后计算所有对等圆半径的平均值。)。按照夜间0-6 时最频繁活动点归属,研究区域内10 个辖区的用户分布比例如表1 所示(“手机信令数据”一列)。为了保证规则连续采样,本研究从原始数据中筛选出585 万每小时皆有记录的手机用户。由于这种筛选可能引入空间不均匀采样的偏差,为了减小这种数据预处理造成的二次偏差,本研究按上述各个辖区的用户比例对筛选出的585 万手机用户进行随机抽样,最终得到与原始各辖区用户比例一致的387万连续采样手机用户,由此生成数据集D1。由于运营商A在深圳的手机用户市场占有率约为75%,并且在10 个辖区没有显著的市场策略差异,可以认为运营商A的手机用户采样能够较准确地反映深圳市手机用户的空间分布[27]。在此基础上,本研究制作的D1 数据集既保证了每小时连续采样,又保证了各辖区用户比例与原始数据一致,因此,可以认为D1 数据集能够较准确地反映深圳市手机用户24 h 的空间分布,是一套较为理想的24 h 人口分布的基准数据。
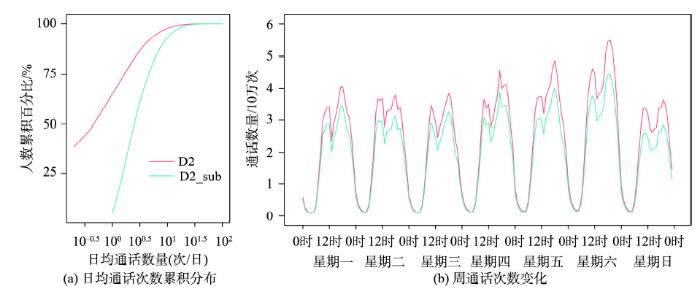
第2套数据集是深圳市手机通话位置数据,记录了手机通话时连接的手机基站坐标及时间戳,在本研究中作为分析手机通话位置数据估计24 h人口分布偏差的数据源。该数据集包含了运营商B的475万手机用户2011年34天的通话位置数据(在D1之前7个月),其中包括25个工作日以及9个周末,基站的平均覆盖半径约为450 m。由于少量手机终端可能是特殊用途的自动呼叫设备,为了消除该部分噪音,本研究剔除了原始数据集中某一天通话记录超过200次的异常高频用户,共计剔除1216名用户。由表1可知,第一套数据集(“手机信令数据”一列)和第二套数据集(“原始手机通话位置数据”一列)的原始用户区域分布比例存在一定差异,这可能是由于不同区域的人口特征差异和不同运营商的市场策略差异造成的。为了在后续偏差分析中保持对比基础的一致性,基于随机采样的原则,本研究按D1各个辖区的用户比例对原始手机通话数据集中的用户进行重采样,最终得到与D1用户分区比例一致的348万手机用户,由此生成的数据集在本研究中称为D2。D2用户平均每天有1.6个通话记录,其中约65%的用户平均每天通话记录少于一次(图2(a)),D2数据集一周七天的通话次数随时间变化略有不同(图2(b))。
图2 手机通话位置数据集(D2)和剔除低频用户后的数据集(D2_sub)的通话频次分布
Fig.2 The distribution of call frequency of the CDR dataset (D2) and CDR dataset without low-frequency users (D2_sub)
表1 手机定位数据集的用户区域分布比例(%)
Tab.1 The percentages of user distribution in different regions from mobile location datasets (%)
| 手机信令数据(D1) | 原始手机通话位置数据 | 重采样后的手机通话位置数据(D2) | 重采样并剔除低频用户后的手机通话位置数据(D2_sub) | |
|---|---|---|---|---|
| 宝安区 | 28.27 | 24.22 | 28.29 | 28.27 |
| 龙岗区 | 18.45 | 20.00 | 18.45 | 19.52 |
| 福田区 | 12.71 | 12.16 | 12.72 | 11.88 |
| 龙华新区 | 11.70 | 12.02 | 11.70 | 12.04 |
| 南山区 | 9.52 | 10.13 | 9.52 | 11.06 |
| 罗湖区 | 8.67 | 11.32 | 8.67 | 6.27 |
| 光明新区 | 5.42 | 4.34 | 5.42 | 5.48 |
| 坪山新区 | 3.11 | 3.05 | 3.11 | 3.43 |
| 盐田区 | 1.28 | 1.68 | 1.28 | 1.22 |
| 大鹏新区 | 0.85 | 0.98 | 0.85 | 0.79 |
为探讨手机通话位置数据中的低频用户对24 h人口分布估计结果的影响,本研究基于D2制作了剔除低频用户之后的D2数据子集D2_sub。本研究对低频用户的定义设定为低于平均1次通话/天或者记录天数少于总天数1/3的手机用户。D2_sub包含了114万相对高频的手机用户,每个用户平均每天至少有1次通话记录(图2(a)),并且记录天数至少为总天数的1/3。D2_sub数据集一周七天的通话次数随时间变化与D2数据集高度相似(图2(b))。
由于D1和D2数据集中手机基站的位置分布不同,为了统一D1和D2数据集的空间分析单元,本研究需要将D1和D2的空间分辨率由手机基站转换到一个统一的空间单元。常用的一种空间分析单元为均匀分布的网格,但是手机基站的分布并不是均匀的,而是基于人口和通信强度等因素分布的,使用网格统计会在空间单元转换过程中产生较大的误差,如在一个人口稀少的区域只有一个手机基站,难以将该基站连接的用户简单而合理地转换至该区域包含的多个网格中。因此,本研究采用综合了人口和交通等多种因素的交通分析小区(Traffic Analysis Zone,TAZ)作为一种统一的空间分析单元。根据深圳市2010年交通出行调查,深圳市陆地区域共划分为491个TAZ,平均覆盖半径为994 m(图1)。在由基站到TAZ的空间单元转换过程中,为了尽可能简单有效地减小转换过程中产生的二次误差,本研究首先建立了Voronoi多边形表达基站服务范围[28-29],然后将Voronoi多边形与TAZ多边形进行空间相交切分,同一个Voronoi多边形的相关属性值(如连接的通话用户数量)按照被切分面积的比例进行切分后空间单元属性值的重分配,最后对属于同一TAZ的空间单元进行TAZ单元层面的属性值合并,进而完成从基站到TAZ的空间单元转换。
由于手机定位数据中的用户量只占深圳市总人口的一部分,因此本研究估计的24 h人口分布是空间上的人口相对分布(即人口百分比),而不是绝对数量的分布。24 h人口则以每小时为时间单元进行估计。对于一个用户在同一小时内具有多个采样记录的情况,本研究取其出现频率最高的位置作为代表,如果多个记录的位置出现频率相等,则取其在该小时内第一个出现的位置记录作为该小时的代表。
由此,基于手机信令数据D1,统计每小时在空间单元内出现的用户数量,并转换成人口百分比,生成人口密度分布的基准。
基于手机通话位置数据计算人口分布时则需要选取代表人口分布的指标。文献[23]表明,基于手机通话位置数据数据的话务量(Erlang值)、通话数量和通话用户量来估计人口分布时,通话数量与通话用户量成正比,且这2个指标都比话务量估计的人口分布结果更好。因此,针对手机通话位置数据,本研究采用通话用户量这个指标来估计人口数量,并转换成人口百分比。此外,为了尽量消除手机通话位置数据D2和D2_sub稀疏采样造成的随机性,本研究计算了多天的平均通话用户量,而不是使用随机某一天的通话用户量。图2(b)显示出D2和D2_sub一周7天存在通话数量的差异,因此本研究只选择了和D1同样的工作日进行平均通话用户量的计算。
本研究将D1估计的24 h人口分布作为基准,分别从时间和地理两个维度量化分析包含低频用户的手机通话位置数据集(D2)和剔除低频用户的手机通话位置数据集(D2_Sub)在估计24 h人口分布时所产生的偏差。在下述分析中,本研究均选取相对误差来量化偏差程度。
针对偏差分析,本研究有2个基本的假设:① 假设基于信令数据集(D1)估计的24 h人口分布是地面真实的人口分布情况;② 假设2套数据集D1和D2的采样比例在空间上分布一致,即2套数据集的手机用户比例在空间上分布一致。第①条假设已经在D1数据预处理部分中被证明具有较高的可靠性,第②条假设则通过D2数据的重采样得到了一定区域尺度的保障,本研究的2个基本假设皆具有较高的可靠性。
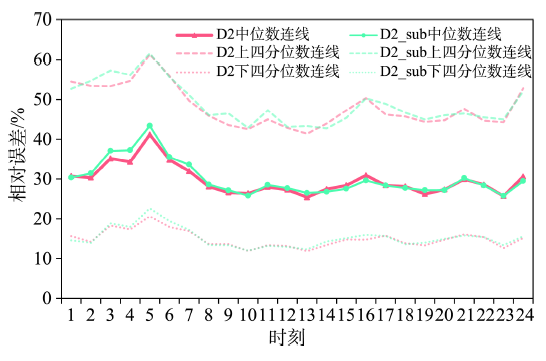
为了量化不同时段的手机通话位置数据人口分布估计偏差,本研究以深圳市TAZ为空间单元,以D1为基准,计算D2和D2_sub人口分布的相对误差。结果显示,基于TAZ单元的人口分布相对误 差呈正偏态分布,因此,本研究选用四分位数来描述其特征。剔除异常值②(②利用分位数的方式检测并取出异常值:异常值下限:Q1-1.5×(Q3-Q1);异常值上限:Q3+1.5×(Q3-Q1)。其中,Q1、Q2和Q3分别表示25、50和75百分位数。)以后,使用D2估计的人口分布24 h相对误差的中位数平均值为29.67%,使用D2_sub估计的人口分布24 h平均相对误差的中位数平均值为30.05%。整体而言,基于通话用户量估计24 h人口分布具有一定的相对误差,并且保留通话低频用户与剔除低频用户的整体效果相当。
图3显示了D2和D2_sub估计的人口分布相对误差四分位数的时间变化。从变化趋势上看,D2和D2_sub的相对误差具有相似的变化趋势。相对误差从0时开始上升(中位数平均值约为30%),在凌晨5时达到全天最高峰(中位数平均值超过40%),随后开始下降,在早上8时以后趋于平稳(中位数平均值为25%~30%),并一直保持到夜间24时。给定时段内,基于通话用户量的人口分布相对误差实质体现了活跃手机用户在地理空间上分布的均匀度。深圳市的工作时间通常从9时开始,商服或者公用设施通常在22时关门。因此,9-22时是当地居民的活动活跃时间。在这个时间段,活跃的手机用户相对均匀地分布在整个深圳市。而在睡眠时间段,活跃的手机用户则集中分布在某些特别的地方。例如,一些外贸公司的职员必须在晚上和其他国家的用户沟通,或者一些传统产业存在夜班制度等,都会导致活跃手机用户的空间分布不均匀,进而致使人口相对分布的估计结果偏差较大。此外,在睡眠时间段,保留通话低频用户比剔除低频用户的偏差稍小。
图3 基于手机通话位置数据估计人口分布的24 h相对误差的四分位图
Fig.3 The quartile graph of 24-hour relative errors of population distribution estimated by call detail records
由图3的上下四分位数线可以看出,基于手机通话位置数据,不同TAZ空间单元的人口估计相对误差存在较大的离散度,即人口估计相对误差存在较为明显的空间异质性。因此,为了帮助理解地理环境如何影响基于通话用户量的人口估计偏差,本研究进一步分析在不同土地利用类型中人口估计的偏差。本研究使用了深圳市2011年的土地利用数据,在土地利用现状分类标准(GBT 21010-2007)的基础上,结合本研究的目的,将深圳市的土地利用分为9类③(③根据土地利用现状分类标准(GBT 21010-2007)编码,本研究九种土地利用分类规则如下:城镇住宅用地(071)、农村宅基地(072)、工业用地(061)、商服用地(05)、公共管理与公共服务用地(08)、交通运输用地(10)、农用地(01、02、031、032、04),剩余作为其他用地。):城镇住宅用地、农村宅基地、工业用地(原特区内)、工业用地(原特区外)、商服用地、公共管理与公共服务用地、交通运输用地、农用地、以及其他土地(图1)。使用将手机基站属性转换到TAZ属性的方法,本研究将基于手机基站的人口分布转换到9类土地利用地块上,然后分别计算每类土地利用的手机通话位置数据人口估计相对误差。
由表2可知,基于手机通话位置数据,在工作日4个主要活动时间段(包括上午工作时间、下午工作时间、休闲时间和居家时间),不同土地利用类型的人口分布估计相对误差具有显著差异,并且保留通话低频用户与剔除低频用户的偏差随时间变化趋势基本一致。
表2 不同土地利用类型的手机通话数据人口分布估计的相对误差(%)
Tab.2 The relative errors of population distribution estimated by call detail records D2 and D2_sub (exclude low-frequency users) over different land use types (%)
| 9-11时 | 12-17时 | 18-21时 | 22-24时 | 加权平均值 | ||||||||||
|---|---|---|---|---|---|---|---|---|---|---|---|---|---|---|
| D2 | D2_sub | D2 | D2_sub | D2 | D2_sub | D2 | D2_sub | D2 | D2_sub | |||||
| 城镇住宅用地 | 3.7 | 5.7 | 7.1 | 8.9 | -0.9 | 1.6 | -6.1 | -3.7 | 4.8 | 5.5 | ||||
| 农村宅基地 | -16.8 | -16.8 | -16.1 | -16.0 | -19.7 | -18.9 | -21.7 | -20.8 | 18.2 | 17.8 | ||||
| 工业用地(原特区内) | -15.4 | -10.2 | -10.1 | -4.8 | -2.0 | 2.9 | -9.7 | -5.9 | 9.0 | 5.5 | ||||
| 工业用地(原特区外) | -7.4 | -8.7 | -11.0 | -12.2 | -2.6 | -4.5 | 4.6 | 2.9 | 7.0 | 7.9 | ||||
| 商服用地 | 3.6 | 4.3 | 7.3 | 8.3 | 0.0 | 0.8 | 3.5 | 2.7 | 4.1 | 4.6 | ||||
| 公共管理与公共服务用地 | 4.5 | 4.6 | 5.5 | 5.3 | 2.8 | 3.2 | -2.0 | -1.8 | 4.0 | 4.0 | ||||
| 交通运输用地 | 10.7 | 10.6 | 11.2 | 11.2 | 10.6 | 10.4 | 11.5 | 11.4 | 11.0 | 10.9 | ||||
| 农用地 | 4.6 | 3.6 | 1.6 | 0.3 | 7.9 | 6.3 | 11.5 | 10.2 | 5.6 | 4.3 | ||||
| 其他土地 | 4.7 | 3.9 | 3.3 | 2.5 | 6.1 | 5.0 | 6.8 | 5.5 | 4.9 | 3.9 | ||||
| 平均值 | 7.6 | 7.2 | ||||||||||||
给定区域内,基于通话用户量的人口分布相对误差实质体现了该区域通话用户的比例与其他区域的关系。
(1)对于城镇住宅用地,白天工作时段内呈现一定的人口高估,下班休闲时段内则几乎没有误差,夜间10时以后呈现一定的人口低估。这可能是因为在白天工作时段内仍然留在住宅区的人具有相对宽松的环境,接打电话比例相对较高,下班之后大部分工作者回到家中,呈现出与全市平均水平一致的情况,夜间10时以后逐渐进入睡眠,接打电话比例显著减少。
(2)对于农村宅基地,全天各个时段皆呈现显著的人口低估(低估15%~20%)。这可能是因为深圳市的农村宅基地由大量城中村组成,在此活动的手机用户整体收入偏低,接打电话比例显著少于全市平均水平。
(3)对于原特区内工业用地,白天工作时段内呈现显著的人口低估,下班休闲时段内误差较小,夜间10时以后又呈现较为显著的人口低估。这可能是因为深圳市原特区内工业用地以高新产业为主导,在白天工作时段内具有较为严格的工作环境,接打电话比例相对较少,下班之后环境变宽松,工作者接打电话比例呈现出与全市平均水平较为接近的情况,夜间10时以后工作者基本都离开了工作单位,少量仍然留在该区域的人可能是居住在该区域,随着睡眠时间临近,接打电话的比例也显著减少。
(4)对于原特区外工业用地,白天工作时段内呈现显著的人口低估,下班休闲时段内误差较小,夜间10时以后呈现一定的人口高估。这可能是因为深圳市原特区外工业用地以传统产业为主导,在白天工作时段内同样具有较为严格的工作环境,接打电话比例相对较少,下班之后环境变宽松,工作者接打电话比例呈现出与全市平均水平较为接近的情况,夜间10时以后,由于传统产业存在夜班制,留在该区域的人部分仍然处于工作状态,因此他们接打电话的比例相对较高。
(5)对于商服用地,白天工作时段内呈现一定的人口高估,下班休闲时段内则几乎没有误差,夜间10时以后又呈现一定的人口高估。这可能是因为在白天工作时段内在商服区活动的人接打电话比例相对较高,下班之后的时间则大部分回到家中,呈现出与全市平均水平一致的情况,夜间10点以后仍然留在商服区活动的人大部分属于夜间娱乐活动,接打电话比例相对较高。
(6)对于公共管理与公共服务用地,白天工作时段内呈现较小程度的人口高估,下班休闲时段内呈现较小的人口高估,夜间10时以后呈现较小的人口低估,整体而言,在全天各时段均呈现较小的偏差(<6%)。这可能是因为在白天工作时段内在公共服务区活动的人接打电话比例稍微偏高,下班之后的时间则逐渐回到家中,呈现出与全市平均水平较为一致的情况。
(7)对于交通运输用地,全天各个时段皆呈现显著的人口高估(高估10%~12%)。这可能是因为交通运输用地包括了交通集散地,例如机场、火车站、港口等,在此类区域活动的手机用户有较强的通信需要,接打电话比例显著高于全市平均水平。
(8)对于农用地和其他土地,全天各个时段皆呈现出不同程度的人口高估。这可能是因为在此类用地活动的实际人口较少,在空间单位转换过程中,少量的转换误差则会造成此类用地的人口数量偏高。
对于不同土地利用类型,在用户活跃时段,虽然保留通话低频用户与剔除低频用户的偏差随时间变化趋势基本一致,但是,对比二者的加权平均误差会发现,剔除低频用户后的整体偏差会更小。尤其是对于原特区内工业用地(即高新产业主导用地),剔除低频用户后整体偏差会降低约3%。尽管现有文献已经表明剔除低频用户会导致部分常用的移动性测量指标出现偏差[19-21],但本研究表明在使用手机通话位置数据估计活跃时段的人口分布应用中,剔除低频用户的估计结果更好。由此可见,对手机通话位置数据中低频用户的处理方式应该根据研究目的进行合理地处理。
手机通话位置数据已经成为全球范围内广泛使用的人类活动研究数据源,其为高时空分辨率的人口分布估计提供了一种新的途径。在基于手机通话位置数据估计24 h人口分布的适用性分析中,本研究首次结合24 h连续定位的手机信令数据,分别从时间和地理维度量化分析了使用手机通话位置数据估计24 h人口分布的偏差,同时探讨了剔除低频用户对上述偏差的影响。
本研究揭示:
(1)在居民活跃时间段,交通分析小区尺度下(平均半径约为1 km),使用通话用户的分布估计人口分布时,相对误差的中位数在25%~30%之间,保留低频用户与剔除低频用户并没有显著影响。在睡眠时间段,通话用户的空间分布会出现更大的偏差。很多情况下,当研究与应用工作中缺乏高频连续采样的手机信令数据,而只能基于手机通话数据估计人口分布时,对于居民活跃时间段,虽然能够近似估计人口整体分布,但是需要警惕其中可能存在一定的偏差;对于睡眠时间段,由于在此时间段人群的移动性较弱,建议使用通话用户在睡眠时间之前的分布近似的作为整个睡眠期间的人口分布。
(2)城市内部的土地利用类型与通话用户人口估计偏差具有显著的关联,其中一些偏差不容忽视。例如,农村宅基地的人口百分比在全天各个时段均会被严重低估(整体低估约18%);工业用地在白天工作时段也会有较为明显的低估(低估程度在5%~15%之间),并且高新产业用地的低估最为显著;交通运输用地在全天各个时段则均会被显著高估。这对使用手机通话位置数据进行人口估计的应用具有有效的指导意义。例如,在应急疏散的资源分配或者公共设施的配置中,显著的人口低估可能会导致紧急情况下缺乏救援支持或者缺乏正常的公共资源,而依据本研究提供的成果可以通过一定程度的纠偏使空间资源配置更合理。
(3)在保证剔除低频用户后的24 h人口分布与整体用户分布基本一致的情况下,剔除低频用户会略微减小土地利用对人口分布偏差的影响,建议合理剔除低频用户。综上,本研究成果可帮助理解手机通话位置数据在估计高时空分辨率人口分布上的局限性和适用性,为合理使用手机通话位置数据进行相关研究和应用提供科学依据。
今后,为了减小手机通话位置数据稀疏采样带来的偏差,可以考虑在一定程度上补充缺失的轨 迹[21,30]。此外,本研究的结论是基于深圳市得到的,在后续的工作中,可以用其他区域的数据来验证本研究结论的推广性。最后,值得一提的是,出于分析的需要,研究者和应用方总是希望获得更高时空分辨率的手机定位数据,然而近期研究已经指出,即便是匿名的手机通话位置数据也存在不容忽视的隐私泄露风险[31]。因此,只有建立安全的手机数据使用机制,才能既保护用户隐私,又能使用更高时空分辨率的手机数据进行分析,从根本上减少潜在的偏差。
The authors have declared that no competing interests exist.
| [1] |
|
| [2] |
人类活动轨迹的分类、模式和应用研究综述 [J].https://doi.org/10.11820/dlkxjz.2014.07.009 URL Magsci 摘要
各种传感器的应用与发展,如车载GPS、手机、公交卡、银行卡等,记录了人类的活动轨迹。这些海量的人类活动轨迹数据中蕴含着人类行为的时空分布模式。通过对这些轨迹的研究可以挖掘个体轨迹模式,理解人类动力学特征,进而为对轨迹预测、城市规划、交通监测等提供支持。因此,研究各类传感器记录的人类活动轨迹数据成为当前的研究热点。本文对人类活动轨迹的获取与表达方式进行剖析,并将人类的活动轨迹按照采样方式和驱动因素的不同分为基于时间间隔采样、基于位置采样和基于事件触发采样等3类轨迹数据。由于各类轨迹数据均由起始点、锚点和一般节点等构成,因而将轨迹模式挖掘的研究按照锚点、出行范围、形状模式、OD流模式、时间模式等进行组织,研究成果揭示人类活动轨迹在时间、空间的从聚模式、周期性等特点。在此基础上,将人类活动轨迹在城市研究中的应用,按照用户轨迹预测、城市动态景观、城市交通模拟与监控、城市功能单元识别以及城市中其他方面的研究应用进行系统综述,认为人类活动模式挖掘是城市规划、城市交通、公共安全等方面应用的基础。
A review on the classification, patterns and applied research of human mobility trajectory [J].https://doi.org/10.11820/dlkxjz.2014.07.009 URL Magsci 摘要
各种传感器的应用与发展,如车载GPS、手机、公交卡、银行卡等,记录了人类的活动轨迹。这些海量的人类活动轨迹数据中蕴含着人类行为的时空分布模式。通过对这些轨迹的研究可以挖掘个体轨迹模式,理解人类动力学特征,进而为对轨迹预测、城市规划、交通监测等提供支持。因此,研究各类传感器记录的人类活动轨迹数据成为当前的研究热点。本文对人类活动轨迹的获取与表达方式进行剖析,并将人类的活动轨迹按照采样方式和驱动因素的不同分为基于时间间隔采样、基于位置采样和基于事件触发采样等3类轨迹数据。由于各类轨迹数据均由起始点、锚点和一般节点等构成,因而将轨迹模式挖掘的研究按照锚点、出行范围、形状模式、OD流模式、时间模式等进行组织,研究成果揭示人类活动轨迹在时间、空间的从聚模式、周期性等特点。在此基础上,将人类活动轨迹在城市研究中的应用,按照用户轨迹预测、城市动态景观、城市交通模拟与监控、城市功能单元识别以及城市中其他方面的研究应用进行系统综述,认为人类活动模式挖掘是城市规划、城市交通、公共安全等方面应用的基础。
|
| [3] |
Quantifying the impact of human mobility on malaria [J].https://doi.org/10.1126/science.1223467 URL PMID: 3675794 摘要
Human movements contribute to the transmission of malaria on spatial scales that exceed the limits of mosquito dispersal. Identifying the sources and sinks of imported infections due to human travel and locating high-risk sites of parasite importation could greatly improve malaria control programs. Here, we use spatially explicit mobile phone data and malaria prevalence information from Kenya to identify the dynamics of human carriers that drive parasite importation between regions. Our analysis identifies importation routes that contribute to malaria epidemiology on regional spatial scales.
|
| [4] |
Modeling of spatiotemporal distribution of urban population at high resolution -value for risk assessment and emergency management[A]. Konecny M, Zlatanova S, Bandrova T L. Geographic information and cartography for risk and crisis management [M]. |
| [5] |
LandScan USA: a high-resolution geospatial and temporal modeling approach for population distribution and dynamics [J].https://doi.org/10.1007/s10708-007-9105-9 URL [本文引用: 1] 摘要
High-resolution population distribution data are critical for successfully addressing important issues ranging from socio-environmental research to public health to homeland security, since scientific analyses, operational activities, and policy decisions are significantly influenced by the number of impacted people. Dasymetric modeling has been a well-recognized approach for spatial decomposition of census data to increase the spatial resolution of population distribution. However, enhancing the temporal resolution of population distribution poses a greater challenge. In this paper, we discuss the development of LandScan USA, a multi-dimensional dasymetric modeling approach, which has allowed the creation of a very high-resolution population distribution data both over space and time. At a spatial resolution of 3 arc seconds ( 90 m), the initial LandScan USA database contains both a nighttime residential as well as a baseline daytime population distribution that incorporates movement of workers and students. Challenging research issues of disparate and misaligned spatial data and modeling to develop a database at a national scale, as well as model verification and validation approaches are illustrated and discussed. Initial analyses indicate a high degree of locational accuracy for LandScan USA distribution model and data. High-resolution population data such as LandScan USA, which describes both distribution and dynamics of human population, clearly has the potential to profoundly impact multiple domain applications of national and global priority.
|
| [6] |
|
| [7] |
Social Sensing: A new approach to understanding our socioeconomic environments [J].https://doi.org/10.1080/00045608.2015.1018773 URL [本文引用: 1] 摘要
The emergence of big data brings new opportunities for us to understand our socioeconomic environments. We use the term social sensing for such individual-level big geospatial data and the associated analysis methods. The word sensing suggests two natures of the data. First, they can be viewed as the analogue and complement of remote sensing, as big data can capture well socioeconomic features while conventional remote sensing data do not have such privilege. Second, in social sensing data, each individual plays the role of a sensor. This article conceptually bridges social sensing with remote sensing and points out the major issues when applying social sensing data and associated analytics. We also suggest that social sensing data contain rich information about spatial interactions and place semantics, which go beyond the scope of traditional remote sensing data. In the coming big data era, GIScientists should investigate theories in using social sensing data, such as data representativeness and quality, and develop new tools to deal with social sensing data.
|
| [8] |
基于手机数据识别上海中心城的城市空间结构 [J].
Understanding urban spatial structure of Shanghai central city based on mobile phone data [J].
|
| [9] |
|
| [10] |
基于手机信令数据的上海市不同等级商业中心商圈的比较——以南京东路、五角场、鞍山路为例 [J].https://doi.org/10.16361/j.upf.201503007 URL 摘要
利用手机信令数据,以上海市南京东路、五角场和鞍山路三个不同等级的商业中心为例对商圈进行合理地划分,分析和比较了不同等级商业中心的消费者数量的空间分布特征,并采取一定的可视化手段和空间统计指标对三个商业中心的等级性进行空间抽象,深入探讨不同等级商业中心的消费者空间分布特点.研究表明,不同等级商业中心在消费者分布范围、空间集聚性、对称性方面都存在较大差异.整体来看,从大范围覆盖的广域型高等级中心到依托局部高密度的地缘型低等级中心,形成了一种有序的商业中心空间体系.另外,也对这一特征的深层机制进行了剖析,并简要探讨了对商业网点规划的应用价值.
Comparison of retail trade areas of retail centers with different hierarchical levels: A case study of east Nanjing road, Wujiaochang, Anshan Road in Shanghai [J].https://doi.org/10.16361/j.upf.201503007 URL 摘要
利用手机信令数据,以上海市南京东路、五角场和鞍山路三个不同等级的商业中心为例对商圈进行合理地划分,分析和比较了不同等级商业中心的消费者数量的空间分布特征,并采取一定的可视化手段和空间统计指标对三个商业中心的等级性进行空间抽象,深入探讨不同等级商业中心的消费者空间分布特点.研究表明,不同等级商业中心在消费者分布范围、空间集聚性、对称性方面都存在较大差异.整体来看,从大范围覆盖的广域型高等级中心到依托局部高密度的地缘型低等级中心,形成了一种有序的商业中心空间体系.另外,也对这一特征的深层机制进行了剖析,并简要探讨了对商业网点规划的应用价值.
|
| [11] |
从大规模短期规则采样的手机定位数据中识别居民职住地 [J].https://doi.org/10.13203/j.whugis20140085 URL 摘要
使用大规模手机定位数据获取居民职住地分布是大数据趋势下城市研究的新兴技术.然而,现有的研究主要使用了长期不规则稀疏采样的手机通话数据,对短期规则采样的手机定位数据缺乏尝试.基于大规模短期规则采样的手机定位数据,提出了一种居民职住地识别的方法.这是首次从大规模短期规则采样的手机定位数据中进行居民职住地识别的尝试,并对识别结果进行了较全面的验证.该研究成果为职住平衡等相关城市问题研究探讨了一种新型大规模数据源的可行性,在低成本大幅度提高相关研究的样本代表性和分析结果可靠性上具有重要意义.
Identifying home-work locations from short-term, large-scale, and regularly sampled mobile phone tracking data .https://doi.org/10.13203/j.whugis20140085 URL 摘要
使用大规模手机定位数据获取居民职住地分布是大数据趋势下城市研究的新兴技术.然而,现有的研究主要使用了长期不规则稀疏采样的手机通话数据,对短期规则采样的手机定位数据缺乏尝试.基于大规模短期规则采样的手机定位数据,提出了一种居民职住地识别的方法.这是首次从大规模短期规则采样的手机定位数据中进行居民职住地识别的尝试,并对识别结果进行了较全面的验证.该研究成果为职住平衡等相关城市问题研究探讨了一种新型大规模数据源的可行性,在低成本大幅度提高相关研究的样本代表性和分析结果可靠性上具有重要意义.
|
| [12] |
Mobile Landscapes: Using location data from cell phones for urban analysis [J].
|
| [13] |
城市人群聚集消散时空模式探索分析——以深圳市为例 [J].https://doi.org/10.3724/SP.J.1047.2016.00486 URL Magsci [本文引用: 1] 摘要
城市中人群的移动是带有目的性的,城市空间结构功能也存在差异,导致人群在城市中出现聚集或消散的现象,而且该现象会随着时间不断变化。本文基于海量的手机位置数据,以深圳市为例,采用自相关分析识别出城市中人群聚集与消散的区域,然后将这些区域一天中人群聚散组合成时间序列矩阵,采用自组织图聚类方法(SOM)进行聚类得到9种典型的人群聚集、消散时空模式,结合土地利用现状数据,分析解释了每种聚散模式最可能出现的土地利用组合。该研究从聚集和消散的角度探索了城市人群移动的时空模式,进一步帮助理解城市不同区域人群的移动模式以及与城市空间结构功能之间的关系,对城市规划、交通管理具有参考和指导意义。
Exploring urban human spatio-temporal convergence-dispersion patterns: a case study of Shenzhen city. Journal of Geo-information https://doi.org/10.3724/SP.J.1047.2016.00486 URL Magsci [本文引用: 1] 摘要
城市中人群的移动是带有目的性的,城市空间结构功能也存在差异,导致人群在城市中出现聚集或消散的现象,而且该现象会随着时间不断变化。本文基于海量的手机位置数据,以深圳市为例,采用自相关分析识别出城市中人群聚集与消散的区域,然后将这些区域一天中人群聚散组合成时间序列矩阵,采用自组织图聚类方法(SOM)进行聚类得到9种典型的人群聚集、消散时空模式,结合土地利用现状数据,分析解释了每种聚散模式最可能出现的土地利用组合。该研究从聚集和消散的角度探索了城市人群移动的时空模式,进一步帮助理解城市不同区域人群的移动模式以及与城市空间结构功能之间的关系,对城市规划、交通管理具有参考和指导意义。
|
| [14] |
Urban sensing using mobile phone network data: A survey of research [J].https://doi.org/10.1145/2655691 URL [本文引用: 1] 摘要
Abstract The recent development of telecommunication networks is producing an unprecedented wealth of information and, as a consequence, an increasing interest in analyzing such data both from telecoms and from other stakeholders' points of view. In particular, mobile phone datasets offer access to insights into urban dynamics and human activities at an unprecedented scale and level of detail, representing a huge opportunity for research and real-world applications. This article surveys the new ideas and techniques related to the use of telecommunication data for urban sensing. We outline the data that can be collected from telecommunication networks as well as their strengths and weaknesses with a particular focus on urban sensing. We survey existing filtering and processing techniques to extract insights from this data and summarize them to provide recommendations on which datasets and techniques to use for specific urban sensing applications. Finally, we discuss a number of challenges and open research areas currently being faced in this field. We strongly believe the material and recommendations presented here will become increasingly important as mobile phone network datasets are becoming more accessible to the research community.
|
| [15] |
A survey of results on mobile phone datasets analysis [J].https://doi.org/10.1140/epjds/s13688-015-0046-0 URL [本文引用: 1] 摘要
In this paper, we review some advances made recently in the study of mobile phone datasets . This area of research has emerged a decade ago, with the increasing availability of large-scale anonymized datasets, and has grown into a stand-alone topic. We survey the contributions made so far on the social networks that can be constructed with such data, the study of personal mobility , geographical partitioning , urban planning , and help towards development as well as security and privacy issues .
|
| [16] |
人类行为时空特性的统计力学 [J].https://doi.org/10.3969/j.issn.1001-0548.2013.04.001 URL [本文引用: 1] 摘要
人类行为的定量化分析,特别是时空统计规律的挖掘和建模,是当前统计物理与复杂性科学研究的热点。对人类行为的深入理解,有助于解释若干复杂的社会经济现象,并在舆情监控、疾病防治、交通规划、呼叫服务、信息推荐等方面产生应用价值。该文综述人类行为时间和空间特性方面的研究进展,内容包括人类行为时间特性的实证分析和建模,人类行为空间特性的实证分析和建模,以及人类行为统计分析的应用研究。该文还将评述当前研究存在的亮点和不足,指出若干亟待解决的重大理论和实际问题。
Statistical mechanics on temporal and spatial activities of human [J].https://doi.org/10.3969/j.issn.1001-0548.2013.04.001 URL [本文引用: 1] 摘要
人类行为的定量化分析,特别是时空统计规律的挖掘和建模,是当前统计物理与复杂性科学研究的热点。对人类行为的深入理解,有助于解释若干复杂的社会经济现象,并在舆情监控、疾病防治、交通规划、呼叫服务、信息推荐等方面产生应用价值。该文综述人类行为时间和空间特性方面的研究进展,内容包括人类行为时间特性的实证分析和建模,人类行为空间特性的实证分析和建模,以及人类行为统计分析的应用研究。该文还将评述当前研究存在的亮点和不足,指出若干亟待解决的重大理论和实际问题。
|
| [17] |
The origin of bursts and heavy tails in human dynamics [J].https://doi.org/10.1038/nature03459 URL PMID: 15889093 摘要
The dynamics of many social, technological and economic phenomena are driven by individual human actions, turning the quantitative understanding of human behaviour into a central question of modern science. Current models of human dynamics, used from risk assessment to communications, assume that human actions are randomly distributed in time and thus well approximated by Poisson processes. In contrast, there is increasing evidence that the timing of many human activities, ranging from communication to entertainment and work patterns, follow non-Poisson statistics, characterized by bursts of rapidly occurring events separated by long periods of inactivity. Here I show that the bursty nature of human behaviour is a consequence of a decision-based queuing process: when individuals execute tasks based on some perceived priority, the timing of the tasks will be heavy tailed, with most tasks being rapidly executed, whereas a few experience very long waiting times. In contrast, random or priority blind execution is well approximated by uniform inter-event statistics. These finding have important implications, ranging from resource management to service allocation, in both communications and retail.
|
| [18] |
Uncovering individual and collective human dynamics from mobile phone records [J]. |
| [19] |
Understanding the bias of call detail records in human mobility research [J].https://doi.org/10.1080/13658816.2015.1137298 URL [本文引用: 2] 摘要
In recent years, call detail records (CDRs) have been widely used in human mobility research. Although CDRs are originally collected for billing purposes, the vast amount of digital footprints generated by calling and texting activities provide useful insights into population movement. However, can we fully trust CDRs given the uneven distribution of people's phone communication activities in space and time? In this article, we investigate this issue using a mobile phone location dataset collected from over one million subscribers in Shanghai, China. It includes CDRs (similar to 27%) plus other cellphone-related logs (e.g., tower pings, cellular handovers) generated in a workday. We extract all CDRs into a separate dataset in order to compare human mobility patterns derived from CDRs vs. from the complete dataset. From an individual perspective, the effectiveness of CDRs in estimating three frequently used mobility indicators is evaluated. We find that CDRs tend to underestimate the total travel distance and the movement entropy, while they can provide a good estimate to the radius of gyration. In addition, we observe that the level of deviation is related to the ratio of CDRs in an individual's trajectory. From a collective perspective, we compare the outcomes of these two datasets in terms of the distance decay effect and urban community detection. The major differences are closely related to the habit of mobile phone usage in space and time. We believe that the event-triggered nature of CDRs does introduce a certain degree of bias in human mobility research and we suggest that researchers use caution to interpret results derived from CDR data.
|
| [20] |
Are call detail records biased for sampling human mobility? [J].https://doi.org/10.1145/2412096.2412101 URL [本文引用: 1] 摘要
Call detail records (CDRs) have recently been used in studying different aspects of human mobility. While CDRs provide a means of sampling user locations at large population scales, they may not sample all locations proportionate to the visitation frequency of a user, owing to sparsity in time and space of voice-calls, thereby introducing a bias. Also, as the rate of sampling is inherently dependent on the calling frequencies of an individual, high voice-call activity users are often chosen for conducting a meaningful study. Such a selection process can, inadvertently, lead to a biased view as high frequency callers may not always be representative of an entire population. With the advent of 3G technology and wide adoption of smart-phones, cellular devices have become versatile end-hosts. As the data accessed on these devices does not always require human initiation, it affords us with an unprecedented opportunity to validate the utility of CDRs for studying human mobility. In this work, we investigate various metrics for human mobility studied in literature for over a million cellular users in the San Francisco bay-area, for over a month. Our findings reveal that although the voice-call process does well to sample significant locations, such as home and work, it may in some cases incur biases in capturing the overall spatio-temporal characteristics of individual human mobility. Additionally, we motivate an "artificially" imposed sampling process, vis-a-vis the voice-call process with the same average intensity. We observe that in many cases such an imposed sampling process yields better performance results based on the usual metrics like entropies and marginal distributions used often in literature.
|
| [21] |
Filling the gaps on the completion of Sparse call detail records for mobility analysis [C]. |
| [22] |
Dynamic population mapping using mobile phone data [J].https://doi.org/10.1073/pnas.1408439111 URL [本文引用: 3] 摘要
During the past few decades, technologies such as remote sensing, geographical information systems, and global positioning systems have transformed the way the distribution of human population is studied and modeled in space and time. However, the mapping of populations remains constrained by the logistics of censuses and surveys. Consequently, spatially detailed changes across scales of days, weeks, or months, or even year to year, are difficult to assess and limit the application of human population maps in situations in which timely information is required, such as disasters, conflicts, or epidemics. Mobile phones (MPs) now have an extremely high penetration rate across the globe, and analyzing the spatiotemporal distribution of MP calls geolocated to the tower level may overcome many limitations of census-based approaches, provided that the use of MP data is properly assessed and calibrated. Using datasets of more than 1 billion MP call records from Portugal and France, we show how spatially and temporarily explicit estimations of population densities can be produced at national scales, and how these estimates compare with outputs produced using alternative human population mapping methods. We also demonstrate how maps of human population changes can be produced over multiple timescales while preserving the anonymity of MP users. With similar data being collected every day by MP network providers across the world, the prospect of being able to map contemporary and changing human population distributions over relatively short intervals exists, paving the way for new applications and a near real-time understanding of patterns and processes in human geography.
|
| [23] |
Towards estimating urban population distributions from mobile call data [J].https://doi.org/10.1080/10630732.2012.715479 URL Magsci [本文引用: 7] 摘要
Today, large-volume mobile phone call datasets are widely applied to investigate the spatio-temporal characteristics of human urban activity. This paper discusses several fundamental issues in estimating population distributions based on mobile call data. By adopting an individual-based call activity dataset that consists of nearly two million mobile subscribers who made over one hundred million communications over seven consecutive days, we explore the relationships among the Erlang values, the number of calls, and the number of active mobile subscribers. Then, the LandScan population density dataset is introduced to evaluate the process of estimating the population. The empirical findings indicate that: (1) Temporal variation exists in the relation between the Erlang values and the number of calls; (2) The number of calls is linearly proportional to the number of active mobile subscribers; (3) The proportion between the mobile subscribers and the actual total population varies in different areas, thus failing to represent the underlying population. Hence, the call activity reflects "activity intensity" rather than population distribution. The Erlang is a defective indicator of population distribution, whereas the number of calls serves as a better measure. This research provides an explicit clarification with respect to using call activity data for estimating population distribution.
|
| [24] |
|
| [25] |
Unravelling daily human mobility motifs [J].https://doi.org/10.1098/rsif.2013.0246 URL PMID: 23658117 [本文引用: 1] 摘要
Human mobility is differentiated by time scales. While the mechanism for long time scales has been studied, the underlying mechanism on the daily scale is still unrevealed. Here, we uncover the mechanism responsible for the daily mobility patterns by analysing the temporal and spatial trajectories of thousands of persons as individual networks. Using the concept of motifs from network theory, we find only 17 unique networks are present in daily mobility and they follow simple rules. These networks, called here motifs, are sufficient to capture up to 90 per cent of the population in surveys and mobile phone datasets for different countries. Each individual exhibits a characteristic motif, which seems to be stable over several months. Consequently, daily human mobility can be reproduced by an analytically tractable framework for Markov chains by modelling periods of high-frequency trips followed by periods of lower activity as the key ingredient.
|
| [26] |
Understanding aggregate human mobility patterns using passive mobile phone location data: a home-based approach [J].https://doi.org/10.1007/s11116-015-9597-y URL [本文引用: 1] 摘要
Advancements of information, communication and location-aware technologies have made collections of various passively generated datasets possible. These datasets provide new opportunities to understand human mobility patterns at a low cost and large scale. This study presents a home-based approach to understanding human mobility patterns based on a large mobile phone location dataset from Shenzhen, China. First, we estimate each individual’s “home” anchor point, and a modified standard distance ( $$S_{D}^{\prime }$$ S D ′ ) is proposed to measure the spread of each individual’s activity space centered at this “home” anchor point. We then derive aggregate mobility patterns at mobile phone tower level to describe the distance distribution of $$S_{D}^{\prime }$$ S D ′ for people who share the same “home” anchor point. A hierarchical clustering algorithm is performed and the spatial distributions of the derived clusters are analyzed to highlight areas with similar aggregate human mobility patterns. The results suggest that 43 % of the population sample travelled within a short distance ( $$S_{D}^{\prime } \le 1 \;{\text{km}}$$ S D ′ ≤ 1 km ) during the 13-day study period while 23.9 % of them were associated with a large activity space ( $$S_{D}^{\prime } \ge 5 \;{\text{km}}$$ S D ′ ≥ 5 km ). The geographical differences of people’s mobility patterns in Shenzhen are evident. Areas with a large proportion of people who have a small activity space mainly locate in the northern part of Shenzhen such as Baoan and Longgang districts. In the southern part where the economy is highly developed, the percentage of people with a larger activity space is higher in general. The findings could offer useful implications on policy and decision making. The proposed approach can also be used in other studies involving similar spatiotemporal datasets for travel behavior and policy analysis. Copyright Springer Science+Business Media New York 2015
|
| [27] |
Measurements of POI-based mixed use and their relationships with neighbourhood vibrancy [J].https://doi.org/10.1080/13658816.2016.1220561 URL 摘要
Abstract Although mixed use is an emerging strategy that has been widely accepted in urban planning for promoting neighbourhood vibrancy, there is no consensus on how to quantitatively measure the mix and the effects of mixed use on neighbourhood vibrancy. Shannon entropy, the most commonly used diversity measurement in assessing mixed use, has been found to be inadequate in measuring the multifaceted, multidimensional characteristics of mixed use. And lack of data also makes it difficult to find the relationship between mixed use and neighbourhood vibrancy. However, the recent availability of new sources including mobile phone data and Point of Interest (POI) data have made it possible to develop new indices of mixed use and neighbourhood vibrancy to analyse their relationships. Taking advantage of these emerging new data sources, this study used the numbers of mobile phone users in a 24-hour period as a proxy of neighbourhood vibrancy and used POIs from a navigation database to develop a series of mixed-use indicators that can better reflect the multifaceted, multidimensional characteristics of mixed-use neighbourhoods. The Hill numbers, a unified form of diversity measurement used in ecological literature that includes richness, entropy, and the Simpson index, are used to measure the degrees of mixed use. Using such fine-grained data sets and the Hill numbers allowed us to obtain better insights into the relationship between mixed use and neighbourhood vibrancy. Four models varying in POI measurements that reflect different dimensions of mixed use were presented. The results showed that either POI density or entropy can explain approximately 1% of neighbourhood vibrancy, while POI richness contributes significantly in improving neighbourhood vibrancy. The results also revealed that the entropy has limitations as a measure for representing mixed use and demonstrated the necessity of adopting a set of more appropriate measurements for mixed use. Increasing the number of POIs has limited power to improve neighbourhood vibrancy compared with encouraging the mixing of complementary POIs. These exploratory findings may be useful for adjusting mixed-use assessments and to help guide urban planning and neighbourhood design. 2016 The Author(s). Published by Informa UK Limited, trading as Taylor & Francis Group.
|
| [28] |
城市海量手机用户停留时空分异分析——以深圳市为例 [J].https://doi.org/10.3724/SP.J.1047.2015.00197 URL Magsci [本文引用: 1] 摘要
识别海量手机数据中蕴含的行为模式,是地理学的一个研究热点与难点。目前,较多研究针对手机用户移动特征开展,而对停留及其模式的研究则相对较少;其时空分异规律对理解城市人群动态,甚至优化城市系统至关重要。本文根据人们日常时空约束条件定义了手机用户停留,提出了基于海量手机位置数据的手机用户停留模式的提取方法,以深圳市约790万个匿名手机用户一天的海量手机位置数据为例,识别出了覆盖约98%用户的典型停留模式,并结合该城市土地利用的空间分布与分异特征,剖析不同停留模式的手机用户空间分异特征和城市不同区域停留次数的时段分异特征。研究发现:(1)15种停留模式可覆盖约98%的手机用户,而且其一天不同的停留位置数量不超过4个;(2)15种停留模式手机用户在城市区域空间上的分布存在分异现象,严重受制于土地利用的空间分布;(3)城市不同区域停留次数的时段分异特征与该区域常住人口、人口密度,以及区域主要职能和性质存在较强的相关性。研究结论对理解城市手机用户行为模式的群体特征有积极的意义,对城市土地利用的科学决策和城市交通规划与预测有重要参考价值。
https://doi.org/10.3724/SP.J.1047.2015.00197 URL Magsci [本文引用: 1] 摘要
识别海量手机数据中蕴含的行为模式,是地理学的一个研究热点与难点。目前,较多研究针对手机用户移动特征开展,而对停留及其模式的研究则相对较少;其时空分异规律对理解城市人群动态,甚至优化城市系统至关重要。本文根据人们日常时空约束条件定义了手机用户停留,提出了基于海量手机位置数据的手机用户停留模式的提取方法,以深圳市约790万个匿名手机用户一天的海量手机位置数据为例,识别出了覆盖约98%用户的典型停留模式,并结合该城市土地利用的空间分布与分异特征,剖析不同停留模式的手机用户空间分异特征和城市不同区域停留次数的时段分异特征。研究发现:(1)15种停留模式可覆盖约98%的手机用户,而且其一天不同的停留位置数量不超过4个;(2)15种停留模式手机用户在城市区域空间上的分布存在分异现象,严重受制于土地利用的空间分布;(3)城市不同区域停留次数的时段分异特征与该区域常住人口、人口密度,以及区域主要职能和性质存在较强的相关性。研究结论对理解城市手机用户行为模式的群体特征有积极的意义,对城市土地利用的科学决策和城市交通规划与预测有重要参考价值。
|
| [29] |
Understanding individual human mobility patterns [J].https://doi.org/10.1038/nature06958 URL PMID: 18528393 [本文引用: 1] 摘要
Despite their importance for urban planning, traffic forecasting and the spread of biological and mobile viruses, our understanding of the basic laws governing human motion remains limited owing to the lack of tools to monitor the time-resolved location of individuals. Here we study the trajectory of 100,000 anonymized mobile phone users whose position is tracked for a six-month period. We find that, in contrast with the random trajectories predicted by the prevailing L vy flight and random walk models, human trajectories show a high degree of temporal and spatial regularity, each individual being characterized by a time-independent characteristic travel distance and a significant probability to return to a few highly frequented locations. After correcting for differences in travel distances and the inherent anisotropy of each trajectory, the individual travel patterns collapse into a single spatial probability distribution, indicating that, despite the diversity of their travel history, humans follow simple reproducible patterns. This inherent similarity in travel patterns could impact all phenomena driven by human mobility, from epidemic prevention to emergency response, urban planning and agent-based modelling.
|
| [30] |
Modeling and visualizing regular human mobility patterns with uncertainty: An example using twitter data [J].https://doi.org/10.1080/00045608.2015.1081120 URL [本文引用: 1] 摘要
Traditional space–time paths show the spatiotemporal trajectories of individuals in one to several days. Based on data for such short periods, these space–time paths might not be able to show regular activity patterns, which are pertinent to various types of planning and policy analysis. Travel data gathered for longer periods might capture regular activity patterns, but footprints captured by these data also include irregular activities, introducing noises or uncertainty. Our objective is to determine the representative spatiotemporal trajectories of individuals, accounting for stochastic disturbances and spatiotemporal variability, but using activity data with longer duration. Therefore, we explore using Twitter data, which have relatively low and irregular spatial and temporal resolutions. This article introduces a methodology to construct individual representative space–time paths using various aggregation and spatiotemporal clustering techniques. To depict and visualize spatiotemporal trajectories with uncertain information, we propose space–time cones of variable sizes to reflect the spatial precision of the paths and use colors on the cones to represent the confidence level. To illustrate the proposed methodology, we use the geo-tagged tweets for an extended period. Our analysis indicates that the representative space–time path reasonably describes an individual's regular activity patterns. As visual elements, cones and cone colors effectively show the varying geographical precision along the path and changing certainty levels across different path segments, respectively.
|
| [31] |
Re-identification risk versus data utility for aggregated mobility research using mobile phone location data [J].https://doi.org/10.1371/journal.pone.0140589 URL PMID: 26469780 [本文引用: 1] 摘要
Mobile phone location data is a newly emerging data source of great potential to support human mobility research. However, recent studies have indicated that many users can be easily re-identified based on their unique activity patterns. Privacy protection procedures will usually change the original data and cause a loss of data utility for analysis purposes. Therefore, the need for detailed data for activity analysis while avoiding potential privacy risks presents a challenge. The aim of this study is to reveal the re-identification risks from a Chinese city mobile users and to examine the quantitative relationship between re-identification risk and data utility for an aggregated mobility analysis. The first step is to apply two reported attack models, the top N locations and the spatio-temporal points, to evaluate the re-identification risks in Shenzhen City, a metropolis in China. A spatial generalization approach to protecting privacy is then proposed and implemented, and spatially aggregated analysis is used to assess the loss of data utility after privacy protection. The results demonstrate that the re-identification risks in Shenzhen City are clearly different from those in regions reported in Western countries, which prove the spatial heterogeneity of re-identification risks in mobile phone location data. A uniform mathematical relationship has also been found between re-identification risk (x) and data (y) utility for both attack models: y = -axb+c, (a, b, c>0; 0<x<1), where the exponent b increases with the background knowledge of the attackers. The discovered mathematical relationship provides data publishers with useful guidance on choosing the right tradeoff between privacy and utility. Overall, this study contributes to a better understanding of re-identification risks and a privacy-utility tradeoff benchmark for improving privacy protection when sharing detailed trajectory data.
|

/
| 〈 |
|
〉 |