王雪峰 , 冯雪, 张宇
WANG Xuefeng, FENG Xue, WANG Wuxia
通讯作者:
版权声明: 2018 《地球信息科学学报》编辑部 《地球信息科学学报》编辑部 所有
基金资助:
作者简介:
作者简介:王雪峰(1992-),男,山西运城人,硕士生,主要从事海岸带遥感、GIS应用研究。E-mail: wangxf@lreis.ac.cn
展开
摘要
近年来,水产养殖用地分布广泛,但由于其在影像上所表现的复杂性和不均匀性,造成该用地类型提取中的困难,尤其针对中分辨率遥感影像。对此,本文提出了一种基于纹理和空间特征的养殖用地提取方法,该方法主要包括3个步骤:首先,利用纹理熵和归一化差异水体指数NDWI实现水产养殖用地的粗提取;然后,依据相邻地物间的关系实现同类型地物合并;最后,本文构建一种相对宽度作为地物的近似宽度,再次利用NDWI实现水产养殖用地的准确识别。本文以越南万丰湾为研究区域,以Landat-8融合影像(融合后的像元大小为15 m)的目视解译结果为标准,对本文方法与最小距离法分类结果进行比较。实验结果表明,该方法的精度可达91.13%,远高于传统的面向对象方法,并且所提方法的错误率和虚假率分别为0.09%和8.87%,表明了该方法可靠性,因而该方法可为基于中分辨率影像的地物类型提取提供一种有效手段。
关键词:
Abstract
Aquaculture land has become widely distributed in recent years. It's difficult to extract aquaculture land for its complexity and inhomogeneity, especially from the medium spatial resolution satellite images. In this paper, we present an automated method containing three main steps to extract aquaculture land from medium spatial resolution images. First, the texture entropy and Normalized Difference Water Index(NDWI) were used to extracted aquaculture land initially. Then, the interrelations of neighboring objects were utilized to merge objects. Finally, a relative new feature called relative width was proposed, and the NDWI was used again to separate the aquaculture land accurately. This method was applied to Van fong Bay, Vietnam using Landsat-8 images whith pixel size of 15m after image fusion. Manual interpretation was conducted in the same region to support and validate our results of the minimum distance method. The result shows that the precision of the proposed method is 91.13%, which is far higher than the traditional object-oriented method. And the missing rate and false rate of the proposed method are 0.09% and 8.87%, respectively, indicating that the proposed method is reliable. This method provides an accurate and efficient means for fast land use mapping from medium resolution imagery.
Keywords:
养殖用地是沿海地区典型的土地利用类型,是该地区是食物、收入和生计的重要来源[1,2]。近30年来,随着水产品市场需求大幅增加,特别是中国、越南、印度等发展中国家[3,4],水产养殖用地面积迅速增长。大面积的沼泽和海滩已被水产养殖用地取代,加剧了沿海生态系统的脆弱性,并威胁着海上交通安全[5]。水产养殖用地评估对促进沿海地区的经济发展,保护生态环境至关重要。因此,如何有效和准确地提取水产养殖用地已成为促进沿海地区经济发展的一个重要方面[6,7,8]。
当前研究主要利用遥感影像来提取水产养殖用地[6,7,8,9,10,11,12,13,14,15,16],此类方法大多基于高分辨率遥感影像,具有较高的提取精度[10,11,12,13,14],但在中分辨率影像中表现不佳。与高分辨率影像相比,在相同区域,中等分辨率影像一般具有较少的数据量和较多的时间信息,并且中分辨率影像对于全球研究人员和用户而言多数是免费的(如Landsat系列),因而具有较大应用价值。同时,中分辨率影像保留了足够的纹理特征和视觉细节来识别水产养殖用地。更重要的是,中分辨率影像非常适合于长时间动态监测,且通常具有较大的空间覆盖范围[15]。
目前水产养殖提取方法的研究多采用目视解译[16]而不是自动方法,主要在于自动方法通常难以满足精度要求。然而,基于中分辨率影像的水产养殖用地的自动化提取仍然取得了一些进展。早期方法主要是基于纹理和光谱特征的像元级分类算法[17,18]。一般情况下,水产养殖用地是由堤防和池塘组成,因而造成水产养殖用地提取范围与实际中的差异,尤其是一些像元具有与水体相似的光谱特征。因此,基于像元的分类算法通常难以区分具有相似光谱特征的不同像元。此外,基于像元的分类算法还产生许多细小斑块,如椒盐现象,该误差降低了分类精度。
相比之下,利用面向对象的方法可以大大提高分类精度。面向对象的分类方法可以有效地避免碎片和斑点噪声,因为该方法将一组均匀像元作为最小分类单位;此外该方法充分考虑了地物的不同特征,如光谱特征、形状特征和邻域关系等实现地物分类[19],因而具有较为广泛的应用[20,21,22]。在中分辨率影像中,可依据形状指数区分养殖池与水体[23]。然而,中分辨率影像中的养殖池由于具有较低的空间分辨率,因而形状特征较为模糊,导致不同的特征可以表现为相同的形状,因此仅利用形状指数通常难以处理中分辨率影像。另外,还可利用监督分类方法来提取地物信息,包括支持向量机[24]、隶属函数[25]、随机森林[26]等,然而这些方法通常在高分辨率影像中具有较高精度。
在影像中,纹理特征可用于对象识别、检测和定位等方面。在影像分类中局部方差较小时,光谱值可作为主导因素。水产养殖用地一般具有较大的空间覆盖范围,显示出较大的差异性,表明纹理可有效提取水产养殖用地。然而,当前仍然缺乏相关的方法来有效区别具有与目标地物相似质地或光谱的水体,尤其在水陆交界区域,上述方法均难以获取较高的分类精度。因此,本文提出了一种基于纹理和空间特征的养殖用地提取方法,综合考虑了影像的纹理、空间和光谱特征,可较好的解决以上方法的局限性,并提高了提取精度,以下将对该方法进行详细论述。
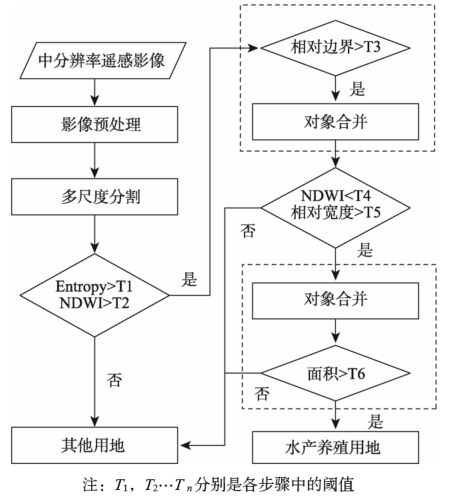
本文水产养殖用地提取方法的流程如图1所示,该流程主要包括3个阶段:① 初步提取水产养殖用地;② 依据相邻对象间的关系进行同类型地物合并;③ 准确提取水产养殖用地,而每个阶段的实现将在下文中分别予以详细说明。
为评估该方法的可行性,本文选取越南中部12°20'~12°48' N和109°11'~109°28' E之间的万丰湾为研究区域。海湾通常可以减少波浪和风暴的影响,为水产养殖发展提供一个稳定的内部环境,因而该区域沿岸分布有大面积的水产养殖用地。本文使用覆盖该区域的Landsat-8影像,其拍摄时间为2015年4月16日。首先进行影像的预处理(包括辐射校正、影像融合和云去除),以消除影像中的噪声并提高其质量,最后得到空间分辨率为15m的融合影像。
该区域中水产养殖用地主要位于海滩,一般由数个矩形养殖池组成。养殖池面积500~2000 m2,长度在70 ~120 m之间,宽度在40~70 m之间。养殖池一般呈规则格网分布,并围绕有堤防。在Landsat-8影像中,养殖池的长度大约等于5个像元,在池塘提取时边缘常呈现锯齿状。
本节主要采用光谱和纹理特征相结合的多分辨率影像分割方法,以实现水产养殖用地的粗提取。
2.2.1 多分辨率分割技术
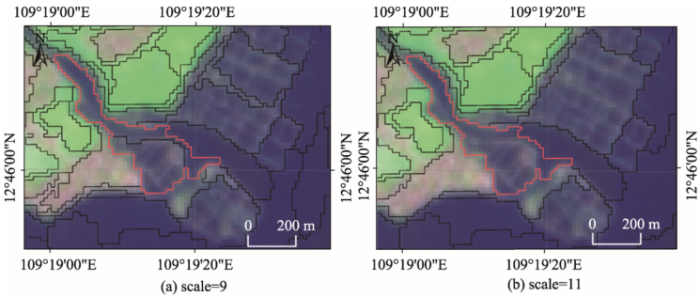
本文使用多分辨率分割技术,对具有均匀光谱特征的像元进行分组。影像分割是面向对象分类方法的基础,该方法基于统计均匀性规则将影像域划分为子域。分割是从单像元开始,然后自下而上实现区域合并。该方法的实现需要3个参数:尺度、平滑度和紧凑度[27],其中尺度对结果影响最大[28]。较大的分割尺度可将水产养殖用地和水体组合成一个对象,较小的分割可导致地物的破碎,而分割尺度主要由影像的空间分辨率和养殖池的大小决定,最优尺度的选择通常需经过多次实验验证。通过实验发现,如果分割尺度大于10,则水产养殖用地容易与河流,海滩等地物混淆(图2),因此本文选取9作为最佳分割尺度。
2.2.2 提取水产养殖用地
水产养殖用地的粗提取主要采用了纹理熵值和NDWI相结合的方法。
(1)灰度共生矩阵(GLCM)
GLCM主要用于描述纹理特征。对于任意水平方向上有M个像元且垂直方向有N个像元的影像,令(x,y)为影像中的任意像元位置,f(x,y)为像元(x,y)的像元值,因此M×N是整个像元单元集合。灰度共生矩阵可表示为相邻像元之间的角度关系的函数以及它们之间的距离的函数,由Haralick定义[29]为如下形式:
P(i,j,d,a)=#{(x1,y1), (x2,y2)∈M×N|x1-x2=p,y1-y2=q,f(x1,y1)=I,f(x1,y2)=j}(1)
式中:#表示集合中元素的数量;(x1,y1),(x2,y2)表示影像中任意2个像元位置;i和j表示像元值;p和q的值由距离d和角度a决定。
因此,空间纹理分析主要涉及以下变量:如果窗口太小,则难以包含足够的信息来进行准确的分析。经过多次实验,本文选择5×5滑动窗口大小进行分析,且所有数据均置于相同条件下分析其纹理特征。实验发现影像的第六波段可有效识别水产养殖用地,因而被选为输入波段。本文分别计算了0°,45°,90°,135°时的GLCM。然后对4个方向 的矩阵值进行了平均,并根据GLCM特征计算了 其熵。
(2)基于熵算法的共生矩阵
熵通常与随机变量相关联,是对影像信息量的度量,可利用熵反映纹理特征。因此本文利用以下公式[30]计算水产养殖用地的纹理熵值:
式中:i和j代表像元所在的行和列;P(i,j)是指灰度共生矩阵;M、N分别指影像像元行数和列数。
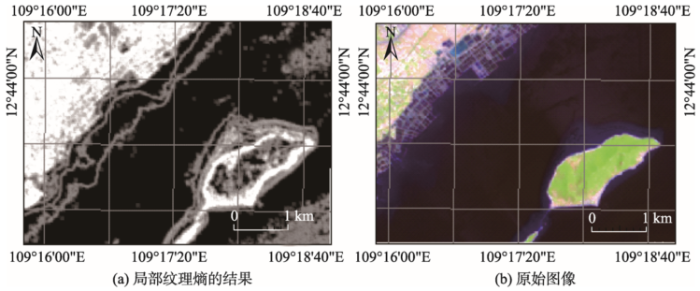
图3显示了纹理熵计算结果,较高的灰度值表明其具有较大的熵值。该图表明,水产养殖用地熵值明显大于水体熵值,具有明显的边界。通过多次实验验证,本文设定纹理熵的区分阈值T1=2。
(3)归一化差异水体指数(NDWI)
归一化差异水体指数是最常用的水体提取模型[31,32,33],由Bo-CaiGao[34]最先提出。
式中:Green和NIR分别是绿色和NIR通道的反射率。
一般情况下,NDWI大小因土地利用类型而异,可用于沿海地区地物识别:海水的NDWI通常高于0.5;而旱地的NDWI大多数情况下小于0.15。然而,包含养殖池和堤防的水产养殖对象由于混合像元的存在而难以准确分离。虽然养殖池和堤防的NDWI间具有显著的差异性,但其交界处的像元存在一定重叠性,该部分像元将会加剧水产养殖用地与水体分离的复杂性。另外,水产养殖用地与旱地的NDWI间所表现出的差异性可有效区分两种地物,因而本文将阈值设定为T2≤0.15来去除旱地。最终,本文利用NDWI模型和纹理特征初步提取了水产养殖用地范围。
通过上述步骤粗略提取水产养殖用地,然而陆地与水域交界区域仍存在混合像元,且其NDWI和熵值与目标对象相似,因此需进一步处理以去除错误对象。通过分析,所提取地物类型可分为5种:① 水产养殖用地;② 水产养殖路堤;③ 含有水产养殖用地和堤防的混合像元;④ 小型独立池塘和河流;⑤ 水体边缘的混合像元,其中前3种物体均为目标,第4类和第5类地物应排除。通过目视解译,本文发现目标对象与非目标对象之间具有不同空间特征。一般情况下,沿着海岸分布的识别有误是呈现带状的,仅具有3个或4个像元宽度;水产养殖用地的形状几乎是矩形,并宽于前者;水产养殖路堤被划分为单独的对象,且具有较小的分割尺度;堤防呈线状分布,与非目标对象的宽度相似,会造成识别中的困难。因此,本文设计将堤坝和池塘对象合并成较大宽度的对象,该合并过程将在下文中给出。
通过上述处理,目标和非目标对象具有相似的光谱和形状特征,而它们与邻近对象具有不同的关系,其通过与给定类的其他图像对象的关系描述图像对象。养殖池周边通常围绕有堤防,因而两者间具有共同边界。因此,目标对象的边界的不合适比例与邻近的对象相邻,不管是养殖池、堤防,还是两者的混合像元。部分水体在上一步中被错误划归为水产养殖用地,且与相邻的水产养殖用地间隔较短宽度的共同边界。因此可利用共同边界度量相邻对象间的关系:
假设一个对象的类型已知,且具有相邻对象,可将共同边界作为地物类型边界,将共同边界长度与总边界长度的比值定义为已知类型下相邻对象间的相对边界特征:如果对象与已知类型的相邻对象间的相对边界为值1,则表示该对象完全包含于该类。
在本文中,该特征表示为水产养殖对象与相邻对象间的相对边界长度,经多次实验验证,目标对象的特征值在大多数情况下大于0.6,进而可利用该特征值合并提取的水产养殖对象,合并规则如下:① 对于上一步分配给水产养殖用地的任意对象,将具有共同边界的相邻对象的特征阈值设定为T3>0.6;② 合并符合条件的对象,并重新计算合并对象的特征值。
本节将对非目标对象进行处理,包括小型异常对象,以及水陆交界处的边缘水体对象。通过实验分析,本文发现水产养殖对象的NDWI通常小于0.5,而异常对象和水域对象却相反。有了这个限制因素,本文设定NDWI的阈值T4=0.5,由此排除水产养殖对象中部分混合水体对象(如河流)。然而,沿海岸分布的海陆边缘水体仍然与水产养殖对象相混合,主要由于其具有相似的NDWI和熵特征值,因此可利用几何特征消除错误对象。
矩形拟合方法通常用于描述具有相似尺寸且呈矩形分布的对象,常用于基于高分辨率影像的水产养殖用地的处理与分析[12]。然而,非目标对象一般具有相似的宽度,但一些非目标对象的矩形拟合值却表现出与目标对象的相似性。影像中各对象由于其几何形状的不规则性一般难以直接计算其宽度,通常采用最小外包矩形宽度作为其实际宽度。然而这种方式与真实宽度之间通常存在较大差异,特别是对于不规则对象。为此本文构建一种相对宽度的来表达对象的实际宽度,表示为式(4):
式中:Area是对象的实际面积;Length是其最小外包矩形的长度。
通过计算结果与实际情况的比较,可以得出相对宽度与真实宽度具有较高相似性,即使对于不规则对象也是如此。水产养殖对象通常具有2个或更多个池塘,因此其宽度等于2个池塘的长度,即其宽度将多于10个像元。而非目标对象的宽度主要在1-7个像元之间,明显小于前者。因此,本文将一个对象的相对宽度阈值设定为T5为7个像元,小于该阈值的对象应该从水产养殖对象中排除。
在经过上述处理后,还需进行一些后处理,主要包括对象合并和片段清除:合并与水产养殖用地相同类型的地物,然后将水产养殖对象中的碎斑块进行归并。通过多次实验,本文将归并的阈值设定为T6为150个像元,即将少于该阈值的像元进行归并。
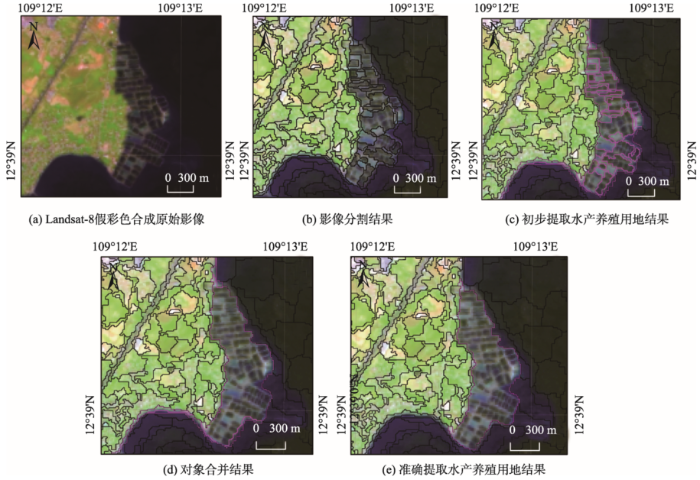
图4给出的是部分研究区域的各关键步骤的处理结果。图4(a)显示的是由4、5、6波段组成的假彩色影像;图4(b)所示的为影像分割结果;图4(c)显示了水产养殖用地的初步提取结果,在该图中,所有的水产养殖用地均被提取,但同时存在一些错误的提取对象,而这些对象通常位于水陆交界处。图4(d)显示的是对象合并后的结果,将属于水产养殖用地的对象合并在一起,形成一个较大的对象,但此时仍然存在错误对象;图4(e)表示的是最终的提取结果。
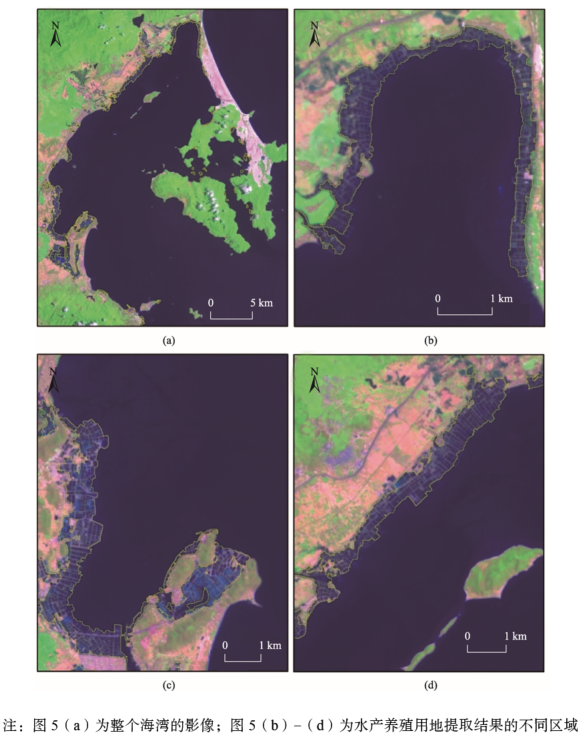
本文方法的最终结果如图5所示,其中水产养殖用地边界表示为黄色曲线。图5(a)显示了整个海湾水产养殖用地提取结果,图5(b)-(d)中的3个子区域是其细节表达。实验结果表明,该方法在中分辨率影像中成功地提取了水产养殖用地。
为了评估本文方法所提取的水产养殖用地的准确性,本文将该结果与目视解译所提取水产养殖用地进行对比。同时本文利用另一种面向对象方法[35],即基于最小距离的监督分类方法作为对照试验,该方法首先分割图像,然后选择典型的样本来训练分类器,最后基于最小距离方法进行分类,为了产生更好的结果,一般需更正错误分类样本对象,并再次分类。
整体精度评定主要通过本文方法所提取的水产养殖面积与高分辨率影像目视解译的实际面积间的比值确定,同时可依据水产养殖用地提取结果中非目标对象的比例评估其错误率,评估结果如表1所示。结果表明,该方法的准确性为91.13%,其错误率仅为0.09%;作为对照实验,最小距离分类精度仅为56.71%,错误率高达21.08%,表明了本文方法的可靠性,可有效处理如水陆交界处的混合像元、地物提取不足,以及分类中常见的椒盐现象等问题。
本文针对沿海地区中分辨率影像的水产养殖用地提取,提出了一种基于纹理和空间特征的方法,综合采用光谱指数、纹理度量和几何特征分析水产养殖用地及其周边地物特征,并获得了较好的效果。
面向对象方法通常利用影像的纹理、光谱和形状特征实现地物分类。一般情况下,仅依据光谱特征难以实现对Landsat影像的精确分类,而纹理特征则能反映难以被光谱特征检测的影像结构,因而可用于分类精度的提高[36]。中分辨率影像通常呈现出水产养殖用地的网格状纹理特征[18],而这与其他特征完全不同。张涛等[3]采用基于纹理的面向对象方法提取水产养殖用地,但该方法在识别陆地和水产养殖用地交界处仍然存在一定不足。而本文所采用的结合纹理熵测度来提取水产养殖用地的方法具有一定的实际意义,可较好弥补其中的不足。
另外,分割尺度的定义对于中分辨率影像的地物分类是十分重要的。Liu等[28]阐述了尺度效应对中分辨率影像分类结果的影响。在影像分割中,经常会面临分割过度与不足的矛盾,这些矛盾主要体现在分割尺度的定义方式。另外,由于影像中不同位置处水产养殖用地特征具有一定差异性,而对象分割通常仅能覆盖水产养殖用地的一小部分,难以直接代表该类对象的特征。本文实现影像地物的精细分割,分割尺度通常小于11,以解决分割不足的问题;然后,对具有相似光谱和空间特征的对象进行合并,以解决分割过度的问题,且在对象合并中对相邻对象之间的空间关系进行了相应调整。
通常依据相对边界与目标对象的特征合并同类型地物,同时分离混合对象。对象的特征值随着对象合并而发生较大变化,特别是受到NDWI和宽度的变化的影响。目标对象(特别是池塘)的NDWI通常高于水的NDWI,而其他对象NDWI则低于水的NDWI,对象合并将池塘和路堤对象混合在一起,从而实现目标对象NDWI的统一,消除了异常值。一般情况下,水产养殖用地的NDWI均低于相应的NDWINDVI,可明显的识别目标和水体对象。更重要的是,养殖池与堤防对象的合并,孤立了非目标对象,也是进一步处理的重要前提。在水产养殖用地精提取处理中,本文构建了相对宽度作为地物的形状特征,该宽度并不总是等于对象的实际宽度,而是作为实际宽度的近似表达。
本文方法考虑了水产养殖用地的多样性,并结合光谱与空间特征实现地物分类以提高分类效果,但仍有一些问题需要进一步探讨。分类结果中仍然存在一些容易混淆的地物,主要由于海洋白帽效应的影响,在基岩海岸处存在误分类现象;其他误分类主要在于港口与水产养殖地相混合的区域。这些地物对象均位于沿海地带,显示出与目标对象相似的熵、光谱特征,甚至形状特征,因而仅使用面向对象方法难以去除这些错误对象。本文认为可在子对象级别或子像元级别区分此类具有相似特征对象,但相关方法仍需进一步研究。此外,如果影像中频繁地出现具有相似纹理和光谱特性的对象,则会出现较大的精度损失,如白帽效应。本文阈值设定主要通过目视解译和多次实验进行,具有一定的主观性,会对提取结果的精度造成一定影响。未来将致力于研究利用影像对象与子对像之间的空间关系、制定对象与子对象的提取规则以实现影像分类。
受制于地物本身及地物间空间、纹理与光谱特征的影响,水产养殖用地的自动化提取具有一定的困难性。本文致力于利用中分辨率影像的自动化提取水产养殖用地,充分利用图像分割、NDWI和熵特征方法的结合共同提取水产养殖用地,然后利用相邻对象的相互关系来合并获取的水产养殖对象,并构建了一种相对宽度来消除具有相似特征的对象的干扰。实验结果表明,本文方法的分类精度可达91.13%,远高于基于最小距离的分类方法,表明了该方法有效性。未来考虑根据水产养殖用地的纹理特征和空间关系实现子对象层次的特征建模,以实现在子对象层次的分类。
The authors have declared that no competing interests exist.
| [1] |
The importance of selective breeding in aquaculture to meet future demands for animal protein: A review [J].https://doi.org/10.1016/j.aquaculture.2012.04.008 URL [本文引用: 1] 摘要
78 We demonstrate existence of vast potential for increased aquaculture production. 78 The largest potential for aquaculture lies in the marine environment. 78 Selection responses in aquaculture species are higher than for conventional livestock. 78 More use of genetically improved stocks may dramatically increase aquaculture output. 78 Genetically improved stocks are critical for better utilization of limited resources.
|
| [2] |
Aquaculture: Relevance, distribution, impacts and spatial assessments: A review [J].https://doi.org/10.1016/j.ocecoaman.2015.10.015 URL [本文引用: 1] 摘要
Aquaculture is the fastest-growing animal food production sector worldwide and is becoming the main source of aquatic animal food in human consumption. Depletion of wild fishery stocks, rising global populations, continuing demand for food fish, and international trade has driven aquaculture's tremendous expansion during the last decades - in terms of production volume and value. Farmed aquatic products are among the most widely traded commodities in the world food economy. Aquaculture has mainly been developed in valuable fertile coastal environments and caused large-scale land use changes, destruction and loss of coastal wetlands and pollution of waters and soils. This article presents an overview of the relevance, current status and distribution of aquaculture in global and regional scales and depicts its key environmental impacts. Quantitative assessment of the spatial extent, distribution, and dynamics of aquaculture is of utmost importance for a sustainable management of our planet's land and water resources ensuring human and environmental health. The article points to the potential of remote sensing to detect, map and monitor large-scale aquaculture areas and gives a complementary review of satellite remote sensing studies addressing the observation of aquaculture including site selection, site detection and monitoring of related impacts on the environment.
|
| [3] |
Automatic mapping aquaculture in coastal zone from TM imagery with OBIA approach [C]// |
| [4] |
The state of world fisheries and aquaculture [J].https://doi.org/10.2983/0730-8000(2006)25[129:CODACI]2.0.CO;2 URL [本文引用: 1] 摘要
Part 1 of this book presents a world review of fisheries and aquaculture, highlighting trends in production, utilization and trade, as well as developments in governance and policy. Part 2 discusses selected issues in fisheries and aquaculture, including: the Code of Conduct for Responsible Fisheries; sustainable growth and expansion of aquaculture; the allocation of fishing rights; the impact ...
|
| [5] |
Ecuador's mangrove forest carbon stocks: A spatiotemporal analysis of living carbon holdings and their depletion since the advent of commercial aquaculture .https://doi.org/10.1371/journal.pone.0118880 URL [本文引用: 1] |
| [6] |
Dynamics of land cover/land use changes in the mekong delta, 1973-2011: A remote sensing analysis of the tran van thoi district, Ca Mau province, Vietnam [J].https://doi.org/10.3390/rs70302899 URL [本文引用: 2] 摘要
The main objective of this study is to assess the spatio-temporal dynamics of land cover/land use changes in the lower Mekong Delta over the last 40 years with the coastal Tran Van Thoi District of Ca Mau Province, Vietnam as a case study. Land cover/land use change dynamics are derived from moderate to high spatial resolution (Landsat and SPOT) satellite imagery in six time intervals ranging from 1973 to 2011. Multi-temporal satellite images were collected, georeferenced, classified using per-pixel method, validated,聽and compared in post classification for the land use/land cover change detection in decades. Seven major land cover/land use classes were obtained, including cultivated lands, aquaculture ponds, mangrove forest, melaleuca forest, built up areas, bare lands, and natural water bodies. The accuracies of the land cover/land use maps for 1973, 1979, 1989, 1995, 2004, and 2011 were 81%, 82%, 86%, 87%, 89%, and 89%, respectively. The results show that the area of cultivated lands reduced over the period 1973-2011, however, it still represents the dominant land use in the case study. Aquaculture ponds were almost absent in 1973 but greatly increased from 1995 to 2004, to represent 20% of the land surface in 2011. Overall, from 1973 to 2011, bare lands, cultivated lands, mangrove forest, and melaleuca forest decreased by 104 km2, 77 km2, 61 km2, and 5 km2, respectively. In contrast, aquaculture lands and built up areas increased by 123 km2 and 120 km2, respectively. Temporal analysis highlights that these changes took place mostly between 1995 and 2004. This study is a first step to identify the main drivers of land use changes in this delta region, which include economical policies as well as demographic, socio-economic, and environmental changes.
|
| [7] |
How remote sensing supports mangrove ecosystem service valuation: A case study in Ca Mau province, Vietnam [J].https://doi.org/10.1016/j.ecoser.2015.04.007 URL [本文引用: 2] 摘要
61Remote sensing, household data are combined in valuating mangrove ecosystem services.61We estimate the mean value of mangrove ecosystem was 3000/ha/year.61Results show that expansion of aquaculture has reduced benefits to local communities.
|
| [8] |
Remote sensing in mapping mangrove ecosystems: An Object-based approach [J].https://doi.org/10.3390/rs5010183 URL [本文引用: 2] 摘要
Over the past few decades, clearing for shrimp farming has caused severe losses of mangroves in the Mekong Delta (MD) of Vietnam. Although the increasing importance of shrimp aquaculture in Vietnam has brought significant financial benefits to the local communities, the rapid and largely uncontrolled increase in aquacultural area has contributed to a considerable loss of mangrove forests and to environmental degradation. Although different approaches have been used for mangrove classification, no approach to date has addressed the challenges of the special conditions that can be found in the aquaculture-mangrove system in the Ca Mau province of the MD. This paper presents an object-based classification approach for estimating the percentage of mangroves in mixed mangrove-aquaculture farming systems to assist the government to monitor the extent of the shrimp farming area. The method comprises multi-resolution segmentation and classification of SPOT5 data using a decision tree approach as well as local knowledge from the region of interest. The results show accuracies higher than 75% for certain classes at the object level. Furthermore, we successfully detect areas with mixed aquaculture-mangrove land cover with high accuracies. Based on these results, mangrove development, especially within shrimp farming-mangrove systems, can be monitored. However, the mangrove forest cover fraction per object is affected by image segmentation and thus does not always correspond to the real farm boundaries. It remains a serious challenge, then, to accurately map mangrove forest cover within mixed systems.
|
| [9] |
Impact of oceanographic environmental shifts and atmospheric events on the sustainable development of coastal aquaculture: A case study of kelp and scallops in Southern Hokkaido, Japan [J].https://doi.org/10.3390/su7021263 URL [本文引用: 1] 摘要
We provide an overview of selected recent operational applications of satellite remote sensing and marine Geographic Information Systems (GIS) procedures to the practice of sustainable aquaculture in southern Hokkaido, Japan, focusing mainly on kelp and scallop aquaculture. We also developed a suitable aquaculture site-selection model (SASSM) for suspension culture of Gagome (a kelp species) in the same region. Models for Japanese kelp and Gagome showed that the distributions of the most suitable areas for both species overlapped. Competition between kelps was especially marked along the coastline between Hakodate and Esan. In addition, we examined the impact of oceanographic environmental changes and atmospheric events on scallop and kelp aquaculture sites, demonstrating that variations in the coastal Oyashio Current and the Tsugaru Warm Current significantly influenced the growth and harvesting seasons of scallops and kelps in Funka Bay and other sections of southern Hokkaido. Because a strong El Ni帽o event occurred in 2010, January of that year was extremely cold. The proportion of suitable areas for both scallops and kelps during their respective growing seasons contracted in 2010. Thus, shifts in oceanographic and atmospheric conditions should be incorporated into sustainability management planning for coastal scallop and kelp aquaculture in southern Hokkaido.
|
| [10] |
An object-based image analysis approach for aquaculture ponds precise mapping and monitoring: A case study of Tam Giang-Cau Hai Lagoon, Vietnam [J].https://doi.org/10.1007/s10661-013-3360-7 URL PMID: 23955440 [本文引用: 2] 摘要
Monitoring and mapping shrimp farms, including their impact on land cover and land use, is critical to the sustainable management and planning of coastal zones. In this work, a methodology was proposed to set up a cost-effective and reproducible procedure that made use of satellite remote sensing, object-based classification approach, and open-source software for mapping aquaculture areas with high planimetric and thematic accuracy between 2005 and 2008. The analysis focused on two characteristic areas of interest of the Tam Giang-Cau Hai Lagoon (in central Vietnam), which have similar farming systems to other coastal aquaculture worldwide: the first was primarily characterised by locally referred "low tide" shrimp ponds, which are partially submerged areas; the second by earthed shrimp ponds, locally referred to as "high tide" ponds, which are non-submerged areas on the lagoon coast. The approach was based on the region-growing segmentation of high- and very high-resolution panchromatic images, SPOT5 and Worldview-1, and the unsupervised clustering classifier ISOSEG embedded on SPRING non-commercial software. The results, the accuracy of which was tested with a field-based aquaculture inventory, showed that in favourable situations (high tide shrimp ponds), the classification results provided high rates of accuracy (>95%) through a fully automatic object-based classification. In unfavourable situations (low tide shrimp ponds), the performance degraded due to the low contrast between the water and the pond embankments. In these situations, the automatic results were improved by manual delineation of the embankments. Worldview-1 necessarily showed better thematic accuracy, and precise maps have been realised at a scale of up to 1:2,000. However, SPOT5 provided comparable results in terms of number of correctly classified ponds, but less accurate results in terms of the precision of mapped features. The procedure also demonstrated high degrees of reproducibility because it was applied to images with different spatial resolutions in an area that, during the investigated period, did not experience significant land cover changes.
|
| [11] |
Quantitative impacts of climate change and human activities on water-surface area variations from the 1990s to 2013 in Honghu Lake, China [J].https://doi.org/10.3390/w7062881 URL [本文引用: 2] 摘要
The water-surface areas of the lakes in the mid-lower reaches of the Yangtze River, China, have undergone significant changes under the combined impacts of global climate change and local anthropogenic stress. As a typical lake in this region, the Honghu Lake features water-surface area variations that are documented in this study based on high–resolution remote sensing images from the 1990s to 2013. The impact of human activities is analyzed by a novel method based on land use data. The relative impacts of each driving force are further distinguished by the statistical analysis method. Results show that the water-surface area has significant inter-annual and seasonal variabilities, and the minimum of which generally occurs in spring. The degree to which climate factors and land use structure affect the water-surface area varies between different stages. In the April-May period, the sum of the water demands of paddies and aquaculture has a negative effect that is greater than the positive effect of the difference between the monthly precipitation and monthly evaporation. In the June–October period, the precipitation features a positive impact that is greater than the negative effect of the water demand of agriculture. Meanwhile, climate factors and human activities have no influence on the lake area in the November–March period. With the land use being altered when annual precipitations are close in value, paddy field areas decrease, ponds areas increase, and the water demand of agriculture rises in both flood and drought years. These findings provide scientific foundation for understanding the causes of water-surface area variations and for effectively maintaining the stability of the Honghu Lake area through adjustments in land use structure.
|
| [12] |
A method of coastal aquaculture area automatic extraction with high spatial resolution images [J].
It is significant to study on offshore aquaculture for development,utilization,planning and protecting of coastal zones.Nowadays,it becomes one effective measure to investigate inshore aquaculture with remote sensing image processing.In this study,index of spectral feature,addresses rapid detection of offshore aquaculture activities,were constructed by analyzing the spectral feature of the fish raft and the kelp/porphyra zone in area of Sanduao Sea around Ningde City in Fujian Province.Then an algorithm of threshold detection based on the texture of the index was proposed to identify the fish raft and the kelp/porphyra area.The model was selected to remove sea-background,and the Otsu was used to discriminate fish raft and kelp/porphyra area.The experimental results showed the proposed method can monitor the different aquaculture area in a fast and accurate way,and ensure the accuracy to reach higher than 90%.
|
| [13] |
基于国产高分影像的海岸带盐田和水产养殖区图谱特征分析 [J].https://doi.org/10.11759/hykx20141011003 URL Magsci [本文引用: 2] 摘要
海岸带区域水陆相接, 盐业和水产养殖业发展迅速。本文基于国产高空间分辨率卫星遥感影像,对海岸带盐田和水产养殖区进行了全面的分析, 总结了盐田和水产养殖区地物的颜色、色调、大小、形状、纹理、位置等遥感影像图谱特征, 以期为盐田和水产养殖区遥感监测提供技术支撑。
TUPU characteristic analysis of the salt fields and aquaculture areas in coastal zone based on domestic high spatial resolution satellite images .https://doi.org/10.11759/hykx20141011003 URL Magsci [本文引用: 2] 摘要
海岸带区域水陆相接, 盐业和水产养殖业发展迅速。本文基于国产高空间分辨率卫星遥感影像,对海岸带盐田和水产养殖区进行了全面的分析, 总结了盐田和水产养殖区地物的颜色、色调、大小、形状、纹理、位置等遥感影像图谱特征, 以期为盐田和水产养殖区遥感监测提供技术支撑。
|
| [14] |
Integration of case-based reasoning and object-based image classification to classify SPOT images: A case study of aquaculture land use mapping in coastal areas of Guangdong province, China [J].https://doi.org/10.1080/15481603.2013.842292 URL [本文引用: 2] 摘要
We present a method to integrate case-based reasoning (CBR) with object-oriented image classification to classify SPOT images. Images were first segmented into discrete objects at multiple scales. CBR was then used to classify these objects by comparing their geometric shapes, spectral characteristics, and textural measurements with those of the past objects prepared from archived SPOT images and land use data. Once enough past objects were accumulated, this method was able to successfully classify image objects with promising results as demonstrated by a case study of aquaculture land use mapping in coastal areas of Guangdong province, China.
|
| [15] |
Monitoring drought in mountainous area based on temperature/vegetation dryness index (TVDI) [J].Arid Land Geography, 2007. Jayanthi M. Monitoring brackishwater aquaculture development using multi-spectral satellite data and GIS: A case study near Pichavaram mangroves south-east coast of India [J].
EOS(earth observation satellites) and MODIS(moderate imaging spectra) data are very suitable for vast extent,long-term and dynamic drought monitoring for its high temporal resolution,high spectral resolution and moderate spatial resolution.Based on MODIS data and the analyses of former remote sensing drought-monitoring models,Vegetation Index (鈪) and land surface temperature product are used to establish NDVI-Ts.From the spaces,we establish temperature vegetation dryness index (TDVI).Using this method to monitor Red River areas surface arid situation of Yunnan Province in March and April of 2006,simultaneously unifying the local meteoro- logical bureau information and the synchronized observation surface layer soil temperature and humidity data to carry on the quota confirmation,finally indicated that TVDI and the soil moisture have the remarkable correlation.The results show that the model may be used to monitor the wide range arid and very suitable for great extent,long-term drought detection and forecast.
|
| [16] |
Monitoring brackishwater aquaculture development using multi-spectral satellite data and GIS: A case study near Pichavaram mangroves south-east coast of India .https://doi.org/10.1071/MF10194 URL [本文引用: 2] 摘要
Satellite data of Landsat TM, IRS 1B LISS II, IRS 1C LISS III and IRS 1D LISS III were used to monitor aquaculture development and its spatial distribution in Cuddalore District, south-east coast of India. Analysis of satellite images using image processing software ERDAS Imagine 9.0 and Geographic Information System (GIS) software Arc GIS 9.0 indicated that the area under aquaculture was 6.91 ha in 1987, gradually increasing to 67.71 ha in 1994, and reaching a maximum of 380.19 ha in 1998. There was a little shrimp culture development (6.14 ha) from 1998 to 2005 because of risk of White Spot Syndrome Virus (WSSV), epizootics and constraints related to social and environmental concerns raised against shrimp farming. Shrimp farms initially started in the marsh areas close to creeks and then moved inland towards agricultural and fallow lands. Farms developed in clusters along the creeks without affecting mangrove reserve forests between 1988 and 2005 and about 177.02 ha agriculture land including 234.25 ha fallow lands were converted for aquaculture farming. Shrimp culture was abandoned in 109.47 ha and 15.13 ha of agricultural land previously converted to aquaculture farms, was reconverted for agriculture. The present study shows that remote sensing data and GIS are useful tools in assessing and monitoring the development of aquaculture for larger areas and suggests that national level planning using multi-spectral satellite data can be used to assess the existing land use and the potential for sustainable use of coastal resources.
|
| [17] |
基于ASTER影像的近海水产养殖信息自动提取方法 [J].Method of automatic extracting seaside aquaculture land based on ASTER remote sensing image [J]. |
| [18] |
Extract enclosure culture in lakes based on remote sensing image texture information [J].https://doi.org/10.18307/2006.0403 URL [本文引用: 2] 摘要
Most lakes in eastern China are exploited in the form of enclosure culture. The high density enclosure culture area is easy to cause lake eutrophication and deteriorate the water quality. So the lake enclosure culture area is focused by people and is usually extracted by using the multi-temporal remote sensing data and the multi-spectral classification or the manual digitization means. The multi-spectral classification is easy to confuse enclosure culture area with the natural water area and the manual digitization demands much time. This paper suggests a new method using the image texture information to extract lake enclosure area. The result is more accurate and the method demands less expense. Lake Baima is the study area and the image of the area is multi-spectral data of China Brazil Earth Resources Satellite 02. First the water area銆乼he man-made area and the bare soil which has the similar spectral characteristics with the water are extracted by using the normalized difference water index. Then the principal component analysis was used to compress the multi-spectral data of the study area and enhance the texture information of the image. The third step Grey Level Co-occurrence Matrix (GLCM) was used to analyze the image, select a proper threshold of mean value which quantifies the GLCM. Finally, the lake enclosure culture area was extracted by using the decision tree.
|
| [19] |
Multispectral and texture feature application in image-object analysis of summer Vegetation in Eastern Tajikistan Pamirs [J].https://doi.org/10.3390/rs8010078 URL [本文引用: 1] 摘要
We tested the Moment Distance Index (MDI) in combination with texture features for the summer vegetation mapping in the eastern Pamir Mountains, Tajikistan using the 2014 Landsat OLI (Operational Land Imager) image. The five major classes identified were sparse vegetation, medium-dense vegetation, dense vegetation, barren land, and water bodies. By utilizing object features in a random forest (RF) classifier, the overall classification accuracy of the land cover maps were 92% using a set of variables including texture features and MDI, and 84% using a set of variables including texture but without MDI. A decrease of the Kappa statistics, from 0.89 to 0.79, was observed when MDI was removed from the set of predictor variables. McNemar- test showed that the increase in the classification accuracy due to the addition of MDI was statistically significant (p < 0.05). The proposed method provides an effective way of discriminating sparse vegetation from barren land in an arid environment, such as the Pamir Mountains.
|
| [20] |
Object-based urban land cover classification using rule inheritance over very high-resolution multisensor and multitemporal data [J].https://doi.org/10.1080/15481603.2015.1122923 URL [本文引用: 1] 摘要
Very high spatial and temporal resolution remote sensing data facilitate mapping highly complex and diverse urban environments. This study analyzed and demonstrated the usefulness of combined high-resolution aerial digital images and elevation data, and its processing using object-based image analysis for mapping urban land covers and quantifying buildings. It is observed that mapping heterogeneous features across large urban areas is time consuming and challenging. This study presents and demonstrates an approach for formulating an optimal land cover classification rule set over small representative training urban area image, and its subsequent transfer to the multisensor, multitemporal images. The classification results over the training area showed an overall accuracy of 96%, and the application of rule set to different sensor images of other test areas resulted in reduced accuracies of 91% for the same sensor, 90% and 86% for the different sensors temporal data. The comparison of reference and classified buildings showed 00±4% detection errors. Classification through a transferred rule set reduced the classification accuracy by about 5%09000910%. However, the trade-off for this accuracy drop was about a 75% reduction in processing time for performing classification in the training area. The factors influencing the classification accuracies were mainly the shadow and temporal changes in the class characteristics.
|
| [21] |
Multiscale quantification of urban composition from EO-1/Hyperion data using object-based spectral unmixing [J].https://doi.org/10.1016/j.jag.2016.01.002 URL [本文引用: 1] 摘要
Quantification of the urban composition is important in urban planning and management. Previous research has primarily focused on unmixing medium-spatial resolution multispectral imagery using spectral mixture analysis (SMA) in order to estimate the abundance of urban components. For this study an object-based multiple endmember spectral mixture analysis (MESMA) approach was applied to unmix the 30-m Earth Observing-1 (EO-1)/Hyperion hyperspectral imagery. The abundance of two physical urban components (vegetation and impervious surface) was estimated and mapped at multiple scales and two defined geographic zones. The estimation results were validated by a reference dataset generated from fine spatial resolution aerial photography. The object-based MESMA approach was compared with its corresponding pixel-based one, and EO-1/Hyperion hyperspectral data was compared with the simulated EO-1/Advanced Land Imager (ALI) multispectral data in the unmixing modeling. The pros and cons of the object-based MESMA were evaluated. The result illustrates that the object-based MESMA is promising for unmixing the medium-spatial resolution hyperspectral imagery to quantify the urban composition, and it is an attractive alternative to the traditional pixel-based mixture analysis for various applications.
|
| [22] |
Object-based image analysis for the impact of sewage pollution in Malad Creek, Mumbai, India .[J].https://doi.org/10.1007/s10661-015-4981-9 URL PMID: 26780414 [本文引用: 1] 摘要
Abstract Today, object-based image analysis provides an option for integrating spatial information beyond conventional pixel-based classifications for high-resolution imagery. Due to its rare applicability in pollution assessment, an attempt has been made to assess the spatial extent of sewage pollution in Malad Creek, Mumbai, India. Based on multiresolution segmentation of an IRS P6 (LISS IV) image and the Normalized Difference Turbidity Index (NDTI), the various water quality regions in the creek were classified. The existing literature implies that the reflectance of turbid water is similar to that of bare soil which gives positive NDTI values. In contrast to this, negative values of NDTI are observed in the present study due to the presence of organic matter which absorbs light and imparts turbidity, which is supported by the significant correlation between NDTI and turbidity. A strong relationship is observed between turbidity and water quality parameters, implying the impact of organic matter through discharges of sewage in the creek. Based on the classified regions and the water quality parameters, the extent of pollution was ranked as high, moderate, low and least. The methodology developed in the present study was successfully applied on an IKONOS image for the same study area but a different time frame. The approach will help in impact assessment of sewage pollution and its spatial extent in other water bodies.
|
| [23] |
基于RS与GIS的珠江口养殖用地时空变化分析 [J].
珠江口地区是我国重要的养殖基地,近20年来养殖业在数量和空间分布上发生了较大的变化。利用遥感(RS)及地理信息系统(GIS)技术能够有效监测珠江口海岸带地区水产养殖场的变化。本文应用1990年、2000年、2005年和2008年4个时相的遥感数据,采用面向对象的方法,综合光谱、空间关系和形状特征信息进行了养殖用地的提取。结果表明1990年-2000年珠江口沿岸地区养殖用地面积有较大增长。2000年-2005年该地区养殖用地变化强度减弱。2005年-2008年西岸养殖用地仍然保持增长,而东岸却大幅减少。对养殖用地重心的迁移距离和迁移方向进行分析,结果表明1990年-2008年珠江口东西岸养殖用地均呈向西北方向迁移的模式。研究期内增加的养殖用地主要来源于滩涂围垦和农业用地,而减少的养殖用地主要转化为城镇用地。该研究客观、准确的反演了海岸带养殖用地的动态变化过程,对海岸带土地资源的可持续开发利用研究具有一定的理论和现实意义。
Analyses on spatial-temporal changes in aquaculture land in coastal areas of the pearl river estuarine [J].
珠江口地区是我国重要的养殖基地,近20年来养殖业在数量和空间分布上发生了较大的变化。利用遥感(RS)及地理信息系统(GIS)技术能够有效监测珠江口海岸带地区水产养殖场的变化。本文应用1990年、2000年、2005年和2008年4个时相的遥感数据,采用面向对象的方法,综合光谱、空间关系和形状特征信息进行了养殖用地的提取。结果表明1990年-2000年珠江口沿岸地区养殖用地面积有较大增长。2000年-2005年该地区养殖用地变化强度减弱。2005年-2008年西岸养殖用地仍然保持增长,而东岸却大幅减少。对养殖用地重心的迁移距离和迁移方向进行分析,结果表明1990年-2008年珠江口东西岸养殖用地均呈向西北方向迁移的模式。研究期内增加的养殖用地主要来源于滩涂围垦和农业用地,而减少的养殖用地主要转化为城镇用地。该研究客观、准确的反演了海岸带养殖用地的动态变化过程,对海岸带土地资源的可持续开发利用研究具有一定的理论和现实意义。
|
| [24] |
Appraisal of land use/land cover of mangrove forest ecosystem using support vector machine [J].https://doi.org/10.1007/s12665-013-2628-0 URL [本文引用: 1] 摘要
Human activities in many parts of the world have greatly changed the natural land cover. This study has been conducted on Pichavaram forest, south east coast of India, famous for its unique mangrove bio-diversity. The main objectives of this study were focused on monitoring land cover changes particularly for the mangrove forest in the Pichavaram area using multi-temporal Landsat images captured in the 1991, 2000, and 2009. The land use/land cover (LULC) estimation was done by a unique hybrid classification approach consisting of unsupervised and support vector machine (SVM)-based supervised classification. Once the vegetation and non-vegetation classes were separated, training site-based classification technology i.e., SVM-based supervised classification technique was used. The agricultural area, forest/plantation, degraded mangrove and mangrove forest layers were separated from the vegetation layer. Mud flat, sand/beach, swamp, sea water/sea, aquaculture pond, and fallow land were separated from non-vegetation layer. Water logged areas were delineated from the area initially considered under swamp and sea water-drowned areas. In this study, the object-based post-classification comparison method was employed for detecting changes. In order to evaluate the performance, an accuracy assessment was carried out using the randomly stratified sampling method, assuring distribution in a rational pattern so that a specific number of observations were assigned to each category on the classified image. The Kappa accuracy of SVM classified image was highest (94.53聽%) for the 2000 image and about 94.14 and 89.45聽% for the 2009 and 1991 images, respectively. The results indicated that the increased anthropogenic activities in Pichavaram have caused an irreversible loss of forest vegetation. These findings can be used both as a strategic planning tool to address the broad-scale mangrove ecosystem conservation projects and also as a tactical guide to help managers in designing effective restoration measures.
|
| [25] |
Coastal zone land use information extraction based on objectoriented classification method [J].https://doi.org/10.11849/zrzyxb.2014.09.013 URL [本文引用: 1] 摘要
Since land use patterns in coastal zones are often characterized by complexity and diversity, it is difficult to acquire accurate land-use information from remote sensing image using traditional methods. Thus, this paper, taking the Rushan coastal zone, located in the east of Shandong Peninsula as a case, tries to fill this gap and develop a new method based on objectoriented classification to extract more accurate coastal zone land-use information. We collect Landsat TM image as the basic information sources for further data processing and analysis.Based on the method of object-oriented classification, this paper makes use of the characteristics of different objects, such as spectrum, shape, texture and spatial relationships, and extracts land-use information in the study area through multiresolution segmentation, Membership Function and Standard Nearest Neighbor, and then evaluates classification accuracy. The results include: 1) Twelve kinds of land- use information are classified in the Rushan coastal zone by both Membership Function and Standard Nearest Neighbor methods. The salt and aquaculture water, the woodland and orchard are well identified, and the elongated linear features were clearly extracted. 2) Through comparing the extraction results using maximum likelihood method, the object- oriented classification accuracy was 82.50%, Kappa was 0.8091, 11.44% and0.1055 higher than that using the maximum likelihood method. The results showed that the object-oriented classification method is an effective technical method for extraction of land-use information quickly and accurately in coastal zones, because it can improve the classification precision of high resolution remote sensing image through attenuating effectively the effects on the classification accuracy due to"same object with different spectrums"and"different objects with same spectrums", and"salt-pepper".
|
| [26] |
Mangrove mapping and change detection in Ca Mau Peninsula, Vietnam, using landsat data and object-based image analysis [J].https://doi.org/10.1109/JSTARS.2014.2360691 URL [本文引用: 1] 摘要
Mangrove forests provide important ecosystem goods and services for human society. Extensive coastal development in many developing countries has converted mangrove forests to other land uses without regard to their ecosystem service values; thus, the ecosystem state of mangrove forests is critical for officials to evaluate sustainable coastal management strategies. The objective of this study is to investigate the multidecadal change in mangrove forests in Ca Mau peninsula, South Vietnam, based on Landsat data from 1979 to 2013. The data were processed through four main steps: 1) data preprocessing; 2) image processing using the object-based image analysis (OBIA); 3) accuracy assessment; and 4) multitemporal change detection and spatial analysis of mangrove forests. The classification maps compared with the ground reference data showed the satisfactory agreement with the overall accuracy higher than 82%. From 1979 to 2013, the area of mangrove forests in the study region had decreased by 74%, mainly due to the boom of local aquaculture industry in the study region. Given that mangrove reforestation and afforestation only contributed about 13.2% during the last three decades, advanced mangrove management strategies are in an acute need for promoting environmental sustainability in the future.
|
| [27] |
Multi-resolution, object-oriented fuzzy analysis of remote sensing data for GIS-ready information [J].https://doi.org/10.1016/j.isprsjprs.2003.10.002 URL [本文引用: 1] 摘要
Remote sensing from airborne and spaceborne platforms provides valuable data for mapping, environmental monitoring, disaster management and civil and military intelligence. However, to explore the full value of these data, the appropriate information has to be extracted and presented in standard format to import it into geo-information systems and thus allow efficient decision processes. The object-oriented approach can contribute to powerful automatic and semi-automatic analysis for most remote sensing applications. Synergetic use to pixel-based or statistical signal processing methods explores the rich information contents. Here, we explain principal strategies of object-oriented analysis, discuss how the combination with fuzzy methods allows implementing expert knowledge and describe a representative example for the proposed workflow from remote sensing imagery to GIS. The strategies are demonstrated using the first object-oriented image analysis software on the market, eCognition, which provides an appropriate link between remote sensing imagery and GIS.
|
| [28] |
Assessing object-based classification: Advantages and limitations [J].https://doi.org/10.1080/01431161003743173 URL [本文引用: 2] 摘要
The advantages of object-based classification over the traditional pixel-based approach are well documented. However, the potential limitations of object-based classification remain less explored. In this letter, we assess the advantages and limitations of an object-based approach to remote sensing image classification relative to a pixel-based approach. We first quantified the negative impacts of under-segmentation errors on the potential accuracy of object-based classification by developing a new segmentation accuracy measure. Then we evaluated the advantages and limitations of object-based classification by quantifying their overall effects relative to pixel-based classification, with respect to their classification units and features at multiple segmentation scales. The results based on a QuickBird satellite image indicate that (1) segmentation accuracies decrease with increasing segmentation scales and the negative impacts of under-segmentation errors become significantly large at large scales and (2) there are both advantages and limitations in using object-based classification, and their trade-off determines the overall effect of object-based classification, which is dependent on the segmentation scales.
|
| [29] |
Textural Features for Image Classification [J]. |
| [30] |
Entropy algorithm for automatic detection of oil spill from radarsat-2 SAR data [J] |
| [31] |
Predicting soil organic carbon density using auxiliary environmental variables in northern Iran [J].https://doi.org/10.1080/03650340.2015.1051472 URL [本文引用: 1] 摘要
In the present study, artificial neural networks (ANNs) were employed to develop models to predict soil organic carbon density (SOCD) at different depths of soil layers. Selected environmental variables such as vegetation indices, soil particle size distribution, land use type, besides primary and secondary terrain attributes were considered as the input variables. According to the results, the ANN models explained 77% and 72% of the variability in SOCD at soil layer depths of 009000920 cm and 2009000940 cm, respectively, at the site studied. Sensitivity analyses showed that the most considerable positive contribution of variables for predicting SOCD included the land use type, normalized difference vegetation index (NDVI) > normalized difference water index (NDWI) > silt > clay > elevation in the 009000920 cm soil layer. On the other hand, for the 2009000940 cm soil layer, the land use type following NDVI > NDWI > clay > silt were identified as the most powerful predictive factors. In the Deylaman region, in both soil layers, sand had a considerable negative effect on SOCD and most of the terrain attributes had no significant impact on the SOCD prediction. Therefore, these results provide valuable information for sustainable management and decision-making on a landscape scale for governors and other users.
|
| [32] |
Disaggregation of LST over India: comparative analysis of different vegetation indices [J].https://doi.org/10.1080/01431161.2016.1145363 URL [本文引用: 1] 摘要
The non-availability of high-spatial-resolution thermal data from satellites on a consistent basis led to the development of different models for sharpening coarse-spatial-resolution thermal data. Thermal sharpening models that are based on the relationship between land-surface temperature (LST) and a vegetation index (VI) such as the normalized difference vegetation index (NDVI) or fraction vegetation cover (FVC) have gained much attention due to their simplicity, physical basis, and operational capability. However, there are hardly any studies in the literature examining comprehensively various VIs apart from NDVI and FVC, which may be better suited for thermal sharpening over agricultural and natural landscapes. The aim of this study is to compare the relative performance of five different VIs, namely NDVI, FVC, the normalized difference water index (NDWI), soil adjusted vegetation index (SAVI), and modified soil adjusted vegetation index (MSAVI), for thermal sharpening using the DisTrad thermal sharpening model over agricultural and natural landscapes in India. Multi-temporal LST data from Landsat-7 Enhanced Thematic Mapper Plus (ETM+) and Moderate Resolution Imaging Spectroradiometer (MODIS) sensors obtained over two different agro-climatic grids in India were disaggregated from 960 m to 120 m spatial resolution. The sharpened LST was compared with the reference LST estimated from the Landsat data at 120 m spatial resolution. In addition to this, MODIS LST was disaggregated from 960 m to 480 m and compared with ground measurements at five sites in India. It was found that NDVI and FVC performed better only under wet conditions, whereas under drier conditions, the performance of NDWI was superior to other indices and produced accurate results. SAVI and MSAVI always produced poorer results compared with NDVI/FVC and NDWI for wet and dry cases, respectively.
|
| [33] |
Shoreline change assessment for various types of coasts using multi-temporal Landsat imagery of the east coast of South Korea [J].https://doi.org/10.1080/2150704X.2015.1109157 URL [本文引用: 1] 摘要
Shoreline change assessment is an important task for protecting coastal properties and preserving coastal environments. This research aimed to assess the shoreline changes using the multi-temporal Landsat imagery, acquired from the east coast of South Korea during 1994 and 2014. The procedure for the shoreline change assessment consists of the following steps: (i) generating the normalized difference water index (NDWI) map from each Landsat image; (ii) extracting the shorelines from each NDWI map through the thresholding method; and (iii) assessing the shoreline changes in the various types of coasts such as the sandy, rocky and harbour coasts using the checkpoints with 1聽km intervals. The statistical results showed that 94% of the shorelines in the sandy coasts and 96% of the shorelines in the rocky coasts moved landward between 1994 and 2014 due to coastal erosions, while 91% of the shorelines in the harbour coasts moved seaward during the same period due to the land reclamation works. This research contributed to the assessment of the shoreline changes and the calculation of the erosion rates in the various coasts of the study area between 1994 and 2014.
|
| [34] |
NDWI—A normalized difference water index for remote sensing of vegetation liquid water from space [J].https://doi.org/10.1016/S0034-4257(96)00067-3 URL [本文引用: 1] |
| [35] |
Discrimination of land use patterns in remote sensing image data using minimum distance algorithm and watershed algorithm [J].https://doi.org/10.1016/S1881-8366(13)80026-2 URL [本文引用: 1] 摘要
This paper describes a new method for extracting the agricultural land use pattern around the Miyajimanuma inland wetland based on remote sensing imagery. A land parcel and particle swarm optimization (PSO) K-means-based minimum distance classification (MDC) (LP-PSOK-MDC) method was developed. This method includes three steps: 1) considering the diversity of crop planting and growth state, a training sample pre-classification-based MDC method was developed; 2) the land parcels information was extracted by using watershed transform algorithm; finally, 3) pixels in the same land parcel were re-classified. Results of the study suggest that using this method the classification result was easily up to 96 %, much better than results obtained by using traditional supervised classification methods such as MDC and unsupervised classification method.
|
| [36] |
Geographic layers as landscape drivers for the marco polo argali habitat in the southeastern pamir mountains of Tajikistan [J].https://doi.org/10.3390/ijgi4042094 URL [本文引用: 1] 摘要
We described in this report the essential geographic layers used as landscape drivers for the Marco Polo Argali habitat in the eastern Tajik Pamirs. Using remote sensing techniques and geographic information systems (GIS), individual layers were generated in order to acquire more information on argali patterns and habitat suitability and to make the dataset available online. We introduced an improved object-based image analysis in our mapping of the vegetation cover by utilizing spectral, topographic, and texture variables. We exhausted every Landsat image band and texture feature combination to select the best pairing of band-texture components. For vegetation class alone, the producer’s accuracy was 90.8% and the user’s accuracy was 91.6%.
|

/
| 〈 |
|
〉 |