郑斓 , 任红艳, 施润和
ZHENG Lan, REN Hongyan, SHI Runhe
通讯作者:
收稿日期: 2018-05-19
修回日期: 2018-01-19
网络出版日期: 2019-03-15
版权声明: 2019 《地球信息科学学报》编辑部 《地球信息科学学报》编辑部 所有
基金资助:
作者简介:
作者简介:郑斓(1994-),女,福建漳州人,硕士生,主要从事地理信息系统方面研究。E-mail: zhenglan1007@163.com
展开
摘要
近年来日益严重的登革热疫情已在中国南部地区形成疫情高发区,并对中国的公共卫生安全形成了一定的威胁。登革热主要受到区域内复杂的自然环境条件以及社会经济因素的影响,而利用地理空间分析方法和模型探究登革热疫情的影响因素,并对其未来流行风险的空间分布进行模拟,是有效开展登革热预防控制工作的重要基础。本文收集了珠江三角洲地区2010-2014年的登革热病例资料和土地利用、人口密度两种社会经济要素数据,构建土地利用回归(LUR)模型以分析登革热疫情与不同空间范围内的土地利用和人口密度之间的关系,并结合SLEUTH模型获取的2030年土地利用数据以及基于人口密度预测模型获取的2030年人口密度数据,预测珠江三角洲地区2030年登革热疫情风险的空间分布。结果表明,社会经济要素对登革热疫情空间分布的影响在不同范围内存在差异,半径分别为10、7、10、2和1 km的缓冲区内的人口密度、草地、城镇用地、林地和耕地进入LUR模型并对疫情有显著的影响(相关系数分别为0.779、-0.473、0.818、-0.642和-0.403),所构建的LUR模型效果较好(调整R2为0.796,F=390.409,P<0.01),留一交叉检验结果显示模型的相对均方根误差为0.7046,预测值与实测值的拟合精度达到0.7101。2030年城市空间扩展的区域主要分布在深圳、东莞以及广佛的交界地区,而登革热风险预测模型表明2030年登革热疫情风险较大的区域与珠江三角洲城镇用地占比、人口分布较高的地区有高度的一致性,尤其是广佛地区。因此,LUR模型可以较好地预测登革热疫情的空间分布,从而为当地卫生部门防控登革热提供方法支持。
关键词:
Abstract
Dengue fever (DF) is a rapidly spreading vector-borne viral disease that is widely prevalent in some tropical and subtropical regions. In recent years, the increasingly serious DF epidemic has formed a high incidence area in southern China and has posed a definite threat to China's public health security. DF is mainly affected by the complex environmental conditions and socio-economic factors in the region. Thus, exploring the influencing factors on the spatial distribution of DF by spatial geographic models and predicting the prevalence of DF epidemic are important bases for effective prevention and control of DF. Base on the socioeconomic data (such as land use data of urban, village, forest, farmland, grass, wetland, water area, construction area and population density data) and the spatial data of DF cases from 2010 to 2014 in the Pearl River Delta area (PRD), the Land Use Regression (LUR) model was constructed to analyze the impact of social and economic factors on the spatial distribution of DF epidemic within a range of 1~10 km buffer zones using 500 sample points. In addition, the land use data in 2030 predicted by the SLEUTH model, and the population density in 2030 obtained from the population prediction model were collected to reveal the risk of the DF epidemic in 2030. The results found that DF was significantly correlated with population density (R2=0.779), grass (R2= -0.473), urban (R2=0.818), forest (R2=-0.642) and farmland (R2=-0.403) within the buffer zone of 10 km, 7 km, 10 km, 2 km and 1km respectively. The LUR model with these five variables possessed the satisfactory capability of predicting the spatial distribution of DF with the adjusted R2=0.796 and an appropriate F value of 390.409 (P<0.01). The overall result of the model is good with the fitting accuracy of 0.7101 between the predicted values and the measured values. And the leave-one cross test results show that the model has a relative root mean square error of 0.7046. Further more, the accuracy of land use data in 2030 simulated by the SLEUTH model is good (the kappa coefficient is 0.849) as well with the expanded urban areas. They are mainly distributed in Shenzhen, Dongguan and the border areas of Guangzhou-Foshan, which also have relatively high risk of DF epidemic in 2030. In summary, LUR model can predict the spatial distribution of DF epidemics with high accuracy, which provides supports in methodology for local hygienic authorities to prevent and control DF epidemics.
Keywords:
登革热是一种由登革热病毒引起的急性传染病,主要通过白纹伊蚊和埃及伊蚊传播,其具有传播迅猛、发病率高、严重者致死等特点[1],目前广泛流行于热带、亚热带国家和地区[2]。中国自1978年在广东佛山集中爆发登革热疫情以来,登革热疫情便呈现间断性流行[3],并在中国南部地区形成一些疫情频发与高发的典型地区[4,5,6],尤为突出的是珠江三角洲地区(以下简称珠三角地区)[7]。尽管登革热在我国仍然表现为输入性疫情的流行[8],近年来其流行范围却越来越广且发病率在不断升高,严重影响了人民的健康生活,已经成为中国不容小觑的公共卫生问题。因此,加强登革热流行与传播风险的模拟和评估是积极应对登革热疫情的重要手段。
大量研究表明,登革热的流行不仅受到气候、水文和植被等自然环境条件的影响[9,10,11],而且与人口密度、土地利用变化、交通便利程度和居民收入水平等社会经济要素之间有着密切联系[12,13,14,15]。受这些自然环境、社会经济因素的影响,登革热的流行与传播呈现出明显的时空特征。基于此,学者们围绕登革热流行与传播风险及其空间分异的模拟和评估开展了大量的研究。如Li等[16]利用广义线性模型分析了各地表景观类别与登革热之间的线性关系;任红艳等[17]分析了广佛地区登革热的时空分布特征,并构建了基于BP神经网络的登革热预测模型;Yu等[18]将动力学模型加入登革热风险预测模型中,以分析台湾高雄登革热疫情的时空分布。这些模型模拟和评估均取得了不错的效果,其中,地理空间回归模型在探究登革热等蚊媒传染病的影响因素和预测其空间分布方面应用较广[19,20]。上述研究大多同时考虑了自然环境和社会经济要素对登革热疫情的影响,而前人研究亦表明在气象要素空间分异较小的情况下,珠三角地区快速的城市化会对该地的登革热疫情空间分异造成显著的影响[14]。而作为一种简单有效的多元回归模型,土地利用回归模型(Land Use Regression,LUR)不仅能较好地解决不同空间范围内环境要素对健康风险的影响,而且在探索社会经济条件与健康风险之间的关系并在未来风险预测上具有可行性。同时,LUR模型在与环境有关的疾病预测等研究领域中有较广泛的应用。如Becerra等选取孕妇住址周围交通量、交通排放浓度和道路密度等建立LUR模型预测空气污染暴露情况,并研究其对自闭症形成的影响[21]。因此本研究将借助LUR模型着重探析社会经济因素对珠三角地区登革热疫情的影响。
本研究将以珠三角地区为研究区:① 构建LUR模型以分析登革热疫情与土地利用和人口密度这两类社会经济要素之间的关系;② 基于未来(2030年)土地利用空间分布数据和人口密度数据建立登革热疫情风险空间预测模型,为珠三角地区乃至东南沿海地区的疫情防控和风险预测提供方法参考。
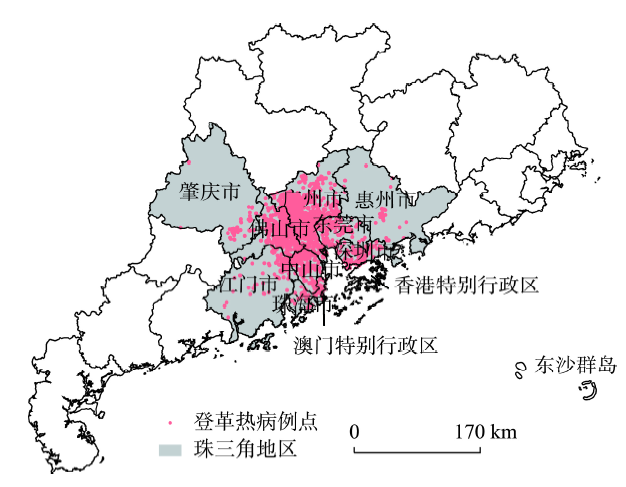
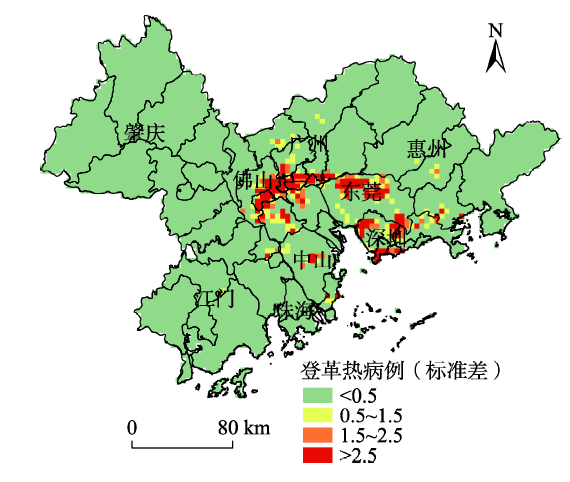
珠三角地区位于广东省中南部(22°16′N-23°57′N,111°28′E-114°42′E),包括广州、佛山等9个城市(图1),全年温暖多雨、光热充足,属于亚热带季风性海洋气候[22]。改革开放以来,珠三角地区的城镇用地迅速扩张,是中国大陆经济最具活力的地区。2010年珠三角地区总面积约为5.4万km2。其中,城镇用地、农村居民用地和其他建设用地面积占比分别达到7.23%、4.34%和2.22%。2010-2014年常住人口约为5609万人~5754万人,人均国内生产总值约为6.90万元~10.05万元,人口密度达到1039~1066人/km2,已成为世界上人口密度最高的城市化地区之一。登革热疫情的爆发和流行是该地区人们正在面临的一个重大公共卫生问题。
图1 珠江三角洲地区登革热病例分布
Fig. 1 Pearl River Delta area with the distribution of dengue fever cases from 2010 to 2014
2.2.1 疫情数据
登革热病例数据来源于中国疾病预防控制中心的传染病监测系统,脱敏处理后的信息包括年龄、性别、职业、发病日期、诊断类型、地址等,并通过地理编码(www.geocoding.cn)对病例进行空间定位。本研究仅保留本地感染病例以便分析本地疫情的时空特征及其与区域社会环境变量之间的关系。据记载2010-2014年珠三角地区的登革热本地病例数共46 422例,达到全国同期的94.35%。
2.2.2 社会环境数据
尽管珠三角地区温暖湿润的气候条件适于白纹伊蚊等蚊虫媒介的孳生和疫情传播与流行,但由于该区域内气温、湿度、降水等气候条件的空间差异相较于土地利用和人口密度等社会经济因素的差异要小,导致前者对珠三角内登革热疫情空间分异的影响程度不如后者[14,15]。考虑到这一点,本研究的LUR模型选取2010年人口密度和土地利用来反映区域人口与社会经济要素的数据[23];其中,未来人口密度预测模型是基于2010年人口密度数据计算得到,而用于获取未来土地利用数据的SLEUTH模型则包含了土地利用、城市范围、道路、坡度、阴影和排除层共6个输入图层[24,25]。具体数据及处理情况参见表1。
表1 数据来源及预处理方法
Tab. 1 Data sources and processing
| 模型 | 数据名称 | 数据预处理方法 | 数据来源 |
|---|---|---|---|
| LUR 模型 | 人口密度 | 基于2010年人口密度栅格数据(1 km×1 km),以样本点为中心,计算半径为1~10 km的圆形缓冲区内的人口密度(万人/km2) | 中国科学院资源与 环境科学数据中心[26] |
| 土地利用 类型 | 基于中国科学院资源与环境科学数据中心的土地利用覆盖分类体系,将2010年土地利用数据分为耕地、林地、草地、水域、湿地、城镇用地、农村居民用地、其他建设用地和未利用地。以样本点为中心,统计半径为1~10 km的圆形缓冲区内的各种土地利用面积占比 | ||
| SLEUTH 模型 | 土地利用 图层 | 将1995、2005、2010和2015年四期土地利用数据分为城镇用地、耕地、草地、林地、水域、湿地、未利用土地、农村居民用地和其他建设用地,以上9种地类分别对应像元值1~9 | 中国科学院资源与 环境科学数据中心[26] |
| 城市图层 | 基于四期土地利用数据,提取城镇用地作为城市图层 | ||
| 道路图层 | 提取2010和2015年道路矢量数据,将高速、城市快速、国道、省道赋予权重值为4;县道为2;乡村道路、其他道路为1;非道路地区为0 | openstreetmap[27] | |
| 坡度图层 | 基于数字高程模型(DEM)生成百分比坡度值(%) | 地理空间数据云[28] | |
| 阴影图层 | 基于数字高程模型(DEM)生成阴影层 | ||
| 排除图层 | 基于2006-2020年土地利用总体规划图以及2015年土地利用图层,设置各像元的城市化概率,取值范围为0(可城市化)~100(不可城市化)。其中有条件建设区、城镇用地、未利用地赋值0;草地、农村居民用地赋值为30;湿地赋值为50;耕地赋值为70;其他建设用地、林地赋值为90;水域、基本农田集中区、生态环境安全控制区和自然文化遗产保护区、坡度大于20%的地区赋值为100 | 各市国土资源与规划委员会 |
2.3.1 人口密度预测模型
基于珠三角各市统计年鉴中区县尺度的人口密度数据,根据式(1)计算2010-2014年逐年的区县尺度人口密度增长率[29],并统计2010-2014年的人口密度增长率均值,最终将珠三角地区各区县的人口密度增长率栅格化到1 km×1 km格网,并基于2010年的人口密度栅格数据(1 km×1 km)预测得到2030年的人口密度数据。
式中:
2.3.2 SLEUTH模型
未来的土地利用数据是登革热风险预测模型中一项不可或缺的输入参数。而典型的元胞自动机模型——SLEUTH模型的主要功能包括模拟城市增长的时空动态变化和预测未来土地利用的变化,时间尺度上可以预测未来10~100年[30]。同时,模型可通过设置不同城市化概率的排除层以模拟在不同环境保护政策下的土地利用增长趋势,其在动态地模拟和预测城市扩展的空间和数量变化方面具有一定的优势,且在国内外真实城市的模拟中已有许多成功的案例[31,32]。
SLEUTH模型根据输入的六种历史数据,通过逐次校准以确定符合珠三角地区土地利用扩展的最佳系数组合。最后,模型基于珠三角地区1995年的土地利用图层,利用校准得到的增长系数重建珠三角地区1996-2015年的土地利用变化过程,并计算2015年珠三角地区的土地利用模拟图与实际图之间的混淆矩阵,采用Kappa系数检验SLEUTH模型的模拟精度。
未来的土地利用变化会受经济、自然、政策等多种因素的影响,本研究通过2015年土地利用和目视解译的珠三角地区2006-2020年土地利用总体规划来设定排除层(表1),并模拟珠三角地区2030年土地利用预测图。
2.3.3 LUR模型
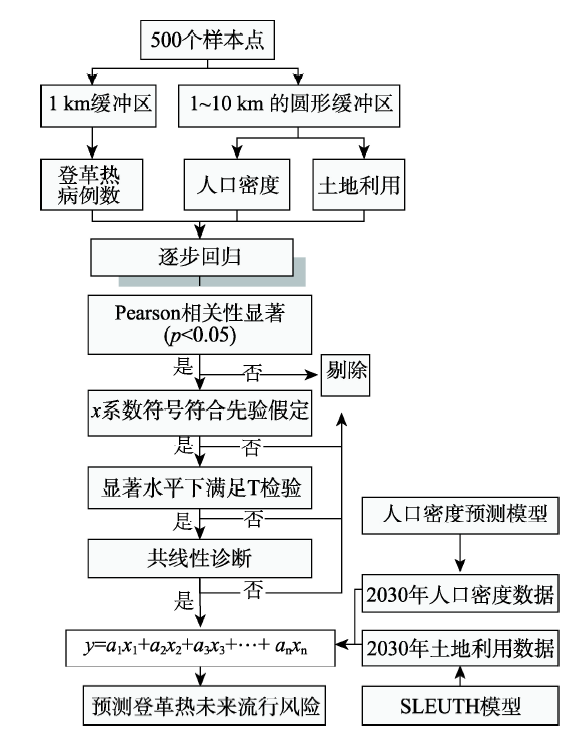
LUR模型是一种分析因变量与土地利用空间数据及其他相关地理数据之间关系的多元回归模型,在环境与健康研究领域应用广泛[33]。本研究将采用多元逐步回归构建LUR模型,具体操作流程参见图2。上述空间统计分析均在SPSS 13.0软件中完成。
图2 基于LUR模型的多元回归及登革热风险预测流程
Fig. 2 Flow chart of multivariate regression and dengue fever risk prediction based on land use regression model
本研究基于聚类分析在疫情频发的区域随机选取400个样本点,同时也在疫情低发的区域随机选取100个样本点。此外,伊蚊的飞行距离理论上在1 km范围内[34],因此因变量选取这500个样本点1 km范围内的登革热病例,并做对数变换和正态分布检验。
LUR模型选取土地利用和人口密度两类社会经济要素作为自变量,分析不同缓冲区范围内各变量对登革热病例的影响,以便更好地探索登革热疫情与不同地理要素之间的关系。本研究以500个样本点为中心建立1~10 km的缓冲区,统计不同缓冲区范围内的人口密度和各土地利用类型的面积占比。
模型采用留一交叉检验法进行精度验证,即用m-1个样本构建回归方程,计算并比较剩余一个样本的预测值与实测值[35]。这个过程被重复m次并以相对均方根误差(RRMSE)和拟合优度R2评价模型的精度[36]。
基于未来人口密度及土地利用数据,结合LUR模型以构建登革热风险预测模型。因此在研究区内生成的规则格网和格点,计算各格点在LUR模型中的因变量值,并赋值于各格点所在的格网。基于此,在研究区内创建1 km×1 km~10 km×10 km的规则格网,并统计不同格网尺度下登革热病例数的空间自相关性,采用Moran's I值筛选区域登革热空间格局的最佳格网,Moran's I一般采用Z-Score/P-value进行检验。Moran's I值越高(高Z值和适当的P值)表示相邻空间格网之间属性越相似,即登革热疫情存在明显的空间聚集特征。
式中:n为研究区格网的数目;xi与xj分别表示格网i和格网j的登革热病例数;wij代表空间权重矩阵。
SLEUTH模型基于校准得到系数重建珠三角地区2015年的土地利用空间分布。表2为珠三角地区2015年土地利用模拟结果与实际情况的混淆矩阵,总体精度为90.03%,Kappa系数为0.8498,表明珠三角地区SLEUTH模型的模拟精度较高,能满足后续模拟2030年土地利用数据分析的需要,其作为LUR风险预测模型的主要输入参数具有一定的可靠性。
表2 珠三角地区2015年的模拟土地利用图与实际土地利用图的混淆矩阵
Tab. 2 The confusion matrix of simulated land use and actual land use in Pearl River Delta in 2015 (km2)
| 城镇 用地 | 耕地 | 草地 | 林地 | 水域 | 湿地 | 未利 用地 | 农村居 民用地 | 其他建 设用地 | 模拟 面积 | |
|---|---|---|---|---|---|---|---|---|---|---|
| 城镇用地 | 4425.35 | 441.68 | 25.57 | 244.17 | 41.82 | 115.60 | 0 | 105.18 | 100.63 | 5499.99 |
| 耕地 | 37.61 | 10 904.08 | 53.16 | 836.98 | 80.18 | 240.77 | 0.46 | 240.94 | 124.30 | 12 518.50 |
| 草地 | 1.09 | 54.60 | 891.99 | 144.52 | 2.02 | 14.46 | 0.12 | 5.64 | 5.76 | 1120.20 |
| 林地 | 33.98 | 753.35 | 142.27 | 26 360.47 | 24.13 | 137.66 | 0.52 | 65.32 | 82.77 | 27 600.48 |
| 水域 | 6.74 | 76.84 | 1.96 | 29.20 | 888.36 | 22.29 | 0.12 | 10.14 | 10.66 | 1046.30 |
| 湿地 | 10.60 | 194.57 | 12.61 | 147.34 | 22.64 | 2092.43 | 0.12 | 17.45 | 24.71 | 2522.48 |
| 未利用地 | 0 | 0.29 | 0 | 0.81 | 0.23 | 0.06 | 5.30 | 0.17 | 0.06 | 6.91 |
| 农村居民用地 | 2.48 | 221.47 | 4.49 | 67.68 | 11.69 | 15.15 | 0 | 1246.29 | 20.10 | 1589.35 |
| 其他建设用地 | 8.99 | 111.46 | 5.93 | 89.16 | 11.98 | 24.99 | 0.40 | 12.79 | 1558.48 | 1824.19 |
| 实际面积 | 4526.84 | 12 758.34 | 1138.00 | 27 920.33 | 1083.05 | 2663.42 | 7.03 | 1703.92 | 1927.47 | 53 728.42 |
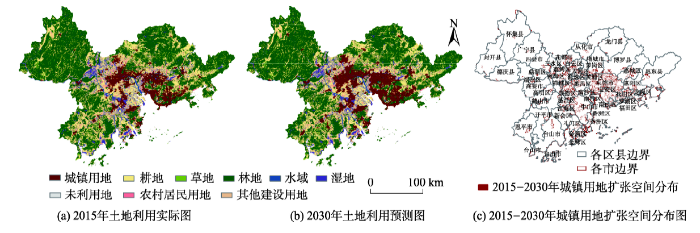
对比2015年土地利用实际情况和SLEUTH的模拟结果(图3(a)、图3(b)),珠三角地区的城镇用地面积显著增加,且扩张的方式主要是基于城镇用地进行边缘增长,大的城市斑块主要向着东南和东部的深圳、东莞等地扩张。此外,新增的城镇用地主要还分布在广佛地区的交界地带如广州市的白云北部、花都中部、番禺西北部、天河以及佛山市的南海东部、顺德东部、禅城和三水南部(图3(c))。而现已高度城市化的海珠、荔湾和越秀区则几乎没有新增的城市斑块,展现出城市化趋于饱和的状态。
表3为各环境变量在不同缓冲区半径下与 1 km范围内登革热病例数的相关性分析,除农村居民用地和其他建设用地占比外,其余变量均与登革热疫情呈现显著的相关性(p<0.01),且不同环境变量在不同研究范围内与疫情空间分异的相关性具有明显的差异。其中,城镇用地占比和人口密度均与登革热疫情呈现明显的正相关,并在10 km范围内相关系数最高。说明登革热疫情与较大范围的城镇用地占比和人口密度相关,且区域内人口密度和城镇用地占比越高,登革热疫情大体呈现越严重的趋势。在其他各类土地类型变量中,林地与登革热疫情的空间分异呈现显著的负相关,其次是耕地、草地和湿地,说明区域内这4类土地利用类型占比越高,登革热疫情的风险将有所降低。
表3 各变量与登革热病例的相关性
Tab. 3 Pearson correlation between the local epidemic of dengue fever and variables
| 序号 | 土地利用覆盖类型的占比 | 人口密度 /(万人/km2) | |||||||
|---|---|---|---|---|---|---|---|---|---|
| 耕地 | 林地 | 草地 | 水域 | 湿地 | 城镇 用地 | 农村居民 用地 | 其他建设 用地 | ||
| 1 | -0.403** | -0.625** | -0.190** | 0.114* | -0.247* | 0.696** | -0.011 | -0.049 | 0.626** |
| 2 | -0.412** | -0.642** | -0.298** | 0.197** | -0.243** | 0.726** | -0.004 | -0.046 | 0.604** |
| 3 | -0.423** | -0.652** | -0.372** | 0.269** | -0.220** | 0.750** | -0.049 | -0.054 | 0.621** |
| 4 | -0.424** | -0.655** | -0.411** | 0.320** | -0.206** | 0.770** | -0.046 | -0.039 | 0.643** |
| 5 | -0.418** | -0.661** | -0.423** | 0.340** | -0.204** | 0.785** | -0.037 | -0.004 | 0.674** |
| 6 | -0.407** | -0.666** | -0.440** | 0.358** | -0.220** | 0.795** | -0.023 | 0.037 | 0.703** |
| 7 | -0.397** | -0.670** | -0.473** | 0.392** | -0.192** | 0.804** | 0.001 | 0.090* | 0.730** |
| 8 | -0.384** | -0.675** | -0.493** | 0.427** | -0.181** | 0.810** | 0.030 | 0.141** | 0.751** |
| 9 | -0.368** | -0.678** | -0.509** | 0.456** | -0.169** | 0.814** | 0.064 | 0.179** | 0.767** |
| 10 | -0.347** | -0.681** | -0.527** | 0.476** | -0.161** | 0.818** | 0.099* | 0.214** | 0.779** |
(3)
式中:Xp代表人口密度;Xg代表草地占比;Xu代表城镇用地占比;Xfor代表林地占比;Xfar代表耕地占比。回归方程的调整R2为0.796,F检验统计量为390.409(p<0.01),所有自变量均在5%显著性水平上通过t检验(p<0.05),说明该回归方程具有一定的科学意义,且人口密度以及城镇用地、草地、林地和耕地等土地利用类型的占比均与登革热疫情存在显著的线性关系。式(3)为LUR模型逐步回归分析的方程(表4)。
表4 登革热LUR模型参数检验
Tab. 4 Parameter estimation tests of LUR model
| 自变量 | 系数 | 标准误差sx | t值 | P值 |
|---|---|---|---|---|
| 常数 | 1.000 | 0.103 | 9.682 | 0.000 |
| 人口密度_10 km | 0.045 | 0.004 | 11.439 | 0.000 |
| 草地_7 km | -14.947 | 2.510 | -5.956 | 0.000 |
| 城镇用地_10 km | 0.651 | 0.254 | 2.564 | 0.011 |
| 林地_2 km | -1.907 | 0.141 | -13.534 | 0.000 |
| 耕地_1 km | -0.794 | 0.170 | -4.663 | 0.000 |
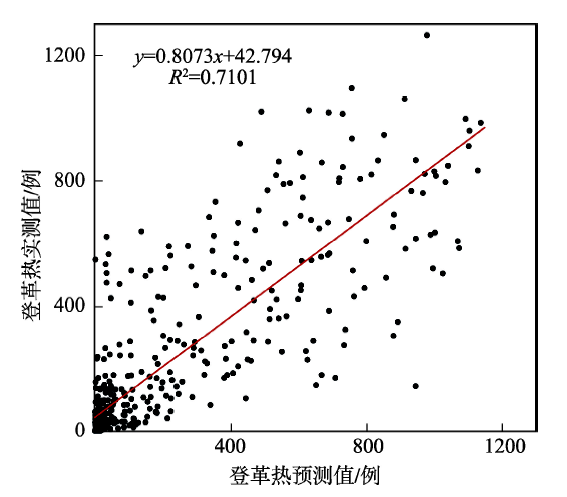
留一交叉检验结果表明,模型的相对均方根误差(RRMSE)为0.7046。图4为登革热病例预测值与实测值的散点图,其中横坐标表示登革热病例的预测值(以2010年人口密度(10 km)、草地占比 (7 km)、城镇用地占比(10 km)、林地占比(2 km)和耕地占比(1 km)为自变量,基于式3计算500个样本点的登革热病例值),纵坐标表示500个样本点 1 km范围内的登革热病例实测值。图4的结果表明LUR模型的R2(拟合优度)达到0.7101,虽然模型仍会受到疫情特异性的影响,但整体模拟效果较好,即可以用于2030年登革热疫情风险的空间分布模拟。
图4 样本点1 km范围内的登革热预测值-实测值散点图
Fig. 4 Scatter plot of predicted and measured dengue fever cases whthin 1km of sample points
表5为珠三角地区登革热疫情在不同空间尺度下的空间自相关性,结果表明在4 km×4 km格网尺度下的Moran's I值最高,说明在该尺度下能较好的呈现登革热流行的空间聚类能力。
表5 珠三角地区登革热病例空间自相关分析
Tab. 5 Spatial autocorrelation analysis of dengue fever in Pearl River Delta
| 1 km | 2 km | 3 km | 4 km | 5 km | 6 km | 7 km | 8 km | 9 km | 10 km | |
|---|---|---|---|---|---|---|---|---|---|---|
| Moran's I | 0.590 | 0.729 | 0.725 | 0.770 | 0.732 | 0.665 | 0.646 | 0.465 | 0.568 | 0.540 |
| Z-score | 417.159 | 206.795 | 119.043 | 69.811 | 57.308 | 45.011 | 40.311 | 35.731 | 29.685 | 26.457 |
| P-value | 0.000 | 0.000 | 0.000 | 0.000 | 0.000 | 0.000 | 0.000 | 0.000 | 0.000 | 0.000 |
基于SLEUTH模型模拟的珠三角地区2030年土地利用数据以及基于人口密度预测模型获取的2030年珠三角人口密度数据,结合珠三角地区登革热LUR模型(式(3)),最终构建了珠三角地区2030年登革热风险的空间分布图(图5,4 km×4 km)。登革热风险较大的区域除了当前较严重的广佛地区,还有东莞市的北部以及深圳市,与2030年城镇用地的空间分布结果有较高的一致性。
图5 珠三角地区2030年登革热风险预测空间分布
Fig. 5 Spatial distribution of dengue risk prediction in Pearl River Delta in 2030
本研究应用LUR模型探析了登革热疫情与社会经济要素之间的关系,并利用SLEUTH模型模拟得到珠三角地区2030年土地利用数据,在此基础上构建基于LUR模型的珠三角地区2030年登革热疫情风险预测模型,取得了较好的效果。
未来土地利用数据和其他社会经济要素数据是登革热风险预测模型的重要输入参数,而考虑到道路密度和GDP等其他社会经济要素的预测较复杂,因此本研究采用土地利用和人口密度数据作为LUR登革热风险预测模型的自变量。结果表明,人口密度、城镇用地占比、草地、耕地和林地占比是影响登革热空间分异的主要影响因素,与Qi等[13]基于非线性模型探析登革热影响因素的结果具有相似性。就LUR模型筛选的各影响因素而言,Zhu等[37]指出,一定程度的人口聚集是登革热得以传播与流行的重要条件,本研究的登革热LUR模型也证实了人口密度和城镇用地对疫情空间分异的显著影响。其为珠三角地区的高度城市化区域(如广佛)疫情相对严重的现象提供合理解释,而这些区域的人口相对聚集,城市化水平较高,更易形成人-蚊接触所需的条件并引发登革热疫情。其次,一定的植被覆盖(如林地、耕地和草地)为蚊媒的孳生和活动提供了较好的条件,也为人们提供了纳凉的场所,进而增加了人-蚊接触的概率和疫情的风险,但植被覆盖高的地区人烟稀少(如珠三角地区东北、西北和西南部覆盖的大范围植被),因此登革热疫情的风险大大降低。
登革热疫情还与蚊媒生存所需的水环境密切相关[38],但水域和湿地两个变量最终却未进入LUR模型。首先,本研究以登革热疫情病例为因变量而非蚊媒监测数据,因此不能仅考虑水环境对蚊媒的正面影响。且湿地、水体等地类的确相对适宜蚊虫孳生,却并非是登革热疫情传播的充要条件。前人研究表明,登革热疫情的传播和流行不仅要有一定丰度的蚊媒,更重要的是还需要有足够的人口数量,而水域和湿地等区域人口分布相对较少,导致登革热风险有所降低。此外,从蚊媒方面考虑,相较于大尺度的江河湖泊和滩涂,街道尺度上的水浇地等地类风速小、卫生环境相对较差,相较而言更适合伊蚊的孳生[38]。不仅如此,加上此类区域较大的人口密度,因而其登革热疫情传播与流行的风险也较大。
本研究基于土地利用和人口密度两类因素,探析了影响登革热流行的变量和风险预测模型,LUR预测模型的拟合优度达到0.7101。结果表明,2030年广佛地区、深圳和东莞市均存在较高的登革热流行风险,与Li等[14]基于生态位模型的登革热风险研究成果一致,说明LUR模型应用于预测登革热风险的空间分布中具有可行性。这些地区均有人口密度大、流动人口多、城镇化水平高且植被覆盖水平不高等特点,特别是当下疫情高发的广佛地区,城市化快速发展、人口高度聚集的同时,老城区、城中村的卫生整治并没有齐头并进是形成登革热疫情的一大重要隐患。
本研究仍存在一定的局限性。首先在模型的可行性方面,尽管以年为时间尺度的登革热风险预测探索研究对于未来登革热风险的空间模拟具有一定参考意义,但若要满足近期、短期疫情风险的空间预测和预警的需求还需要进一步的完善研究。例如,细化时间分辨率,分析季或月等短期时间尺度内登革热疫情的影响因素;进一步考虑时间滞后性对的疫情的影响,构建时空LUR模型来提升预测登革热疫情空间分布能力;丰富社会经济要素数据,在未来研究中应将气候要素、蚊媒密度、路网密度及街道景观格局等影响因素加入模型的影响因素中进行回归,以便更好地提升模型的科学性。其次,LUR模型虽然能基于未来土地利用和人口密度数据较好的模拟和预测登革热疫情的空间分异情况,但其作为线性回归模型在解决诸多非线性的复杂地理问题中仍存在局限性,而广义加性模型、BP神经网络模型等非线性模型的加入能在一定程度上改善模型的适宜性和精度。最后,本研究仅考虑本地病例,对于登革热这一类输入性疫情在我国流行于传播风险的模拟与评估,在后续研究中应该考虑输入性病例对登革热疫情的影响。
本研究基于LUR模型对珠江三角洲地区的登革热疫情与土地利用、人口密度2个变量之间做多元逐步回归,以探析在不同空间范围内各要素对登革热疫情的影响。此外,本研究还采用SLEUTH模型预测2030年的土地利用扩张数据,以及人口密度预测模型预测2030年的人口密度空间分布数据,并绘制了2030年登革热流行风险的空间分布图。基于此,本研究得出以下结论:
(1)人口密度大、城镇用地占比高以及具备一定植被覆盖率的地区会增加珠三角地区登革热疫情的风险。LUR模型的回归方程调整R2为0.7960,模型的相对均方根误差为0.7046,且登革热预测值与实测值的拟合优度达到0.7101,上述均表明LUR模型在模拟珠三角地区登革热疫情的空间分布中精度较好,其应用于珠三角未来的登革热风险预测上具有一定的可行性。
(2)未来珠三角地区的登革热风险空间分布与当前高度城市化和人口高度聚集的地区存在较大一致性,均为广佛地区,以及东莞市的北部和深圳市。
(3)探析登革热疫情的影响要素在一定程度上可为当地疾控部门制定解决方案、降低风险提供重要的方法参考;而登革热风险预测的研究结果可为有关部门提供未来需要重点防范的登革热疫情高风险区。
The authors have declared that no competing interests exist.
| [1] |
基于机器学习的登革热时空扩散预测模型对比分析 [J].https://doi.org/10.3969/j.issn.1672-1586.2016.06.002 URL [本文引用: 1] 摘要
BP神经网络、GA-BP神经网络及SVR模型是机器学习领域常用的三种预测方法,但在登革热预测方面鲜有人涉及。本文以广州市主城区登革热预测为例,对比BP神经网络、GA-BP神经网络及SVR模型在登革热时空预测上的作用,比较三种模型在登革热时空动态预测中的优劣性。研究表明,1从模型预测效果上看,SVR模型稳定,预测效果显著优于BP及GA-BP模型;2从模型性能上看,GA-BP模型优于BP及SVR模型; 3SVR与GA-BP模型在登革热预测上切实可行。
Comparing of spatio-temporal diffusion prediction models of dengue fevers based on machine learning [J].https://doi.org/10.3969/j.issn.1672-1586.2016.06.002 URL [本文引用: 1] 摘要
BP神经网络、GA-BP神经网络及SVR模型是机器学习领域常用的三种预测方法,但在登革热预测方面鲜有人涉及。本文以广州市主城区登革热预测为例,对比BP神经网络、GA-BP神经网络及SVR模型在登革热时空预测上的作用,比较三种模型在登革热时空动态预测中的优劣性。研究表明,1从模型预测效果上看,SVR模型稳定,预测效果显著优于BP及GA-BP模型;2从模型性能上看,GA-BP模型优于BP及SVR模型; 3SVR与GA-BP模型在登革热预测上切实可行。
|
| [2] |
Global epidemiology of dengue outbreaks in 1990-2015: A systematic review and meta-analysis [J].https://doi.org/10.3389/fcimb.2017.00317 URL PMID: 5506197 [本文引用: 1] 摘要
Dengue is an arthropod-borne infectious disease caused by dengue virus (DENV) infection and transmitted byAedesmosquitoes. Approximately 50 100 million people are infected with DENV each year, resulting in a high economic burden on both governments and individuals. Here, we conducted a systematic review and meta-analysis to summarize information regarding the epidemiology, clinical characteristics, and serotype distribution and risk factors for global dengue outbreaks occurring from 1990 to 2015. We searched the PubMed, Embase and Web of Science databases through December 2016 using the term engue outbreak. In total, 3,853 studies were identified, of which 243 studies describing 262 dengue outbreaks met our inclusion criteria. The majority of outbreak-associated dengue cases were reported in the Western Pacific Region, particularly after the year 2010; these cases were primarily identified in China, Singapore and Malaysia. The pooled mean age of dengue-infected individuals was 30.1 years; of the included patients, 54.5% were male, 23.2% had DHF, 62.0% had secondary infections, and 1.3% died. The mean age of dengue patients reported after 2010 was older than that of patients reported before 2010 (34.0 vs. 27.2 years); however, the proportions of patients who had DHF, had secondary infections and died significantly decreased after 2010. Fever, malaise, headache, and asthenia were the most frequently reported clinical symptoms and signs among dengue patients. In addition, among the identified clinical symptoms and signs, positive tourniquet test (OR= 4.86), ascites (OR= 13.91) and shock (OR= 308.09) were identified as the best predictors of dengue infection, DHF and mortality, respectively (bothP< 0.05). The main risk factors for dengue infection, DHF and mortality were living with uncovered water container (OR= 1.65), suffering from hypotension (OR= 6.18) and suffering from diabetes mellitus (OR= 2.53), respectively (allP< 0.05). The serotype distribution varied with time and across WHO regions. Overall, co-infections were reported in 47.7% of the evaluated outbreaks, and the highest pooled mortality rate (2.0%) was identified in DENV-2 dominated outbreaks. Our study emphasizes the necessity of implementing programs focused on targeted prevention, early identification, and effective treatment.
|
| [3] |
Review: Dengue fever in mainland China [J].https://doi.org/10.4269/ajtmh.2010.09-0755 URL PMID: 2929067 [本文引用: 1] 摘要
Abstract.Dengue is an acute emerging infectious disease transmitted by Aedes mosquitoes and has become a serious global public health problem. In mainland China, a number of large dengue outbreaks with serious consequences have been reported as early as 1978. In the three decades from 1978 to 2008, a total of 655,324 cases were reported, resulting in 610 deaths. Since the 1990s, dengue epidemics have spread gradually from Guangdong, Hainan, and Guangxi provinces in the southern coastal regions to the relatively northern and western regions including Fujian, Zhejiang, and Yunnan provinces. As the major transmission vectors of dengue viruses, the biological behavior and vectorial capacity of Aedes mosquitoes have undergone significant changes in the last two decades in mainland China, most likely the result of urbanization and global climate changes. In this review, we summarize the geographic and temporal distributions, the serotype and genotype distributions of dengue viruses in mainland China, and analyze the current status of surveillance and control of vectors for dengue transmission.
|
| [4] |
Epidemiological and etiological investigation of dengue fever in the Fujian province of China during 2004-2014 [J].https://doi.org/10.1007/s11427-016-0021-y URL PMID: 27812857 [本文引用: 1] 摘要
Dengue fever (DF) is a vector-borne disease and a tremendous socioeconomic burden on tropical and subtropical countries worldwide. To explore the characteristics of DF epidemic in the Fujian province, information of DF cases in Fujian during 2004 2014 was collected and analyzed. The complete E genes of 48 viral isolates were amplified and sequenced for phylogenetic analysis. A total of 733 cases was reported, of which 612 (83.5%) occurred during the peak period from August to October. Additionally, 76% (190/250) of imported cases originated from Southeast Asia countries, by the epidemiological investigation. Phylogenetic analysis of the 48 viral isolates revealed that three genotypes (I, IV, V) of DENV1, and one genotype each of DENV2 (cosmopolitan) and DENV3 (I) circulated in Fujian during 2004 2014. Similar to the results of the epidemiological investigations, the source of most of the viral isolates, including imported and indigenous cases, may be Southeast Asia countries; however, importation from adjacent provinces was also observed in recent years. Overall, DF is considered an imported epidemic disease in Fujian. Increasing diversity of the viral source and geographic expansion of the area affected by DF in recent years highlights the necessity for strengthening surveillance of the DF epidemic and developing strategies for DF prevention and control in Fujian.
|
| [5] |
Dengue virus infections among blood donors in Guangxi of China, 2013-2014 [J].https://doi.org/10.1111/tme.12448 URL PMID: 28758700 [本文引用: 1] 摘要
Dengue is the most important mosquito-borne viral disease in the world and is endemic in more than 100 countries, with an estimated 100 million infected cases and 25,000 deaths per year worldwide1. Dengue virus (DENV) is caused by a single-stranded RNA virus with five serotypes (DENV-1, DENV-2, DENV-3, DENV-4 and DENV-5)1,2 and its clinical picture ranges from relatively mild Dengue fever, to... [Show full abstract]
|
| [6] |
Infectious diseases and tropical cyclones in southeast China .[J].https://doi.org/10.3390/ijerph14050494 URL PMID: 5451945 [本文引用: 1] 摘要
Southeast China is frequently hit by tropical cyclones (TCs) with significant economic and health burdens each year. However, there is a lack of understanding of what infectious diseases could be affected by tropical cyclones. This study aimed to examine the impacts of tropical cyclones on notifiable infectious diseases in southeast China. Disease data between 2005 and 2011 from four coastal provinces in southeast China, including Guangdong, Hainan, Zhejiang, and Fujian province, were collected. Numbers of cases of 14 infectious diseases were compared between risk periods and reference periods for each tropical cyclone. Risk ratios (RRs) were calculated to estimate the risks. TCs were more likely to increase the risk of bacillary dysentery, paratyphoid fever, dengue fever and acute hemorrhagic conjunctivitis (ps< 0.05) than to decrease the risk, more likely to decrease the risk of measles, mumps, varicella and vivax malaria (ps< 0.05) than to increase the risk. In conclusion, TCs have mixed effects on the risk of infectious diseases. TCs are more likely to increase the risk of intestinal and contact transmitted infectious diseases than to decrease the risk, and more likely to decrease the risk of respiratory infectious diseases than to increase the risk. Findings of this study would assist in developing public health strategies and interventions for the reduction of the adverse health impacts from tropical cyclones.
|
| [7] |
2012-2017年广东省登革热疫情流行特点与趋势 [J].
目的对广东省2012-2017年登革热疫情进行分析,为广东省乃至中国大陆地区登革热疫情防控提供科学依据。方法通过"中国疾病预防控制信息系统"获得登革热病例信息进行流行病学三间分析,对部分实验室确诊病例开展登革病毒检测及血清型分型。结果 2012-2017年,广东省累计报告52 441例登革热病例,其中输入病例642例,本地病例51 799例。输入病例数、波及地市和县区数均呈上升趋势,各地市输入病例年均发病率0.01/10万~0.26/10万。本地病例中珠三角地区病例占92.88%(48 109/51 799),各地市本地病例年均发病率0.05/10万~47.29/10万。输入病例各月均有报告,高峰出现在8~10月;本地病例主要发生在7~11月,高峰为9~10月。输入病例中男性399例(年均发病率0.12/10万)、女性243例(年均发病率0.08/10万),男女性发病率差异有统计学意义(χ2=25.02,P0.01);本地病例中男性25 624例(年均发病率7.53/10万)、女性26 175例(年均发病率8.43/10万),男女性发病率差异有统计学意义(χ2=165.25,P0.01)。输入病例发病率0.01/10万~0.20/10万,30~39岁年龄组最高;本地病例发病率3.11/10万~14.00/10万,60~69岁年龄组最高。对广东省1 084份登革热确诊病例血清标本进行登革病毒血清分型,其中Ⅰ型占74.91%(812/1 084)、Ⅱ型占20.30%(220/1 084)、Ⅲ型占3.78%(41/1 084)、Ⅳ型占1.01%(11/1 084)。结论广东省登革热输入病例呈逐年增加趋势;本地病例呈大幅波动,以老年人群发病率高;多种病毒型别同时或交替流行。
Epidemiological characteristics and trends of dengue fever from 2012 to 2017 in Guangdong province of China [J].
目的对广东省2012-2017年登革热疫情进行分析,为广东省乃至中国大陆地区登革热疫情防控提供科学依据。方法通过"中国疾病预防控制信息系统"获得登革热病例信息进行流行病学三间分析,对部分实验室确诊病例开展登革病毒检测及血清型分型。结果 2012-2017年,广东省累计报告52 441例登革热病例,其中输入病例642例,本地病例51 799例。输入病例数、波及地市和县区数均呈上升趋势,各地市输入病例年均发病率0.01/10万~0.26/10万。本地病例中珠三角地区病例占92.88%(48 109/51 799),各地市本地病例年均发病率0.05/10万~47.29/10万。输入病例各月均有报告,高峰出现在8~10月;本地病例主要发生在7~11月,高峰为9~10月。输入病例中男性399例(年均发病率0.12/10万)、女性243例(年均发病率0.08/10万),男女性发病率差异有统计学意义(χ2=25.02,P0.01);本地病例中男性25 624例(年均发病率7.53/10万)、女性26 175例(年均发病率8.43/10万),男女性发病率差异有统计学意义(χ2=165.25,P0.01)。输入病例发病率0.01/10万~0.20/10万,30~39岁年龄组最高;本地病例发病率3.11/10万~14.00/10万,60~69岁年龄组最高。对广东省1 084份登革热确诊病例血清标本进行登革病毒血清分型,其中Ⅰ型占74.91%(812/1 084)、Ⅱ型占20.30%(220/1 084)、Ⅲ型占3.78%(41/1 084)、Ⅳ型占1.01%(11/1 084)。结论广东省登革热输入病例呈逐年增加趋势;本地病例呈大幅波动,以老年人群发病率高;多种病毒型别同时或交替流行。
|
| [8] |
2004-2013年间中国登革热疫情时空变化分析 [J].https://doi.org/10.3724/SP.J.1047.2015.00614 URL Magsci [本文引用: 1] 摘要
<p>通过对登革热疫情分布及时空变化的分析,发现该病的分布和流行规律,将有助于登革热防控工作的开展。本文以2004-2013年间传染病网络直报系统的全国地市级登革热逐月发病率资料为基础,就发病率、涉及地市以及与输入性病例之间的关系,进行空间统计学分析。结果表明:中国登革热发病率的对数值与国外输入性病例数呈显著相关(<em>r</em>=0.669,<em>p</em><0.05);登革热输入性病例地市(有输入性病例的地市)数量与登革热本地病例地市(有登革热本地病例的地市)数量呈显著线性相关(<em>r</em>=0.939,<em>p</em><0.05);疫情整体呈稳步递增的趋势,且发病率重心不稳定,从东南沿海(广东、福建)逐步向内陆和西南地区(云南边界)迁移,显示登革热可能流行范围正在扩大;中国登革热疫情呈现波动性非随机空间分布,其高聚集区主要分布在广东的珠江三角洲、韩江三角洲,以及西南边境的云南德宏傣族景颇族自治州和西双版纳傣族自治州。中国登革热疫情是由输入性病例引起的本地流行,因此,加强入境人员(特别是来自东南亚疫区)的健康教育,尤其在输入性病例输入高风险时间段(7-10月),对控制登革热疫情有重要意义。</p>
Spatial and temporal variations of dengue fever epidemics in China from 2004 to 2013 [J].https://doi.org/10.3724/SP.J.1047.2015.00614 URL Magsci [本文引用: 1] 摘要
<p>通过对登革热疫情分布及时空变化的分析,发现该病的分布和流行规律,将有助于登革热防控工作的开展。本文以2004-2013年间传染病网络直报系统的全国地市级登革热逐月发病率资料为基础,就发病率、涉及地市以及与输入性病例之间的关系,进行空间统计学分析。结果表明:中国登革热发病率的对数值与国外输入性病例数呈显著相关(<em>r</em>=0.669,<em>p</em><0.05);登革热输入性病例地市(有输入性病例的地市)数量与登革热本地病例地市(有登革热本地病例的地市)数量呈显著线性相关(<em>r</em>=0.939,<em>p</em><0.05);疫情整体呈稳步递增的趋势,且发病率重心不稳定,从东南沿海(广东、福建)逐步向内陆和西南地区(云南边界)迁移,显示登革热可能流行范围正在扩大;中国登革热疫情呈现波动性非随机空间分布,其高聚集区主要分布在广东的珠江三角洲、韩江三角洲,以及西南边境的云南德宏傣族景颇族自治州和西双版纳傣族自治州。中国登革热疫情是由输入性病例引起的本地流行,因此,加强入境人员(特别是来自东南亚疫区)的健康教育,尤其在输入性病例输入高风险时间段(7-10月),对控制登革热疫情有重要意义。</p>
|
| [9] |
Climate change and mosquito-borne diseases in China: A review [J].https://doi.org/10.1186/1744-8603-9-10 URL PMID: 3605364 [本文引用: 1] 摘要
China has experienced noticeable changes in climate over the past 100 ears and the potential impact climate change has on transmission of mosquito-borne infectious diseases poses a risk to Chinese populations. The aims of this paper are to summarize what is known about the impact of climate change on the incidence and prevalence of malaria, dengue fever and Japanese encephalitis in China and to provide important information and direction for adaptation policy making. Fifty-five papers met the inclusion criteria for this study. Examination of these studies indicates that variability in temperature, precipitation, wind, and extreme weather events is linked to transmission of mosquito-borne diseases in some regions of China. However, study findings are inconsistent across geographical locations and this requires strengthening current evidence for timely development of adaptive options. After synthesis of available information we make several key adaptation recommendations including: improving current surveillance and monitoring systems; concentrating adaptation strategies and policies on vulnerable communities; strengthening adaptive capacity of public health systems; developing multidisciplinary approaches sustained by an new mechanism of inter-sectional coordination; and increasing awareness and mobilization of the general public.
|
| [10] |
Recent and future environmental suitability to dengue fever in Brazil using species distribution model [J].https://doi.org/10.1093/trstmh/trt115 URL PMID: 24463584 [本文引用: 1] 摘要
Abstract BACKGROUND: Dengue fever is a mosquito-borne disease that affects more than 2.5 billion people worldwide. Here, we used the dataset of municipality infestation level from the Brazilian Health Ministry with the aim of building vector distribution models to identify epidemiological hotspots. METHODS: Maxent software was used to predict the environmental suitability of the vector under current and 2050 climatic conditions. We built potential risk maps for current and future epidemiological scenarios in order to provide data for vector control planning. RESULTS: The results showed that the current epidemiological status is critical in the coastal region, with 80% of the population in risk areas and 30% in epidemiological outbreak areas. Our results also suggest that the area covered by the vector distribution in Brazil will decrease in future projections in the north, but will spread to the south. CONCLUSIONS: The results may provide useful information for health agencies and policymakers in focusing efforts in epidemiological hotspots. Therefore, understanding the niche distribution dynamics of Aedes aegypti is an important step towards public health planning for vector control.
|
| [11] |
Climate change and the emergence of vector-borne diseases in Europe: Case study of dengue fever [J].https://doi.org/10.1186/1471-2458-14-781 URL PMID: 4143568 [本文引用: 1] 摘要
Background Dengue fever is the most prevalent mosquito-borne viral disease worldwide. Dengue transmission is critically dependent on climatic factors and there is much concern as to whether climate change would spread the disease to areas currently unaffected. The occurrence of autochthonous infections in Croatia and France in 2010 has raised concerns about a potential re-emergence of dengue in Europe. The objective of this study is to estimate dengue risk in Europe under climate change scenarios. Methods We used a Generalized Additive Model (GAM) to estimate dengue fever risk as a function of climatic variables (maximum temperature, minimum temperature, precipitation, humidity) and socioeconomic factors (population density, urbanisation, GDP per capita and population size), under contemporary conditions (1985???2007) in Mexico. We then used our model estimates to project dengue incidence under baseline conditions (1961???1990) and three climate change scenarios: short-term 2011???2040, medium-term 2041???2070 and long-term 2071???2100 across Europe. The model was used to calculate average number of yearly dengue cases at a spatial resolution of 10 ?? 10 km grid covering all land surface of the currently 27 EU member states. To our knowledge, this is the first attempt to model dengue fever risk in Europe in terms of disease occurrence rather than mosquito presence. Results The results were presented using Geographical Information System (GIS) and allowed identification of areas at high risk. Dengue fever hot spots were clustered around the coastal areas of the Mediterranean and Adriatic seas and the Po Valley in northern Italy. Conclusions This risk assessment study is likely to be a valuable tool assisting effective and targeted adaptation responses to reduce the likely increased burden of dengue fever in a warmer world.
|
| [12] |
Dengue vector dynamics (Aedes aegypti) influenced by climate and social factors in ecuador: implications for targeted control [J].https://doi.org/10.1371/journal.pone.0078263 URL PMID: 24324542 [本文引用: 1] 摘要
Abstract BACKGROUND: Dengue fever, a mosquito-borne viral disease, is now the fastest spreading tropical disease globally. Previous studies indicate that climate and human behavior interact to influence dengue virus and vector (Aedes aegypti) population dynamics; however, the relative effects of these variables depends on local ecology and social context. We investigated the roles of climate and socio-ecological factors on Ae. aegypti population dynamics in Machala, a city in southern coastal Ecuador where dengue is hyper-endemic. METHODS/PRINCIPAL FINDINGS: We studied two proximate urban localities where we monitored weekly Ae. aegypti oviposition activity (Nov. 2010-June 2011), conducted seasonal pupal surveys, and surveyed household to identify dengue risk factors. The results of this study provide evidence that Ae. aegypti population dynamics are influenced by social risk factors that vary by season and lagged climate variables that vary by locality. Best-fit models to predict the presence of Ae. aegypti pupae included parameters for household water storage practices, access to piped water, the number of households per property, condition of the house and patio, and knowledge and perceptions of dengue. Rainfall and minimum temperature were significant predictors of oviposition activity, although the effect of rainfall varied by locality due to differences in types of water storage containers. CONCLUSIONS: These results indicate the potential to reduce the burden of dengue in this region by conducting focused vector control interventions that target high-risk households and containers in each season and by developing predictive models using climate and non-climate information. These findings provide the region's public health sector with key information for conducting time and location-specific vector control campaigns, and highlight the importance of local socio-ecological studies to understand dengue dynamics. See Text S1 for an executive summary in Spanish.
|
| [13] |
The effects of socioeconomic and environmental factors on the incidence of dengue fever in the Pearl River Delta, China, 2013 [J].https://doi.org/10.1371/journal.pntd.0004159 URL PMID: 4624777 [本文引用: 2] 摘要
An outbreak of dengue fever (DF) occurred in Guangdong Province, China in 2013 with the highest number of cases observed within the preceding ten years. DF cases were clustered in the Pearl River Delta economic zone (PRD) in Guangdong Province, which accounted for 99.6% of all cases in Guangdong province in 2013. The main vector in PRD wasAedes albopictus. We investigated the socioeconomic and environmental factors at the township level and explored how the independent variables jointly affect the DF epidemic in the PRD. Six factors associated with the incidence of DF were identified in this project, representing the urbanization, poverty, accessibility and vegetation, and were considered to be core contributors to the occurrence of DF from the perspective of the social economy and the environment. Analyses were performed with Generalized Additive Models (GAM) to fit parametric and non-parametric functions to the relationships between the response and predictors. We used a spline-smooth technique and plotted the predicted against the observed co-variable value. The distribution of DF cases was over-dispersed and fit the negative binomial function better. The effects of all six socioeconomic and environmental variables were found to be significant at the 0.001 level and the model explained 45.1% of the deviance by DF incidence. There was a higher risk of DF infection among people living at the prefectural boundary or in the urban areas than among those living in other areas in the PRD. The relative risk of living at the prefectural boundary was higher than that of living in the urban areas. The associations between the DF cases and population density, GDP per capita, road density, and NDVI were nonlinear. In general, higher “road density” or lower “GDP per capita” were considered to be consistent risk factors. Moreover, higher or lower values of “population density” and “NDVI” could result in an increase in DF cases. In this study, we presented an effect analysis of socioeconomic and environmental factors on DF occurrence at the smallest administrative unit (township level) for the first time in China. GAM was used to effectively detect the nonlinear impact of the predictors on the outcome. The results showed that the relative importance of different risk factors may vary across the PRD. This work improves our understanding of the differences and effects of socioeconomic and environmental factors on DF and supports effectively targeted prevention and control measures. Dengue fever is an infectious disease transmitted by mosquitoes. It is a major public health problem in tropical and subtropical regions around the world. Dengue fever is of great interest in the Pearl River Delta economic zone (PRD) of Guangdong province, China because the outbreak in 2013 was the largest in the previous 10 years. Due to the low degree of diversity in the climatic conditions in the PRD, socioeconomic and environmental factors may be the major contributing factors. The objective of this paper was to perform an assessment and detect the socioeconomic and environmental impact on cases at the smallest administrative unit (the township level). Six factors were identified in this work, representing urbanization, poverty, accessibility and vegetation. The effects of all these factors were found to be significant. The results showed that the relative importance of different risk factors may vary across the PRD. The higher risk areas and vulnerable populations identified in this paper will provide guidance for public health practitioners to create targeted, strategic plans and implement effective public health prevention and control measures.
|
| [14] |
Ecological niche modeling identifies fine-scale areas at high risk of dengue fever in the Pearl River Delta, China [J].https://doi.org/10.3390/ijerph14060619 URL PMID: 28598355 [本文引用: 4] 摘要
Background/Aim: The prevalence of dengue fever (DF) has become an important public health concern in some highly urbanized areas in Southern China due to its increasingly high incidence. It has been reported that the DF epidemic is closely associated with local socioeconomic conditions, and that spatially differentiated socioeconomic conditions are also markedly correlated with remotely sensed... [Show full abstract]
|
| [15] |
Exploring determinants of spatial variations in the dengue fever epidemic using geographically weighted regression model: A case study in the joint Guangzhou-Foshan area, China, 2014 [J].https://doi.org/10.3390/ijerph14121518 URL PMID: 5750936 [本文引用: 2] 摘要
Dengue fever (DF) is a common and rapidly spreading vector-borne viral disease in tropical and subtropical regions. In recent years, this imported disease has posed an increasing threat to public health in China, especially in many southern cities. Although the severity of DF outbreaks in these cities is generally associated with known risk factors at various administrative levels, spatial heterogeneities of these associations remain little understood on a finer scale. In this study, the neighboring Guangzhou and Foshan (GF) cities were considered as a joint area for characterizing the spatial variations in the 2014 DF epidemic at various grid levels from 1 1 km2to 6 6 km2. On an appropriate scale, geographically weighted regression (GWR) models were employed to interpret the influences of socioeconomic and environmental factors on this epidemic across the GF area. DF transmissions in Guangzhou and Foshan cities presented synchronous temporal changes and spatial expansions during the main epidemic months. Across the GF area, this epidemic was obviously spatially featured at various grid levels, especially on the 2 2 km2scale. Its spatial variations were relatively sufficiently explained by population size, road density, and economic status integrated in the GWR model with the lowest Akaike Information Criterion (AICc = 5227.97) and highest adjusted R square (0.732) values. These results indicated that these three socioeconomic factors acted as geographical determinants of spatial variability of the 2014 DF epidemic across the joint GF area, although some other potential factors should be added to improve the explaining the spatial variations in the central zones. This work improves our understanding of the effects of socioeconomic conditions on the spatial variations in this epidemic and helps local hygienic authorities to make targeted joint interventions for preventing and controlling this epidemic across the GF area.
|
| [16] |
基于遥感与地理信息技术的登革热环境风险因子标识 [J].
目的通过分析广州市2002年 登革热疫情数据,采用遥感以及地理信息系统技术标识与登革热(DF)的流行风险相关的地表景观种类。方法首先,通过基于泊松模型的回顾式空间-时间分析方 法获取疫情数据的时空聚集状况。其后,从MODIS卫星图像中提取地表景观信息,并逐月逐区计算各地类所占对应研究区的面积比例。最终,由广义线性模型分 析确定DF病例的存在与否与地表景观种类面积比例的关系,并使用二态逻辑回归分析建立预测模型。结果最有可能的登革热聚集圈中心位于东山区,同时覆盖越秀 区以及荔湾区,其时间窗为8月至10月。最佳预测模型对"某行政区在气候条件允许下是否存在登革热病例"的预测达到了91.1%的准确度。结论开放水域, 以沼泽和湿地为主的湿草场,以水稻为主的农田以及开发用地被标识为与登革热病例存在与否最为相关的地类因子。
Remote sensing and geoinformatics based environmental risk factors identification of dengue fever [J].
目的通过分析广州市2002年 登革热疫情数据,采用遥感以及地理信息系统技术标识与登革热(DF)的流行风险相关的地表景观种类。方法首先,通过基于泊松模型的回顾式空间-时间分析方 法获取疫情数据的时空聚集状况。其后,从MODIS卫星图像中提取地表景观信息,并逐月逐区计算各地类所占对应研究区的面积比例。最终,由广义线性模型分 析确定DF病例的存在与否与地表景观种类面积比例的关系,并使用二态逻辑回归分析建立预测模型。结果最有可能的登革热聚集圈中心位于东山区,同时覆盖越秀 区以及荔湾区,其时间窗为8月至10月。最佳预测模型对"某行政区在气候条件允许下是否存在登革热病例"的预测达到了91.1%的准确度。结论开放水域, 以沼泽和湿地为主的湿草场,以水稻为主的农田以及开发用地被标识为与登革热病例存在与否最为相关的地类因子。
|
| [17] |
基于反向传播神经网络模型的广东省登革热疫情预测研究 [J].
目的构建并校验基于反向传播(BP)神经网络的登革热疫情预测模型,为登革热疫情的防控工作提供方法参考。方法基于登革热疫情资料和地理环境时空数据,分析登革热的时空分布特征及登革热病例空间自相关性,并采用Pearson相关系数对广州和佛山市(广佛)的登革热疫情及其影响因素进行相关性分析;然后利用Matlab 7.0软件完成BP神经网络预测模型的构建、训练和模拟。结果 2014年8-10月广佛地区登革热病例的空间分布中,发生本地病例数最高分别为90、386和456例/km~2,疫情空间分布主要聚集在广佛交界处;广佛地区登革热本地疫情在1 km×1 km尺度上具有极显著的空间自相关性(P=0.001,Z=134.402 5,全局Moran.s I指数=0.606 5);当月(8-10月)登革热本地病例疫情与上月(7-9月)疫情(本地病例与输入性病例)、气象(温度、湿度、降雨量)、社会(人口密度、城乡居民用地、林地、耕地)等多因素间存在不同程度的相关性;基于BP神经网络的登革热疫情预测模型的预测值与真实值相关系数为0.773,均方根误差为7.522 0。结论广佛地区的登革热疫情并非随机分布,具有明显的空间聚集性;登革热的发生受多种因素综合影响,基于BP神经网络模型可以有效地预测广佛地区登革热疫情的时空分布。
Prediction of dengue fever based on back propagation neural network model in Guangdong, China [J].
目的构建并校验基于反向传播(BP)神经网络的登革热疫情预测模型,为登革热疫情的防控工作提供方法参考。方法基于登革热疫情资料和地理环境时空数据,分析登革热的时空分布特征及登革热病例空间自相关性,并采用Pearson相关系数对广州和佛山市(广佛)的登革热疫情及其影响因素进行相关性分析;然后利用Matlab 7.0软件完成BP神经网络预测模型的构建、训练和模拟。结果 2014年8-10月广佛地区登革热病例的空间分布中,发生本地病例数最高分别为90、386和456例/km~2,疫情空间分布主要聚集在广佛交界处;广佛地区登革热本地疫情在1 km×1 km尺度上具有极显著的空间自相关性(P=0.001,Z=134.402 5,全局Moran.s I指数=0.606 5);当月(8-10月)登革热本地病例疫情与上月(7-9月)疫情(本地病例与输入性病例)、气象(温度、湿度、降雨量)、社会(人口密度、城乡居民用地、林地、耕地)等多因素间存在不同程度的相关性;基于BP神经网络的登革热疫情预测模型的预测值与真实值相关系数为0.773,均方根误差为7.522 0。结论广佛地区的登革热疫情并非随机分布,具有明显的空间聚集性;登革热的发生受多种因素综合影响,基于BP神经网络模型可以有效地预测广佛地区登革热疫情的时空分布。
|
| [18] |
An online spatiotemporal prediction model for dengue fever epidemic in Kaohsiung (Taiwan) [J].https://doi.org/10.1002/bimj.201200270 URL PMID: 24615833 [本文引用: 1] 摘要
The emergence and re-emergence of disease epidemics is a complex question that may be influenced by diverse factors, including the space-time dynamics of human populations, environmental conditions, and associated uncertainties. This study proposes a stochastic framework to integrate space-time dynamics in the form of a Susceptible-Infected-Recovered (SIR) model, together with uncertain disease observations, into a Bayesian maximum entropy (BME) framework. The resulting model (BME-SIR) can be used to predict space-time disease spread. Specifically, it was applied to obtain a space-time prediction of the dengue fever (DF) epidemic that took place in Kaohsiung City (Taiwan) during 2002. In implementing the model, the SIR parameters were continually updated and information on new cases of infection was incorporated. The results obtained show that the proposed model is rigorous to user-specified initial values of unknown model parameters, that is, transmission and recovery rates. In general, this model provides a good characterization of the spatial diffusion of the DF epidemic, especially in the city districts proximal to the location of the outbreak. Prediction performance may be affected by various factors, such as virus serotypes and human intervention, which can change the space-time dynamics of disease diffusion. The proposed BME-SIR disease prediction model can provide government agencies with a valuable reference for the timely identification, control, and prevention of DF spread in space and time.
|
| [19] |
An information value based analysis of physical and climatic factors affecting dengue fever and dengue haemorrhagic fever incidence [J].https://doi.org/10.1186/1476-072X-4-13 URL PMID: 15943863 [本文引用: 1] 摘要
pAbstract/p pBackground/p pVector-borne diseases are the most dreaded worldwide health problems. Although many campaigns against it have been conducted, Dengue Fever (DF) and Dengue Haemorrhagic Fever (DHF) are still the major health problems of Thailand. The reported number of dengue incidences in 1998 for the Thailand was 129,954, of which Sukhothai province alone reported alarming number of 682. It was the second largest epidemic outbreak of dengue after 1987. Government arranges the remedial facilities as and when dengue is reported. But, the best way to control is to prevent it from happening. This will be possible only when knowledge about the relationship of DF/DHF with climatic and physio-environmental agents is discovered. This paper explores empirical relationship of climatic factors rainfall, temperature and humidity with the DF/DHF incidences using multivariate regression analysis. Also, a GIS based methodology is proposed in this paper to explore the influence of physio-environmental factors on dengue incidences. Remotely sensed data provided important data about physical environment and have been used for many vector borne diseases. Information Values (IV) method was utilised to derive influence of various factors in the quantitative terms. Researchers have not applied this type of analysis for dengue earlier. Sukhothai province was selected for the case study as it had high number of dengue cases in 1998 and also due to its diverse physical setting with variety of land use/land cover types./p pResults/p pPreliminary results demonstrated that physical factors derived from remotely sensed data could indicate variation in physical risk factors affecting DF/DHF. A composite analysis of these three factors with dengue incidences was carried out using multivariate regression analysis. Three empirical models ER-1, ER-2 and ER-3 were evaluated. It was found that these three factors have significant relation with DF/DHF incidences and can be related to the forecast expected number of dengue cases. The results have shown significantly high coefficient of determination if applied only for the rainy season using empirical relation-2 (ER-2). These results have shown further improvement once a concept of time lag of one month was applied using the ER-3 empirical relation. ER-3 model is most suitable for the Sukhothai province in predicting possible dengue incidence with 0.81 coefficient of determination. The spatial statistical relationship of various land use/land cover classes with dengue-affected areas was quantified in the form of information value received from GIS analysis. The highest information value was obtained for the Built-up area. This indicated that Built-up area has the maximum influence on the incidence of dengue. The other classes showing negative values indicate lesser influence on dengue epidemics. Agricultural areas have yielded moderate risk areas based on their medium high information values. Water bodies have shown significant information value for DF/ DHF only in one district. Interestingly, forest had shown no influence on DF/DHF./p pConclusion/p pThis paper explores the potential of remotely sensed data and GIS technology to analyze the spatial factors affecting DF/DHF epidemic. Three empirical models were evaluated. It was found that Empirical Relatrion-3 (ER-3) has yielded very high coefficient of determination to forecast the number of DF/DHF incidence. An analysis of physio-environmental factors such as land use/ land cover types with dengue incidence was carried out. Influence of these factors was obtained in quantitative terms using Information Value method in the GIS environment. It was found that built-up areas have highest influence and constitute the highest risk zones. Forest areas have no influence on DF/DHF epidemic. Agricultural areas have moderate risk in DF/DHF incidences. Finally the dengue risk map of the Sukhothai province was developed using Information Value method. Dengue risk map can be used by the Public Health Department as a base map for applying preventive measures to control the dengue outbreak. Public Health Department can initiate their effort once the ER-3 predicts a possibility of significant high dengue incidence. This will help in focussing the preventive measures being applied on priority in very high and high-risk zones and help in saving time and money./p
|
| [20] |
A study of the dengue epidemic and meteorological factors in Guangzhou, China, by using a zero-inflated poisson regression model [J].https://doi.org/10.1177/1010539513490195 URL PMID: 23761588 [本文引用: 1] 摘要
The aim of this study is to develop a model that correctly identifies and quantifies the relationship between dengue and meteorological factors in Guangzhou, China. By cross-correlation analysis, meteorological variables and their lag effects were determined. According to the epidemic characteristics of dengue in Guangzhou, those statistically significant variables were modeled by a zero-inflated Poisson regression model. The number of dengue cases and minimum temperature at 1-month lag, along with average relative humidity at 0- to 1-month lag were all positively correlated with the prevalence of dengue fever, whereas wind velocity and temperature in the same month along with rainfall at 2 months' lag showed negative association with dengue incidence. Minimum temperature at 1-month lag and wind velocity in the same month had a greater impact on the dengue epidemic than other variables in Guangzhou.
|
| [21] |
Ambient air pollution and autism in Los Angeles county, California [J].https://doi.org/10.1289/ehp.1205827 URL PMID: 23249813 [本文引用: 1] 摘要
Background: The prevalence of autistic disorder (AD), a serious developmental condition, has risen dramatically over the past two decades, but high-quality population-based research addressing etiology is limited. Objectives: We studied the influence of exposures to traffic-related air pollution during pregnancy on the development of autism using data from air monitoring stations and a land use regression (LUR) model to estimate exposures. Methods: Children of mothers who gave birth in Los Angeles, California, who were diagnosed with a primary AD diagnosis at 3–5 years of age during 1998–2009 were identified through the California Department of Developmental Services and linked to 1995–2006 California birth certificates. For 7,603 children with autism and 10 controls per case matched by sex, birth year, and minimum gestational age, birth addresses were mapped and linked to the nearest air monitoring station and a LUR model. We used conditional logistic regression, adjusting for maternal and perinatal characteristics including indicators of SES. Results: Per interquartile range (IQR) increase, we estimated a 12–15% relative increase in odds of autism for ozone [odds ratio (OR) = 1.12, 95% CI: 1.06, 1.19; per 11.54-ppb increase] and particulate matter ≤ 2.5 08m (OR = 1.15; 95% CI: 1.06, 1.24; per 4.68-μg/m3increase) when mutually adjusting for both pollutants. Furthermore, we estimated 3–9% relative increases in odds per IQR increase for LUR-based nitric oxide and nitrogen dioxide exposure estimates. LUR-based associations were strongest for children of mothers with less than a high school education. Conclusion: Measured and estimated exposures from ambient pollutant monitors and LUR model suggest associations between autism and prenatal air pollution exposure, mostly related to traffic sources.
|
| [22] |
Analysis of trends of annual and seasonal precipitation from 1956 to 2000 in Guangdong province, China [J].https://doi.org/10.1080/02626667.2011.636748 URL [本文引用: 1] 摘要
The trends of annual, seasonal and monthly precipitation in southern China (Guangdong Province) for the period 1956 2000 are investigated, based on the data from 186 high-quality gauging stations. Statistical tests, including Mann-Kendall rank test and wavelet analysis, are employed to determine whether the precipitation series exhibit any regular trend and periodicity. The results indicate that the annual precipitation has a slightly decreasing trend in central Guangdong and slight increasing trends in the eastern and western areas of the province. However, all the annual trends are not statistically significant at the 95% confidence level. The average precipitation increases in the dry season in central Guangdong, but decreases in the wet season, meaning that the precipitation becomes more evenly distributed within the year. Furthermore, the analysis of monthly precipitation suggests that the distribution of intra-annual precipitation changes over time. The results of wavelet analysis show prominent precipitation with periods ranging from 10 to 12 years in every sub-region in Guangdong Province. Comparing with the sunspot cycle (11-year), the annual precipitation in every sub-region in Guangdong province correlates with Sunspot Number with a 3-year lag. The findings in this paper will be useful for water resources management.
|
| [23] |
Studies on the temporal and spatial variations of urban expansion in Chengdu, western China, from 1978 to 2010 [J].https://doi.org/10.1016/j.scs.2015.03.004 URL [本文引用: 1] 摘要
Analysis of the urban expansion and its driving forces is critically important for sustainable urban development. The majority of studies on Chinese urbanization have been focused on coastal areas, while with less attention given to urban centers in the west. Chengdu, western China, however is undergoing significant urban growth due to rapid economic development and demographic growth. This research examines urban expansion in Chengdu based on remotely sensed data, urban expansion model, buffer analysis of geographic information system (GIS) and quadrant orientation analysis. Driving forces of urban expansion are also examined based on principle component analysis (PCA). Results indicate that the urbanized area increased by more than 17 times, up to 1910.2km2 from 1978 to 2010, the urban expansion rate and intensity increased significantly and exhibited the spatiotemporal heterogeneity. We found that urban expansion patterns changed from patch infilling to patch margin expansion, and the expansion direction is primarily toward the northwest, west and southwest. The results suggest an obvious trend of urban expansion in Chengdu witnessed in coastal cities of China. The information provided by this research ultimately helped impact on future policies and plans for better land management and urban sustainability.
|
| [24] |
基于SLEUTH模型的沈阳-抚顺都市区城市规划 [J].
This paper studied the urban planning in Shenyang-Fushun metropolitan area under 3 scenarios using SLEUTH model. The results showed that the low ecological protection scenario resulted in rapid urban sprawl and area decrease of farmland, forest, and other landscape types. The stringent ecological protection scenario well kept compact urban growth pattern and led to low occupation on other landscape types, but urban growth rate was limited in conflict with the regional economic development. The moderate ecological protection scenario is recommended for future development of this area if the diffused urban growth pattern is further controlled.
Urban planning based on SLEUTH model in Shenyang-Fushun metropolitan area [J].
This paper studied the urban planning in Shenyang-Fushun metropolitan area under 3 scenarios using SLEUTH model. The results showed that the low ecological protection scenario resulted in rapid urban sprawl and area decrease of farmland, forest, and other landscape types. The stringent ecological protection scenario well kept compact urban growth pattern and led to low occupation on other landscape types, but urban growth rate was limited in conflict with the regional economic development. The moderate ecological protection scenario is recommended for future development of this area if the diffused urban growth pattern is further controlled.
|
| [25] |
Using open street map data in environmental exposure assessment studies: eastern massachusetts, bern region, and south israel as a case study [J].https://doi.org/10.3390/ijerph15112443 URL [本文引用: 1] 摘要
Abstract: There is an increase in the awareness of the importance of spatial data in epidemiology and exposure assessment (EA) studies. Most studies use governmental and ordnance surveys, which are often expensive and sparsely updated, while in most developing countries, there are often no official geo-spatial data sources. OpenStreetMap (OSM) is an open source Volunteered Geographic Information (VGI) mapping project. Yet very few environmental epidemiological and EA studies have used OSM as a source for road data. Since VGI data is either noncommercial or governmental, the validity of OSM is often questioned. We investigate the robustness and validity of OSM data for use in epidemiological and EA studies. We compared OSM and Governmental Major Road Data (GRD) in three different regions: Massachusetts, USA; Bern, Switzerland; and Beer-Sheva, South Israel. The comparison was done by calculating data completeness, positional accuracy, and EA using traditional exposure methods. We found that OSM data is fairly complete and accurate in all regions. The results in all regions were robust, with Massachusetts showing the best fits (R2 0.93). Results in Bern (R2 0.78) and Beer-Sheva (R2 0.77) were only slightly lower. We conclude by suggesting that OSM data can be used reliably in environmental assessment studies.
|
| [26] |
|
| [27] |
Openstreetmap [DB/OL]. |
| [28] |
Geospatial data cloud [DB/OL]. |
| [29] |
社会经济数据空间化现状与发展趋势 [J].
行政单元的社会经济统计数据与地理单元的要素数据之间存在空间不匹配的问题,很难满足自然与人文交叉学科研究的需要。本文首先对社会经济数据空间化指标和方法进行了总结,发现空间化研究主要集中在人口与国内生产总值指标,对资本存量、房屋等其他社会经济指标的空间化研究相对较少;根据空间化的思路和方法差异,可将空间化方法归纳为面积权重法、统计模型法和多源数据融合法三类。最后通过对比分析不同空间化方法的原理和优缺点可知:社会经济研究指标多样化、空间化精度要求的多元化和大数据应用的广泛化是社会经济数据空间化的发展趋势。同时,大数据等新的辅助数据源的出现为空间化精度的提高带来了契机,在社会管理精细化要求不断提高的背景下,社会经济数据空间化也越来越成为研究热点。
The status and development trend of disaggregation of socio-economic data [J].
行政单元的社会经济统计数据与地理单元的要素数据之间存在空间不匹配的问题,很难满足自然与人文交叉学科研究的需要。本文首先对社会经济数据空间化指标和方法进行了总结,发现空间化研究主要集中在人口与国内生产总值指标,对资本存量、房屋等其他社会经济指标的空间化研究相对较少;根据空间化的思路和方法差异,可将空间化方法归纳为面积权重法、统计模型法和多源数据融合法三类。最后通过对比分析不同空间化方法的原理和优缺点可知:社会经济研究指标多样化、空间化精度要求的多元化和大数据应用的广泛化是社会经济数据空间化的发展趋势。同时,大数据等新的辅助数据源的出现为空间化精度的提高带来了契机,在社会管理精细化要求不断提高的背景下,社会经济数据空间化也越来越成为研究热点。
|
| [30] |
基于SLEUTH模型的上海城市增长预测 [J].
基于SLEUTH模型,利用1989—2005年高分辨率土地利用数据,模拟4种土地资源保护情景下,2006—2035年上海的城市增长,以及城市化对城市景观格局的影响。结果表明:在各种情景下,城市土地利用类型的面积均呈增长趋势,增量随着保护等级的提高而逐渐减少;城市增长方式主要是边缘增长,扩散增长和道路影响增长出现在郊区,增长主要发生在西北方向,西南和东南方向次之;城市化显著影响城市景观格局,并存在阶段性;早期阶段城市化导致景观破碎化,斑块密度增加,景观多样性和异质性提高;后期阶段,城市化将导致景观多样性和异质性降低,城市景观趋于均质化,加大农田和绿地景观的保护等级将减缓城市化降低景观多样性和增加均质化的趋势。
SLEUTH model-based prediction of urban growth of Shanghai [J].
基于SLEUTH模型,利用1989—2005年高分辨率土地利用数据,模拟4种土地资源保护情景下,2006—2035年上海的城市增长,以及城市化对城市景观格局的影响。结果表明:在各种情景下,城市土地利用类型的面积均呈增长趋势,增量随着保护等级的提高而逐渐减少;城市增长方式主要是边缘增长,扩散增长和道路影响增长出现在郊区,增长主要发生在西北方向,西南和东南方向次之;城市化显著影响城市景观格局,并存在阶段性;早期阶段城市化导致景观破碎化,斑块密度增加,景观多样性和异质性提高;后期阶段,城市化将导致景观多样性和异质性降低,城市景观趋于均质化,加大农田和绿地景观的保护等级将减缓城市化降低景观多样性和增加均质化的趋势。
|
| [31] |
Simulating urban growth in Mashad city, Iran through the SLEUTH model (UGM) [J].https://doi.org/10.1016/j.cities.2008.11.005 URL [本文引用: 1] 摘要
Mashad is the capital city of Khorasan Razavi Province, in the North East of Iran. The city has witnessed rapid growth in the last two decades, mostly because of its economic, social and religious attractions. We implemented this study to understand Mashad City growth dynamics, to forecast its sprawl for the next two decades and to provide a basis for urban management. We used the SLEUTH urban growth simulation and forecasting model. We calibrated it with historical data derived from a time series of satellite images. Three scenarios were designed to simulate the spatial pattern of urban growth under different conditions. The first scenario was historical urban growth, which allowed continual urban area expansion, similar to historical trends, without any limitation. The second scenario was environmentally-oriented in which urban growth was limited. The third scenario was a specific compound urban sprawl situation in which growth was allowed to continue, similar to the historical trend, but a limitation was applied to construction on steeper slopes. The results showed the utility of the modeling method in explaining the spatial pattern of urban growth. The result of the second scenario illustrated that valuable land in suburban areas, including flourishing farms, could be saved. Urban growth under the third scenario showed the harnessing effect of slope-limited growth. We conclude that the results of the modeling under the three scenarios for Mashad City growth are of great potential use to city managers. We also showed that the environmental scenario is preferable for Mashad City development. [Copyright 2009 Elsevier] Copyright of Cities is the property of Elsevier Science Publishing Company, Inc. and its content may not be copied or emailed to multiple sites or posted to a listserv without the copyright holder's express written permission. However, users may print, download, or email articles for individual use. This abstract may be abridged. No warranty is given about the accuracy of the copy. Users should refer to the original published version of the material for the full abstract.
|
| [32] |
京津冀都市圈城镇扩展时空过程及其未来情景预测 [J].
近年来,京津冀都市圈城市化发展迅速,快速城市化过程导致了人地矛盾日益尖锐、环境污染、交通拥挤、居住环境恶化等一系列城市问题。本文利用GIS空间分析方法,分析了1990-2008年京津冀都市圈城镇扩展的时空过程,并在此基础上,运用SLEUTH模型,模拟了不同发展场景下京津冀都市圈城镇扩展的未来情景。研究发现:1990-2008年京津冀都市圈城镇扩展明显,城镇面积净增加4022.37km2,年平均扩展速率为1.91%,1990年以后城镇扩展速率呈逐步减缓的趋势。城镇扩展在空间格局上呈现显著的"双核、一带和两轴、多中心"的特征。城镇扩展对耕地资源的占用特别明显,18年间,耕地面积净减少3507.62km2,年减少速率为0.23%。2008-2020年京津冀都市圈城镇扩展速率较历史时期将有一定减缓,2020年以后城镇扩展速率将进一步下降。京津冀都市圈未来城镇扩展仍然将侵占一定的耕地资源,2020年以后耕地萎缩的态势将减缓。
Spatial temporal process and future scenario prediction of urban expansion in Beijing-Tianjin-Hebei metropolitan area [J].
近年来,京津冀都市圈城市化发展迅速,快速城市化过程导致了人地矛盾日益尖锐、环境污染、交通拥挤、居住环境恶化等一系列城市问题。本文利用GIS空间分析方法,分析了1990-2008年京津冀都市圈城镇扩展的时空过程,并在此基础上,运用SLEUTH模型,模拟了不同发展场景下京津冀都市圈城镇扩展的未来情景。研究发现:1990-2008年京津冀都市圈城镇扩展明显,城镇面积净增加4022.37km2,年平均扩展速率为1.91%,1990年以后城镇扩展速率呈逐步减缓的趋势。城镇扩展在空间格局上呈现显著的"双核、一带和两轴、多中心"的特征。城镇扩展对耕地资源的占用特别明显,18年间,耕地面积净减少3507.62km2,年减少速率为0.23%。2008-2020年京津冀都市圈城镇扩展速率较历史时期将有一定减缓,2020年以后城镇扩展速率将进一步下降。京津冀都市圈未来城镇扩展仍然将侵占一定的耕地资源,2020年以后耕地萎缩的态势将减缓。
|
| [33] |
Land use regression models to assess air pollution exposure in Mexico city using finer spatial and temporal input parameters [J].https://doi.org/10.1097/JOM.0000000000001386 URL [本文引用: 1] 摘要
Intra-urban assessment of air pollution exposure has become a priority study while international attention was attracted to PM2.5 pollution in China in recent years. Land Use Regression (LUR), which has previously been proved to be a feasible way to describe the relationship between land use and air pollution level in European and American cities, was employed in this paper to explain the... [Show full abstract]
|
| [34] |
白纹伊蚊飞翔能力和扩散距离观察 [J].https://doi.org/10.3969/j.issn.1003-4692.1998.03.004 URL [本文引用: 1] 摘要
目的:观察和测定白纹伊蚊的飞翔能力和扩散距离。方法:在自然条件下,设立观察点,定期监测白纹伊蚊及当地气象因素和环境因素。结果:该蚊的飞翔能力较弱,一般为50~100m,最大飞翔距离约为400m,成蚊的飞迁扩散活动与其产卵习性及幼虫密度显著相关,气象因素及环境因素对该蚊的飞迁活动有显著的影响。结论:这对研究和控制白纹伊蚊传播登革热,具有重要的理论意义
Investigation on the hover ability and spread range of Aedes albopictus [J].https://doi.org/10.3969/j.issn.1003-4692.1998.03.004 URL [本文引用: 1] 摘要
目的:观察和测定白纹伊蚊的飞翔能力和扩散距离。方法:在自然条件下,设立观察点,定期监测白纹伊蚊及当地气象因素和环境因素。结果:该蚊的飞翔能力较弱,一般为50~100m,最大飞翔距离约为400m,成蚊的飞迁扩散活动与其产卵习性及幼虫密度显著相关,气象因素及环境因素对该蚊的飞迁活动有显著的影响。结论:这对研究和控制白纹伊蚊传播登革热,具有重要的理论意义
|
| [35] |
Practical Bayesian model evaluation using leave-one-out cross-validation and WAIC [J].https://doi.org/10.1007/s11222-016-9696-4 URL [本文引用: 1] 摘要
Abstract: Leave-one-out cross-validation (LOO) and the widely applicable information criterion (WAIC) are methods for estimating pointwise out-of-sample prediction accuracy from a fitted Bayesian model using the log-likelihood evaluated at the posterior simulations of the parameter values. LOO and WAIC have various advantages over simpler estimates of predictive error such as AIC and DIC but are less used in practice because they involve additional computational steps. Here we lay out fast and stable computations for LOO and WAIC that can be performed using existing simulation draws. We introduce an efficient computation of LOO using Pareto-smoothed importance sampling (PSIS), a new procedure for regularizing importance weights. Although WAIC is asymptotically equal to LOO, we demonstrate that PSIS-LOO is more robust in the finite case with weak priors or influential observations. As a byproduct of our calculations, we also obtain approximate standard errors for estimated predictive errors and for comparing of predictive errors between two models. We implement the computations in an R package called 'loo' and demonstrate using models fit with the Bayesian inference package Stan.
|
| [36] |
基于土地利用回归模型的登革热疫情与社会环境要素的空间关系研究 [J].https://doi.org/10.11853/j.issn.1003.8280.2018.03.002 URL [本文引用: 1] 摘要
目的探究社会经济与自然环境要素对登革热疫情空间分布的影响,为有效防控登革热提供依据。方法以蚊媒监测点周围0.5~6.0 km范围内的土地利用、人口密度和道路密度等社会环境要素作为土地利用回归(LUR)模型的输入变量,分析广州市社会经济因素对登革热疫情空间分布的影响。采用留一交叉检验法对模型进行检验,即用n-1个样本建立回归方程,计算剩余1个样本的预测值,并与该样本的实测病例数进行比较。结果监测点不同范围内的社会环境变量对登革热疫情空间分布的贡献程度存在差异,半径为6、2、1、1和2 km缓冲区内的人口密度、道路密度、耕地、林地和农村居民用地的面积分别对登革热1 km有明显影响(R~2=0.567、0.512、0.275、0.106和0.041),而整体LUR模型调整R~2为0.648(F=55.944,P0.01),预测值与实测值间的拟合精度达0.728 8,总体水平较好。结论社会经济要素在不同研究范围下对登革热疫情空间分布的影响不同,LUR模型可较好地预测登革热病例空间分布,从而为当地卫生部门防控登革热提供方法支持。
Exploring the relationship between dengue fever epidemics and social-environmental factors using land use regression model [J].https://doi.org/10.11853/j.issn.1003.8280.2018.03.002 URL [本文引用: 1] 摘要
目的探究社会经济与自然环境要素对登革热疫情空间分布的影响,为有效防控登革热提供依据。方法以蚊媒监测点周围0.5~6.0 km范围内的土地利用、人口密度和道路密度等社会环境要素作为土地利用回归(LUR)模型的输入变量,分析广州市社会经济因素对登革热疫情空间分布的影响。采用留一交叉检验法对模型进行检验,即用n-1个样本建立回归方程,计算剩余1个样本的预测值,并与该样本的实测病例数进行比较。结果监测点不同范围内的社会环境变量对登革热疫情空间分布的贡献程度存在差异,半径为6、2、1、1和2 km缓冲区内的人口密度、道路密度、耕地、林地和农村居民用地的面积分别对登革热1 km有明显影响(R~2=0.567、0.512、0.275、0.106和0.041),而整体LUR模型调整R~2为0.648(F=55.944,P0.01),预测值与实测值间的拟合精度达0.728 8,总体水平较好。结论社会经济要素在不同研究范围下对登革热疫情空间分布的影响不同,LUR模型可较好地预测登革热病例空间分布,从而为当地卫生部门防控登革热提供方法支持。
|
| [37] |
The spatiotemporal transmission of dengue and its driving mechanism: A case study on the 2014 dengue outbreak in Guangdong, China [J].https://doi.org/10.1016/j.scitotenv.2017.11.314 URL PMID: 29216466 [本文引用: 1] 摘要
Abstract Dengue transmission is a complex spatiotemporal process with hidden interactions between hosts, vectors, and viruses as well as environment. This study aims to identify the transmission patterns and the driving mechanism that contributed to the dengue epidemics occurred in Guangdong Province of China in 2014. Based on the city-specific epidemiological, meteorological, demographic and geographic data, we first performed wavelet analysis and then integrated the key dynamics (i.e., mosquito population dynamics, human movement, virus transmission, and parameter estimation) into a transmission model. Using these methods, we found a clear temporal sequence and correlation of dengue transmission between cities, and such relationship is associated with socioeconomic factors. We further obtained the specific component of dengue incidence data in each city, and presented the underlying infectivity networks for characterizing how dengue transmits from one location to another. The results showed that the communication of in-out infections with Guangzhou and Foshan could be responsible for the large-scale diffusion of dengue epidemics in Guangdong in 2014. Our findings can offer new insights into how to improve the predictability and risk assessment of dengue transmission.
|
| [38] |
广州市蚊虫密度与土地覆盖类型关系研究 [J].https://doi.org/10.11853/j.issn.1003.8280.2016.02.002 URL Magsci [本文引用: 2] 摘要
<p><strong>目的</strong> 探索蚊虫密度与土地覆盖类型之间的关系。<strong>方法</strong> 采用广州市2014年9月1-30日期间的蚊虫调查数据,用遥感和地理信息系统技术提取广州市街道的土地覆盖因子;采用流行病学统计分析蚊虫密度与土地覆盖类型之间的关系;比较街道蚊虫密度空间分布差异。<strong>结果</strong> 布雷图指数(BI)>20的街道水浇地、水体和被水淹没或浸湿植被的覆盖比率取值范围分别为1.4%~35.7%、0.1%~23.1%和0~3.4%,而BI≤5的街道水浇地、水体和被水淹没或浸湿植被的覆盖比率取值范围分别为0~0.7%、0~5.1%和0,总体而言,BI>20的街道水浇地、水体和被水淹没或浸湿植被的覆盖比率要高于BI≤5的街道。与邻近的BI≤5的街道比较,BI>20的街道水浇地、水体、耕地和植被的覆盖比率高,旱地的覆盖比率低。<strong>结论</strong> 蚊虫密度与水浇地、水体和被水淹没或浸湿植被密切相关。</p>
Relationship between mosquito density and land cover types in Guangzhou, China [J].https://doi.org/10.11853/j.issn.1003.8280.2016.02.002 URL Magsci [本文引用: 2] 摘要
<p><strong>目的</strong> 探索蚊虫密度与土地覆盖类型之间的关系。<strong>方法</strong> 采用广州市2014年9月1-30日期间的蚊虫调查数据,用遥感和地理信息系统技术提取广州市街道的土地覆盖因子;采用流行病学统计分析蚊虫密度与土地覆盖类型之间的关系;比较街道蚊虫密度空间分布差异。<strong>结果</strong> 布雷图指数(BI)>20的街道水浇地、水体和被水淹没或浸湿植被的覆盖比率取值范围分别为1.4%~35.7%、0.1%~23.1%和0~3.4%,而BI≤5的街道水浇地、水体和被水淹没或浸湿植被的覆盖比率取值范围分别为0~0.7%、0~5.1%和0,总体而言,BI>20的街道水浇地、水体和被水淹没或浸湿植被的覆盖比率要高于BI≤5的街道。与邻近的BI≤5的街道比较,BI>20的街道水浇地、水体、耕地和植被的覆盖比率高,旱地的覆盖比率低。<strong>结论</strong> 蚊虫密度与水浇地、水体和被水淹没或浸湿植被密切相关。</p>
|

/
| 〈 |
|
〉 |