1 引言
在全球环境变化的背景下,各类气象灾害频发[1 ] ,对植被生长造成极大压力。各类灾害引起的粮食危机、生态恶化等,对国家长期粮食安全和社会稳定造成直接的威胁[2 ] 。环境与植被之间存在显著相关性,长期的环境胁迫会使植物产生抗逆性以适应逆境[3 ] 。探究植被在环境胁迫下的抗逆性规律对规避自然灾害风险、减缓灾害造成的损失有重要的意义。
干旱是世界范围的主要灾害[4 ] ,是影响植物生长最重要的非生物胁迫之一。干旱-植被关系已经成为学术研究的热点问题[5 ] 。近年来,国内外学者为探究干旱-植被关系开展了大量研究。目前涉及干旱与植被变化的研究中,大多都集中于气候因子与植被时空变化的相关性分析[6 ⇓ -8 ] 以及植被对气候变化的响应[9 -10 ] ,干旱胁迫下大尺度植物抗逆性监测方法还鲜有报道。
NDVI可以有效反映地表植被覆盖和植被生长状况,在植被监测上运用十分广泛。然而NDVI存在难以克服低植被覆盖区域土壤背景影响以及对高生物量植被的监测存在探测饱和等问题[11 ] ,使用单一的植被指数难以准确刻画大尺度干旱胁迫下的植被变化[12 ] 。除了绿度特征变化[13 ] ,干旱通过改变水分状况、影响水分有效性进而对植被的总初级生产力造成强烈而广泛的影响[14 ] 。此外,大量研究表明,干旱胁迫还会诱导多种作物花青素的生物合成[15 -16 ] 。因此,表征植被水分含量、生产力以及色素含量的遥感指数在干旱胁迫下植被变化监测的潜力还有待挖掘。鉴于此,本文基于不同植被类型各遥感指数距平百分率与干旱程度相关性差异,选取指数刻画植被变化,构建植物抗逆性综合监测方法。以中国2001—2020年干旱为例,在季节尺度上进行干旱胁迫下植物抗逆性监测并分析我国不同类型植被抗逆性差异及其分布规律。
2 研究区概况和数据来源
2.1 研究区概况
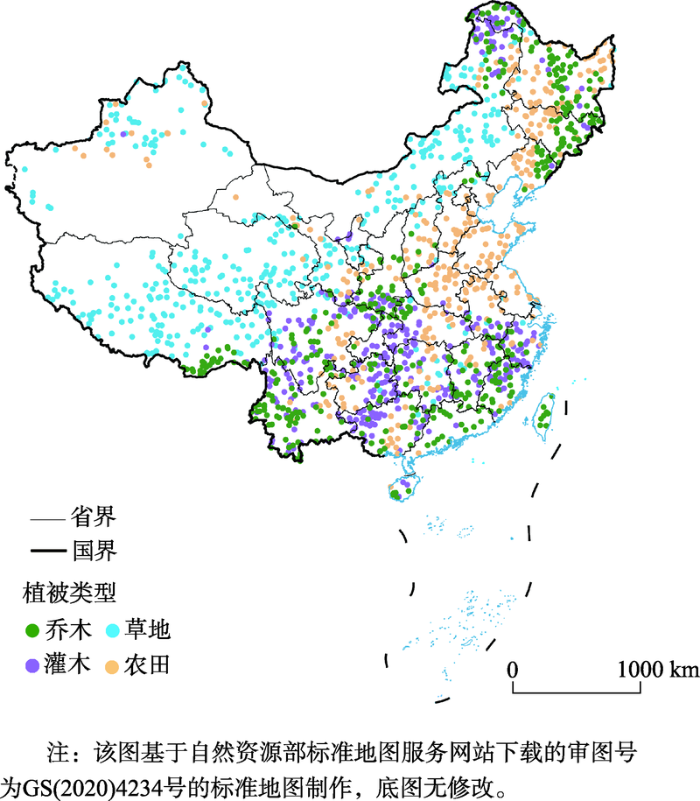
中国(3°31′ N—53°33′ N,73°30′ E—135°02′ E)位于亚洲东部(图1 ),太平洋西岸,幅员辽阔,地势西高东低。降水量从不足20~3000 mm以上,从东南沿海向西北内陆递减。气候类型多样,植被种类丰富,包含阔叶林、针叶林、农田、灌丛、草地等植被类型,分布复杂多样。
图1
图1
植被类型随机点位分布
Fig. 1
Random point distribution map of vegetation types
2.2 数据来源与处理
遥感数据用于构建刻画环境和植被状态的指数数据集。主要包括TerraClimate数据集和中分辨率成像光谱仪(MODerate-resolution Imaging Spectroradiometer,MODIS)数据集。TerraClimate数据集[17 ] 提供的饱和水汽压差数据(Vapor Pressure Deficit,VPD)可以表征空气湿度的变化,时间分辨率为每月,空间分辨率为4 km。2001—2020年8 d最大化合成、500 m空间分辨率的MOD09A1、MOD17A2H数据用于构建遥感指数数据集,每年46期,数据下载地址为:https://ladsweb.nascom.nasa.gov/search/。其中MOD09A1数据集利用QA波段去除云/雪干扰,利用前后两期无云雪影像进行线性插值,利用Whittaker Smoother方法进行数据平滑,完成数据预处理。
2007年全国各省份农作物旱灾受灾面积和绝收面积等灾害统计数据用于方法合理性评估,数据下载地址为:http://data.stats.gov.cn/。2007、2019年MCD12Q1 International Geosphere-Biosphere Programme (IGBP)土地分类数据用于方法合理性评估及不同类型植被抗逆性分析,空间分辨率为500 m,下载地址为:https://ladsweb.modaps.eosdis.nasa.gov/。基于IGBP土地分类数据生成乔木、灌木、草地、农田随机点位450、400、430、360个(图1 ),用于评估各指数监测植被受干旱影响的有效性。
3 植物抗逆性综合监测方法
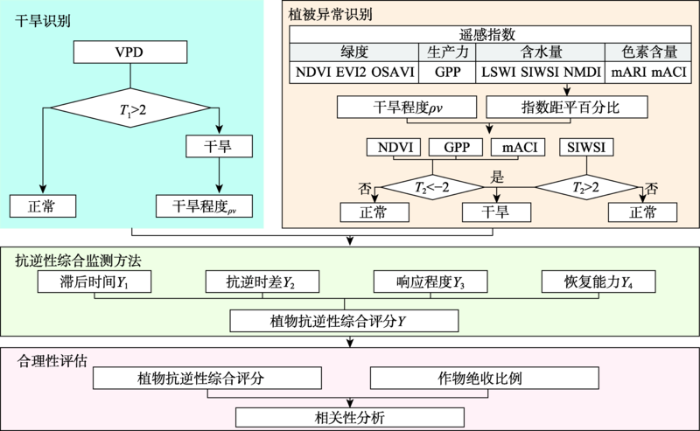
本文构建植物抗逆性综合监测方法的技术路线(图2 ),包括干旱识别、植被异常识别以及植物抗逆性综合监测方法构建、方法合理性评估4个部分。
图2
图2
植物抗逆性综合监测方法技术路线
Fig. 2
Technology roadmap of comprehensive monitoring method of plant stress resistance
3.1 干旱识别
表征环境和植被状态的指标多年年内逐期数据遵循正态分布。基于VPD历年同期均值以及标准差,以与距平值大于两倍标准差为判断依据判定环境干旱,计算公式为:
(1) ${{T}_{1}}=\frac{VP{{D}_{i}}-VPD_{i}^{\text{mean}}}{\text{std}\left( VPD_{i}^{\text{start}}-VPD_{i}^{\text{end}} \right)}$
式中:VPDi 为第i 期VPD,V P D i m e a n i 期VPD历年同期均值,std(V P D i s t a r t - V P D i e n d ) 为第i 期2001—2020年VPD标准差。当T 1 >2,判定为环境干旱。
由于植被对水分的需求在年内不同季节有明显差异,其生理活动在不同季节对气候变化同样具有不同的响应[18 ] ,因此以季节尺度监测我国植物抗逆性。以各季节中VPD相对同期历年均值差异最大的时期计算干旱程度,计算公式为:
(2) ${{\rho }_{v}}=\text{Max}\left( \frac{VP{{D}_{i}}}{VPD_{i}^{\text{mean}}} \right)$
式中:ρv 为干旱程度;VPDi 为干旱时期VPD;V P D i m e a n
3.2 植被异常识别
为了选取能够有效监测干旱胁迫下植被异常状态的遥感指数,在我国干旱发生区域,选取乔木、灌木、草地、农田随机点位450、400、430、360个(图1 )。针对常用的表征植被长势、生产力、水分状况以及花青素含量的遥感指数(表1 ),计算各指数距平百分率,与干旱程度进行拟合,并检验其显著性水平。基于指数历年同期均值以及标准差,以与距平值大于2倍标准差为判断依据判定植被异常,计算公式为:
(3) ${{T}_{2}}=\frac{Inde{{x}_{i}}-Index_{i}^{\text{mean}}}{\text{std}\left( Index_{i}^{\text{start}}-Index_{i}^{\text{end}} \right)}$
式中:Indexi 为指数第i 期像元值;I n d e x i m e a n i 期像元值历年同期均值;std(I n d e x i s t a r t - I n d e x i e n d ) 为第i 期2001—2020年各指数标准差。对于 SIWSI,当T 2 >2时,判定为植被异常;对于NDVI、GPP、mACI,当T 2 <-2时,判定为植被异常。
3.3 抗逆性综合监测方法
根据各指数距平百分率与干旱程度的拟合结果(表2 ),选取NDVI、GPP、mACI、SIWSI监测植被异常。基于VPD、NDVI、GPP、mACI与SIWSI 5个遥感指数时序数据集,建立滞后时间、抗逆时差、响应程度与恢复能力4个植物抗逆性监测指标,构建植物抗逆性综合监测方法,计算公式为:
(12) Y = a Y 1 + b Y 2 + c Y 3 + d Y 4 × ρ v × 100
式中:Y 为植物抗逆性综合评分;Y 1 为滞后时间;Y 2 为抗逆时差;Y 3 为响应程度;Y 4 为恢复能力;ρv 为干旱程度;a 、b 、c 和d 为各项监测指标的权重,以随机点位(图1 )为样本,利用熵值法确定各权重分别为0.15、0.15、0.4和0.3。Y 越大,表明植物抗逆性越强。为了减少干旱程度对抗逆性综合评估结果的影响,对响应程度和恢复能力乘以干旱程度ρv 。
滞后时间指植被响应干旱的滞后时间,不同类型植被在干旱胁迫下生理结构发生变化的速度不同。以NDVI、GPP、mACI与SIWSI中最先出现异常的时间为植物开始抗逆的时间,计算植物开始抗逆与干旱开始的时间差为滞后时间。计算公式为:
(13) ${{Y}_{1}}=\left[ Min\left( {{T}_{\text{SNDVI}}},{{T}_{\text{SGPP}}},{{T}_{\text{SmACI}}},{{T}_{\text{SSIWSI}}} \right)-{{T}_{\text{SVPD}}} \right]/3$
式中:Y 1 为滞后时间,T SNDVI 、T SGPP 、T SACI 、T SSIWSI 分别代表NDVI、GPP、mACI与SIWSI开始异常的时刻,单位为月,T SVPD 代表VPD开始异常的时刻。当滞后时间大于3个月,即Y 1 大于1时,认为植物的抗逆性最强。
抗逆时差指干旱持续时间与植物抗逆持续时间的差,植物自身对干旱的适应能力以及自我修复能力的差异导致不同类型植被在同一干旱条件下抗逆持续时间不同。计算公式为:
(14) ${{T}_{\text{DVPD}}}={{T}_{\text{SVPD}}}-{{T}_{\text{EVPD}}}$
(15) ${{T}_{\text{D} ind \ \ { ex}}}=\text{Max}\left( {{T}_{\text{DNDVI}}},{{T}_{\text{DGPP}}},{{T}_{\text{DmACI}}},{{T}_{\text{DSIWSI}}} \right)$
(16) ${{Y}_{2}}=\left\{ \begin{matrix} \begin{matrix}\left( {{T}_{\text{DVPD}}}-{{T}_{\text{D} ind \ \ {ex}}} \right)/1 & {} & {{T}_{\text{DVPD}}}>{{T}_{\text{D } ind \ \ {ex}}} \\ \end{matrix} \\ \begin{matrix} 0 & {} & {{T}_{\text{DVPD}}}\le {{T}_{\text{D} ind\ \ {ex}}} \\ \end{matrix} \\ \end{matrix} \right.$
式中:T DVPD 与T Dindex 分别为干旱和植被异常持续时间;T SVPD 与T EVPD 分别为干旱开始与结束的时刻,即VPD异常的开始与结束时刻;T DNDVI 、T DGPP 、T DACI 与T DSIWSI 分别为NDVI、GPP、mACI与SIWSI异常持续的时间;Y 2 为抗逆时差,单位为月,当Y 2 大于等于1时,认为植物抗逆性最强。
响应程度是指干旱胁迫下植被各指数数值和处于正常环境下指数数值的比值,这一指标最能直观反映干旱对植被的影响。计算公式为:
(17) ${{Y}_{3}}=\left[ \begin{array}{*{35}{l}} {{a}_{1}}\text{Min}\left( \frac{NDV{{I}_{i}}}{NDVI_{i}^{\text{mean}}} \right)+{{b}_{1}}\text{Min}\left( \frac{mAC{{I}_{i}}}{mACI_{i}^{\text{mean}}} \right)+ \\ {{c}_{1}}\text{Min}\left( 1-\frac{SIWS{{I}_{i}}-SIWSI_{i}^{\text{mean}}}{\left| SIWSI_{i}^{\text{mean}} \right|} \right)+{{d}_{1}}\frac{\sum GP{{P}_{\text{dry}}}}{\sum GP{{P}_{\text{mean}}}} \\ \end{array} \right]$
式中:Y 3 为响应程度;NDVIi 、mACIi 、SIWSIi 为干旱胁迫下第i 期植被指数像元值;N D V I i m e a n m A C I i m e a n S I W S I i m e a n i 期指数历年同期均值;∑GPP dry 为干旱发生年份总初级生产力;∑GPP mean 为2001—2020年历年总初级生产力的均值。a 1 、b 1 、c 1 、d 1 为各个指数的权重系数,以随机点位(图1 )为样本,利用熵值法确定各权重分别为0.3、0.2、0.2、0.3。
植被生态系统的恢复能力指系统发生变化后恢复到原来状态的能力。初级生产力作为生态系统最重要的生物状态变量,其动态受环境驱动变量变化的影响。恢复能力较强的植被,当生态系统驱动变量恢复到正常水平,其生物状态变量也能近似恢复到正常水平[27 ] 。以干旱后第二年植被有机物累积量作为监测植被恢复情况的依据,相比监测植被恢复到原始状态所需的时间,这一方法不需要长时间的跟踪且工作量较小。计算公式为:
(18) ${{Y}_{4}}=\frac{\sum GP{{P}_{\text{next}}}}{\sum GP{{P}_{\text{mean}}}}$
式中:Y 4 为恢复能力;∑GPP next 为干旱后第二年总初级生产力累加和;∑GPP mean 为2001—2020年历年总初级生产力均值。
3.4 方法合理性评估
在持续干旱情况下,植被有机物合成减少、自身有机物持续消耗,植被有机物总量降低,严重时甚至会导致植被死亡。这种影响在作物产量上的体现最为直观,持续干旱会造成作物减产或绝收。因此本文以基于抗逆性综合监测方法得到的作物抗逆性综合评分与绝收比例即绝收面积和受灾面积的比值作相关性分析,并对比NDVI响应程度与绝收比例的相关性以检验方法的合理性。
4 结果与分析
4.1 植被指数距平百分比与干旱程度的相关性
从各指数距平百分率与干旱程度的拟合结果上看,NDVI、GPP、SIWSI、mACI在监测植被受干旱影响的效果上优于同类型指数,其距平百分率与干旱程度在0.05水平上均显著相关,且不同指数在反映不同植被类型受干旱影响的效果上有显著差异(表2 )。NDVI可以有效监测灌木受干旱的影响,在4种指数中效果最优。乔木SIWSI距平百分率与干旱程度的相关性明显优于NDVI,这是由于乔木光合速率高,伴随较大的蒸腾失水。我国草地主要分布在内蒙古高原东部、青藏高原的东部和南部。由于区域低温低蒸发量的特征,土壤持水能力强,在干旱条件下能保持较为稳定的蒸散,因此相比于NDVI,草地GPP距平百分率与干旱程度有更强的相关性。对于农田来说,病虫害、农业管理措施同样会引起作物绿度、水分含量和生产力的明显变化,干旱胁迫下农田mACI距平百分率与干旱程度的相关性明显优于其他指数,可以作为表征植物受干旱胁迫的指标。
4.2 植物抗逆性的季节差异和空间异质性
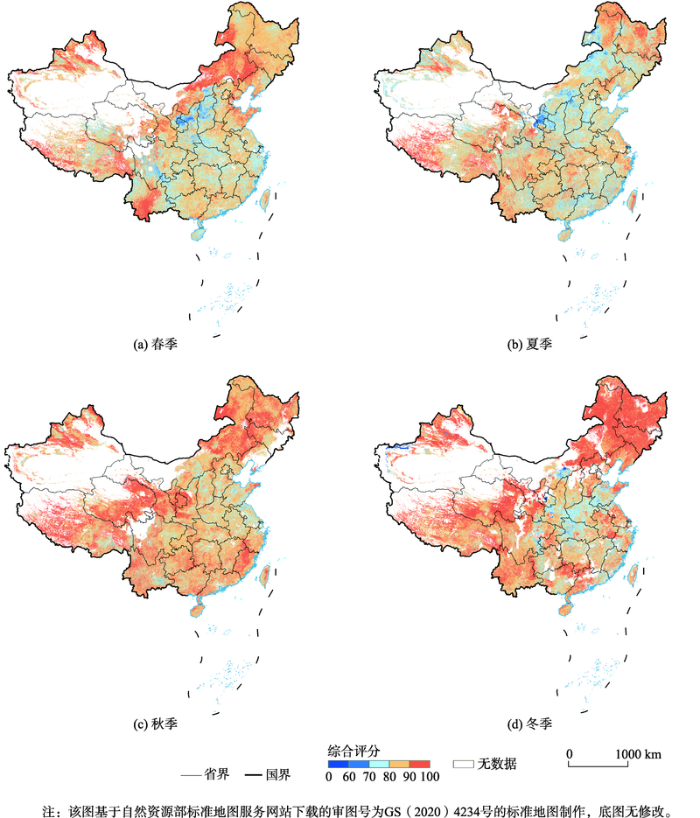
不同季节干旱胁迫下植物抗逆性有明显差异(图3 ),从春、夏、秋、冬四个季节干旱胁迫下我国植物抗逆性综合评分整体分布来看,我国春夏两季植物抗逆性综合评分普遍低于秋冬两季。夏季干旱对植被影响最大,植物抗逆性综合评分最低。春季大部分植被开始生长,需要吸收大量的水分和营养物质,对水分变化比较敏感。夏季是植被生长盛期,植被各项生理指标均处于高峰期,加上夏季气温高,植被吸水和蒸腾速率大大增加,加剧了夏季干旱对植被的影响。秋冬两季气温下降,水分减少,植被的适应特性使其生长缓慢,在冬季甚至停止生长,进入休眠期,对环境变化敏感性降低。因此秋冬两季植物抗逆性整体较强。
图3
图3
不同季节植物抗逆性综合评分空间分布
Fig. 3
Spatial distribution map of comprehensive scoring of plant stress resistance in different seasons
我国植物抗逆性存在显著的空间异质性,主要由植被的空间分布决定。已有研究表明,干旱对雨养农田的影响最大,其次是自然植被,对灌溉农田的影响最小[28 ] 。春季、夏季植物抗逆性综合评分低于70分的区域主要位于山西、陕西北部,冬季抗逆性综合评分低于70分的区域主要位于河南、山东、湖北一带。这些地区年降雨量在400~800 mm,处于亚湿润区向半干旱区的过渡地带,主要植被类型是农田,由于灌溉水源缺乏,依靠天然降水发展雨养农业成为发展农业生产的基本方略,受干旱影响最大;春季评分高于90分的区域主要集中在内蒙古东北部以及云南的南部地区,夏季评分高于90分的区域主要集中在内蒙古北部、西藏西南部以及黑龙江北部地区。这些地区主要以自然植被为主。内蒙古东北部以及西藏西南部地区以及黑龙江北部地区分布有大面积的多年冻土。由于其埋深大、水分补给少的特点,植被生长环境旱化,植被根系发达、耐旱性强。
4.3 不同植被类型抗逆性差异
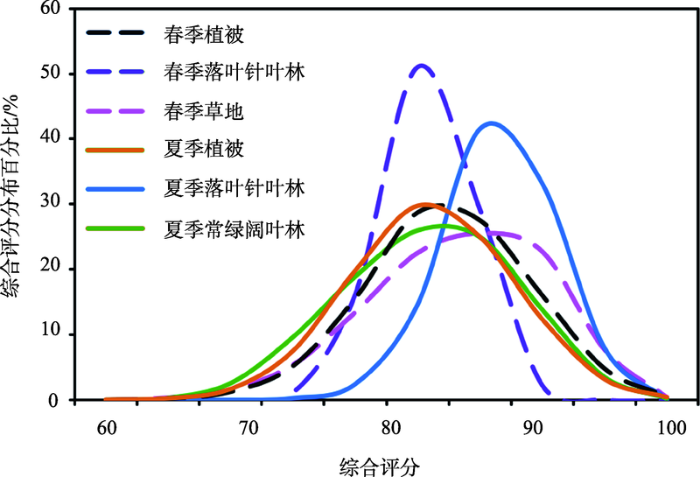
从我国不同植被类型的抗逆性综合评分分布来看(图4 ),落叶针叶林综合评分的分布最为集中,且在夏季其抗逆性明显优于其他植被类型。我国落叶针叶林主要分布在50 °N以上地区,这些地区降雨量常年在400~600 mm之间。落叶针叶林适宜生长在较干旱的环境中,蒸腾作用弱,水分利用效率高。因此相对于别的植被,尤其在夏季干旱胁迫下,落叶针叶林表现出更强的抗逆性。我国常绿阔叶林主要分布在长江以南地区,夏季生长尤为旺盛,蒸腾作用强,对水分缺失更为敏感,导致了夏季干旱胁迫下其抗逆性低于落叶阔叶林。不同植被类型抗逆性存在显著差异,同一植被类型抗逆性同样存在显著的类内异质性。落叶针叶林综合评分分布相比其他类型植被更为集中,我国落叶针叶林集中分布在大兴安岭北部山地,因此抗逆性类内差异很小。春秋两季草地的抗逆性优于落叶针叶林但抗逆性类内差异大,综合评分分布相对分散。我国草种资源种类繁多,各类型草种广泛分布,不同类型草种的生理耐旱性的差异可达十倍[29 ] ,故其具有较大的抗逆性类内差异。
图4
图4
不同植被类型抗逆性综合评分分布
Fig. 4
Distribution map of the comprehensive scores for the resistance of different vegetation types
4.4 抗逆性综合评分与作物绝收比例的相关性分析
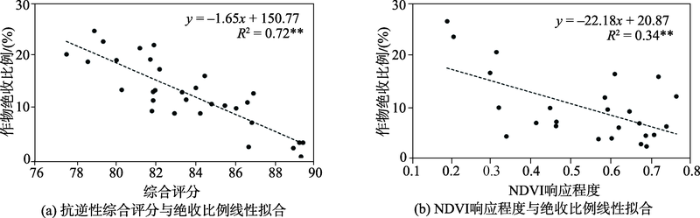
利用各省份作物抗逆性综合评分与绝收比例作相关性分析,并对比NDVI响应程度与绝收比例的拟合结果。发现作物绝收比例与抗逆性综合评分呈显著负相关(图5 (a)),与NDVI响应程度相关性较弱(图5 (b)),说明本文提出的抗逆性综合监测方法具有较高的可信度。
图5
图5
2017年作物抗逆性综合评分、NDVI响应程度与绝收比例的相关性
Fig. 5
Correlation of the comprehensive stress resistance score, NDVI response degree and the percentage of crop failure in 2017
5 结论
本文基于不同类型植被各遥感指数距平百分率与干旱程度相关性差异,选取NDVI、GPP、mACI与SIWSI监测植被变化。综合考虑植物抗逆过程,建立滞后时间、抗逆时差、响应程度与恢复能力4个植物抗逆性监测指标,构建植物抗逆性综合监测方法。利用各省份作物抗逆性综合评分与绝收比例进行相关性分析,两者呈显著负相关。运用该方法对2001—2020年我国不同植被类型在季节性干旱胁迫下的抗逆性进行监测和分析,得到以下结论:
(1)我国不同季节植物抗逆性差异较大,空间异质性显著。由于植被年内生长和气候变化具有明显的季节性规律,对环境变化的敏感性相应地呈现出季节差异,植物抗逆性夏季最强,冬季最弱。从我国植物抗逆性空间分布上看,春季植物抗逆性综合评分低于70分的区域主要位于山西、陕西北部,植物抗逆性较弱;综合评分高于90分的区域主要集中在内蒙古东北部以及云南的南部地区,植物抗逆性较强。
(2)不同类型植被的抗逆性有明显差异。夏季干旱胁迫下落叶针叶林抗逆性最强,且抗逆性类内差异最小;春秋两季干旱胁迫下草地抗逆性最强,但由于草种繁多,分布广泛,抗逆性类内差异最大。
参考文献
View Option
[1]
史培军 , 李宁 , 叶谦 , 等 . 全球环境变化与综合灾害风险防范研究
[J]. 地球科学进展 , 2009 , 24 (4 ):428 -435 .
DOI:10.11867/j.issn.1001-8166.2009.04.0428
[本文引用: 1]
实现可持续发展,需要加深理解全球环境变化对可更新资源保障能力和灾害发生频率、强度和时空格局的影响。近年来发生在世界各国的巨灾造成了严重的灾情,如2008年中国南方的冰冻雨雪灾害,2007年孟加拉国的台风灾害,2005年的美国卡特里娜飓风等。加强对全球环境变化背景下的综合灾害风险防范研究已成为一个迫切需要解决的可持续发展问题。为此,在CNC-IHDP的领导下,CNC-IHDP-RG工作组向IHDP提出了开展全球环境变化与综合风险防范研究的建议。经过2年多的努力,作为IHDP新一轮国际性核心科学计划——综合风险防范(IHDP-IRG)已经得到IHDP-SC的认可,即将于2009年4月在德国波恩IHDP科学大会期间正式宣布启动。该核心计划为从事风险研究、管理和具体实践方面的全球顶级专家和组织搭建交流平台,并引导未来国际综合风险防范研究从综合灾害风险防范的科学、技术与管理问题入手,通过案例对比,从多学科角度,对综合灾害风险防范的理论和方法进行创新性研究,以推动全球综合减灾实践的深入发展。CNC-IHDP-RG作为这一核心科学计划的倡议、发起和主要组织者,通过该计划的成功实施,不但可以在国际上充分展现我国综合灾害风险研究领域的成果,更将有助于大幅度提升中国在全球环境变化研究中的国际地位。
[ Shi P J Li N Ye Q , et al . Research on global environmental change and integrated disaster risk governance
[J]. Advances in Earth Science , 2009 , 24 (4 ):428 -435 . ] DOI:10.3321/j.issn:1001-8166.2009.04.009
[本文引用: 1]
[2]
Sheffield J Wood E F Roderick M L . Little change in global drought over the past 60 years
[J]. Nature , 2012 , 491 (7424 ):435 -438 . DOI:10.1038/nature11575
URL
[本文引用: 1]
[3]
Duca M . Physiology of plant resistance to unfavorable environmental factors [M]. Plant Physiology. Cham : Springer International Publishing , 2015 :271 -308 . DOI:10.1007/978-3-319-17909-4_10
[本文引用: 1]
[4]
Wilhite D A . Drought as a natural hazard: Concepts and definitions
[J]. drought a global assessment , 2000 , 1 :3 -18 . DOI:http://dx.doi.org/
[本文引用: 1]
[5]
安玉艳 , 梁宗锁 . 植物应对干旱胁迫的阶段性策略
[J]. 应用生态学报 , 2012 , 23 (10 ):2907 -2915 .
[本文引用: 1]
[ An Y Y Liang Z S . Staged strategy of plants in response to drought stress
[J]. Chinese Journal of Applied Ecology , 2012 , 23 (10 ):2907 -2915 . ] DOI:10.13287/j.1001-9332.2012.0403
[本文引用: 1]
[6]
Bushra N Rohli R V Lam N S N , et al . The relationship between the normalized difference vegetation index and drought indices in the South Central United States
[J]. Natural Hazards , 2019 , 96 (2 ):791 -808 . DOI:10.1007/s11069-019-03569-5
[本文引用: 1]
Drought indices are useful for quantifying drought severity and have shown mixed success as an indicator of drought damage and biophysical dryness. While spatial downscaling of drought indicators from the climate divisional level to the county level has been conducted successfully in previous work, little research to date has attempted to upscale remotely sensed biophysical indicators to match the downscaled drought indices. This upscaling is important because drought damage and indices are often reported at a coarser scale than the biophysical indicators provide. This research upscales National Oceanic and Atmospheric Administration's Advanced Very High Resolution Radiometer sensor-acquired Normalized Difference Vegetation Index (NDVI) data to produce a county-level biophysical drought index, for a five-state region of the South Central United States. The county-level NDVI is then correlated with the downscaled drought indices for assessing the degree to which the biophysical data match well-documented drought indicators. Results suggest that the Palmer Drought Severity Index and Palmer Hydrologic Drought Index are effective indicators of biophysical drought in much of the arid western part of the study area and in larger swaths of the study area in summer. In nearly all cases except for autumn months, correlations are weakest in the ecotones, with significant negative correlations in the humid eastern part of the study area. Results generally corroborate the findings of recent research that correlations between drought indices and biophysical drought vary spatially. As long-lead climate forecasts continue to improve, these results can assist environmental planners in preparing for the impacts of drought.
[7]
刘世梁 , 田韫钰 , 尹艺洁 , 等 . 云南省植被NDVI时间变化特征及其对干旱的响应
[J]. 生态学报 , 2016 , 36 (15 ):4699 -4707 .
[本文引用: 1]
[ Liu S L Tian Y Y Yin Y J , et al . Temporal dynamics of vegetation NDVI and its response to drought conditions in Yunnan Province
[J]. Acta Ecologica Sinica , 2016 , 36 (15 ):4699 -4707 . ] DOI:10.5846/stxb201501030006
[本文引用: 1]
[8]
曲学斌 , 孙小龙 , 冯建英 , 等 . 呼伦贝尔草原NDVI时空变化及其对气候变化的响应
[J]. 干旱气象 , 2018 , 36 (1 ):97 -103 .
[本文引用: 1]
[ Qu X B Sun X L Feng J Y , et al . Temporal and spatial variation of NDVI in Hulun Buir grassland and its response to climate change
[J]. Journal of Arid Meteorology , 2018, 36 (1 ):97 -103 . ] DOI:10.11755/j.issn.1006-7639(2018)-01-0097
[本文引用: 1]
[9]
杨舒畅 , 杨恒山 . 1982—2013年内蒙古地区干旱变化及植被响应
[J]. 自然灾害学报 , 2019 , 28 (1 ):175 -183 .
[本文引用: 1]
[ Yang S C Yang H S . Drought evolution and vegetation response in Inner Mongolia from 1982 to 2013
[J]. Journal of Natural Disasters , 2019 , 28 (1 ):175 -183 . ] DOI: 10.13577/j.jnd.2019.0121
[本文引用: 1]
[10]
张华 , 徐存刚 , 王浩 . 2001-2018年西北地区植被变化对气象干旱的响应
[J]. 地理科学 , 2020 , 40 (6 ):1029 -1038 .
DOI:10.13249/j.cnki.sgs.2020.06.019
[本文引用: 1]
基于2001?2018年逐月的MODIS NDVI数据,以归一化植被指数(Normalized Difference Vegetation Index, NDVI)和植被状态指数(Vegetation Condition Index, VCI)作为植被生长状况指标,结合2001?2018年的月降水和月均温数据计算的标准化降水蒸散指数值,分析西北地区植被状况和气象干旱指数的变化趋势及其空间分布特征,以及多时间尺度下植被对气象干旱的响应。结果表明:2001?2018年西北地区植被的生长状况整体呈好转趋势,但空间分布上差异明显,东部植被改善状况高于中西部地区。近18 a西北地区5种不同时间尺度标准化降水蒸散指数(Standardized Precipitation Evapotranspiration Index,SPEI)均值整体上均呈增加趋势,表明干旱程度降低;空间上,干旱化趋势整体上表现为中西部高,东部低。植被生长状况在大部分区域均与SPEI呈现不同程度的正相关,总体表现为,西北地区东部植被对气象干旱的响应程度最高,西部次之,中部最低;不同植被类型中,草地对SPEI-12的响应最强,耕地次之,而林地的响应最弱;各植被类型在生长季的多数月份中对SPEI-3和SPEI-12的响应普遍较高。
[ Zhang H Xu C G Wang H . Response of vegetation change to meteorological drought in northwest China from 2001 to 2018
[J]. Scientia Geographica Sinica , 2020 , 40 (6 ):1029 -1038 . ] DOI:10.13249/j.cnki.sgs.2020.06.019
[本文引用: 1]
Northwest China is one of the regions with severe drought in China. Based on the monthly MODIS NDVI data from 2001 to 2018, the normal difference vegetation index NDVI and the vegetation condition index VCI were used as indicators of vegetation growth status, combined with the SPEI values calculated from the monthly precipitation and monthly mean temperature data from 2001 to 2018. Using the univariate linear regression trend analysis method and Pearson correlation coefficient to analyze the variation trend and spatial distribution characteristics of vegetation condition and meteorological drought in Northwest China, as well as the response of vegetation to meteorological drought in multiple time scales. The results showed that the growth of vegetation in Northwest China showed a trend of improvement in the period from 2001 to 2018, but the spatial distribution was significantly different. The improvement of vegetation in the eastern region was higher than that in the central and western regions. The average SPEI of the five different time scales in Northwest China all showed an overall increase trend in the past 18 years, indicating that the degree of drought decreased. In space, the overall trend of aridification was higher in the central and western regions and lower in the east. The vegetation growth status was positively correlated with SPEI in most areas. The overall performance showed that the vegetation in the eastern part of the Northwest China had the highest response to meteorological drought, followed by the western part and the middle part. Among the different vegetation types, the sensitivity of grassland to SPEI-12 was the strongest, followed by arable land, while the response of forest land was slower; the response of each vegetation type to SPEI-3 and SPEI-12 was generally higher in most months of the growing season.
[11]
Huete A Didan K Miura T , et al . Overview of the radiometric and biophysical performance of the MODIS vegetation indices
[J]. Remote Sensing of Environment , 2002 , 83 (1/2 ):195 -213 . DOI:10.1016/S0034-4257(02)00096-2
URL
[本文引用: 1]
[12]
Yang J Tian H Pan S , et al . Amazon drought and forest response: Largely reduced forest photosynthesis but slightly increased canopy greenness during the extreme drought of 2015/2016
[J]. Global Change Biology , 2018 , 24 (5 ):1919 -1934 . DOI:10.1111/gcb.14056
PMID:29345031
[本文引用: 1]
Amazon droughts have impacted regional ecosystem functioning as well as global carbon cycling. The severe dry-season droughts in 2005 and 2010, driven by Atlantic sea surface temperature (SST) anomaly, have been widely investigated in terms of drought severity and impacts on ecosystems. Although the influence of Pacific SST anomaly on wet-season precipitation has been well recognized, it remains uncertain to what extent the droughts driven by Pacific SST anomaly could affect forest greenness and photosynthesis in the Amazon. Here, we examined the monthly and annual dynamics of forest greenness and photosynthetic capacity when Amazon ecosystems experienced an extreme drought in 2015/2016 driven by a strong El Niño event. We found that the drought during August 2015-July 2016 was one of the two most severe meteorological droughts since 1901. Due to the enhanced solar radiation during this drought, overall forest greenness showed a small increase, and 21.6% of forests even greened up (greenness index anomaly ≥1 standard deviation). In contrast, solar-induced chlorophyll fluorescence (SIF), an indicator of vegetation photosynthetic capacity, showed a significant decrease. Responses of forest greenness and photosynthesis decoupled during this drought, indicating that forest photosynthesis could still be suppressed regardless of the variation in canopy greenness. If future El Niño frequency increases as projected by earth system models, droughts would result in persistent reduction in Amazon forest productivity, substantial changes in tree composition, and considerable carbon emissions from Amazon.© 2018 John Wiley & Sons Ltd.
[13]
李华朋 , 张树清 , 高自强 , 等 . MODIS植被指数监测农业干旱的适宜性评价
[J]. 光谱学与光谱分析 , 2013 , 33 (3 ):756 -761 .
[本文引用: 1]
[ Li H P Zhang S Q Gao Z Q , et al . Evaluating the utility of MODIS vegetation index for monitoring agricultural drought
[J]. Spectroscopy and Spectral Analysis , 2013 , 33 (3 ):756 -761 . ] DOI:10.3964/j.issn.1000-0593(2013)03-0756-06
[本文引用: 1]
[14]
杜文丽 , 孙少波 , 吴云涛 , 等 . 1980—2013年中国陆地生态系统总初级生产力对干旱的响应特征
[J]. 生态学杂志 , 2020 , 39 (1 ):23 -35 .
[本文引用: 1]
[ Du W L Sun S B Wu Y T , et al . The responses of gross primary production to drought in terrestrial ecosystems of China during 1980-2013
[J]. Chinese Journal of Ecology , 2020 , 39 (1 ):23 -35 . ] DOI:10.13292/j.1000-4890.202001.011
[本文引用: 1]
[15]
Jaleel C A Manivannan P Wahid A , et al . Drought stress in plants: A review on morphological characteristics and pigments composition
[J]. International Journal of Agriculture and Biology , 2009 , 11 :100 -105 . DOI:10.3763/ijas.2009.0459
[本文引用: 1]
[16]
André C M Schafleitner R Legay S , et al . Gene expression changes related to the production of phenolic compounds in potato tubers grown under drought stress
[J]. Phytochemistry , 2009 , 70 (9 ):1107 -1116 . DOI:10.1016/j.phytochem.2009.07.008
PMID:19664789
[本文引用: 1]
Polyphenols represent a large family of plant secondary metabolites implicated in the prevention of various diseases such as cancers and cardiovascular diseases. The potato is a significant source of polyphenols in the human diet. In this study, we examined the expression of thirteen genes involved in the biosynthesis of polyphenols in potato tubers using real-time RT-PCR. A selection of five field grown native Andean cultivars, presenting contrasting polyphenol profiles, was used. Moreover, we investigated the expression of the genes after a drought exposure. We concluded that the diverse polyphenolic profiles are correlated to variations in gene expression profiles. The drought-induced variations of the gene expression was highly cultivar-specific. In the three anthocyanin-containing cultivars, gene expression was coordinated and reflected at the metabolite level supporting a hypothesis that regulation of gene expression plays an essential role in the potato polyphenol production. We proposed that the altered sucrose flux induced by the drought stress is partly responsible for the changes in gene expression. This study provides information on key polyphenol biosynthetic and regulatory genes, which could be useful in the development of potato varieties with enhanced health and nutritional benefits.
[17]
Abatzoglou J T Dobrowski S Z Parks S A , et al . TerraClimate, a high-resolution global dataset of monthly climate and climatic water balance from 1958-2015
[J]. Scientific Data , 2018 , 5 :170191. DOI:10.1038/sdata.2017.191
[本文引用: 1]
[18]
朴世龙 , 方精云 . 1982—1999年我国陆地植被活动对气候变化响应的季节差异
[J]. 地理学报 , 2003 , 58 (1 ):119 -125 .
[本文引用: 1]
[ Piao S L Fang J Y . Seasonal changes in vegetation activity in response to climate changes in China between 1982 and 1999
[J]. Acta Geographica Sinica , 2003 , 58 (1 ):119 -125 . ] DOI:10.3321/j.issn:0375-5444.2003.01.014
[本文引用: 1]
<p>In the present study, using normalized difference vegetation index (NDVI) as an indicator of vegetation activity, seasonal trends of vegetation activity and their dynamic responses to climate changes in China were explored based on remotely sensed data (NOAA-AVHRR) from 1982 to 1999. As a result, spatially averaged seasonal NDVI in China showed a pronounced increase in all four seasons (spring, summer, autumn and winter) during the past 18 years. The average spring NDVI indicated the most significant increase (P<0.001) with a mean rate of 1.3%, while the average autumn NDVI showed the least increase (P=0.075). Analyzing interannual changes in seasonal mean NDVI by vegetation type, it was found that the advance of growing season was a major way for response of vegetation activity to climate changes and that the way exhibited a large regional heterogeneity. In the past 18 years, regions with the largest increase rate of summer NDVI appeared in Northwest China and the Tibetan Plateau, while areas with that of spring NDVI occurred in the eastern part of the country.</p>
[19]
Rouse J W Haas R H Schell J A , et al . Monitoring the vernal advancement and retrogradation (green wave effect) of natural vegetation
[J]. NASA/GSFC Type III Final Report, Greenbelt, Md , 1974 , 371 .
[本文引用: 1]
[20]
Jiang Z Y Huete A R Didan K , et al . Development of a two-band enhanced vegetation index without a blue band
[J]. Remote Sensing of Environment , 2008 , 112 (10 ):3833 -3845 . DOI:10.1016/j.rse.2008.06.006
URL
[本文引用: 1]
[22]
Xiao X Boles S Frolking S , et al . Landscape-scale characterization of cropland in China using Vegetation and Landsat TM images
[J]. International Journal of Remote Sensing , 2002 , 23 (18 ):3579 -3594 . DOI:10.1080/01431160110106069
URL
[本文引用: 1]
[23]
Fensholt R Sandholt I . Derivation of a shortwave infrared water stress index from MODIS near-and shortwave infrared data in a semiarid environment
[J]. Remote Sensing of Environment , 2003 , 87 (1 ):111 -121 . DOI:10.1016/j.rse.2003.07.002
URL
[本文引用: 1]
[24]
Klemas V Smart R . The influence of soil salinity, growth form, and leaf moisture on-the spectral radiance of spartina alterniflora canopies
[J]. Photogramm Eng Remote Sens , 1983 , 49 (1 ):77 -83 .
[本文引用: 1]
[25]
Gitelson A A Keydan G P Merzlyak M N . Three-band model for noninvasive estimation of chlorophyll, carotenoids, and anthocyanin contents in higher plant leaves
[J]. Geophysical Research Letters , 2006 , 33 (11 ):L11402. DOI:10.1029/2006GL026457
[本文引用: 1]
[26]
Steele M Gitelson A Rundquist D , et al . Nondestructive estimation of anthocyanin content in grapevine leaves
[J]. American Journal of Enology and Viticulture , 2009 , 60 :87 -92 .
DOI:10.5344/ajev.2009.60.1.87
URL
[本文引用: 1]
[27]
Anderegg W R L Berry J A Field C B . Linking definitions, mechanisms, and modeling of drought-induced tree death
[J]. Trends in Plant Science , 2012 , 17 (12 ):693 -700 . DOI:10.1016/j.tplants.2012.09.006
PMID:23099222
[本文引用: 1]
Tree death from drought and heat stress is a critical and uncertain component in forest ecosystem responses to a changing climate. Recent research has illuminated how tree mortality is a complex cascade of changes involving interconnected plant systems over multiple timescales. Explicit consideration of the definitions, dynamics, and temporal and biological scales of tree mortality research can guide experimental and modeling approaches. In this review, we draw on the medical literature concerning human death to propose a water resource-based approach to tree mortality that considers the tree as a complex organism with a distinct growth strategy. This approach provides insight into mortality mechanisms at the tree and landscape scales and presents promising avenues into modeling tree death from drought and temperature stress.Copyright © 2012 Elsevier Ltd. All rights reserved.
[28]
Zhu X F Liu Y Xu K , et al . Effects of drought on vegetation productivity of farmland ecosystems in the drylands of Northern China
[J]. Remote Sensing , 2021 , 13 (6 ):1179 . DOI:10.3390/rs13061179
URL
[本文引用: 1]
[29]
Craine J M Ocheltree T W Nippert J B , et al . Global diversity of drought tolerance and grassland climate-change resilience
[J]. Nature Climate Change , 2013 , 3 (1 ):63 -67 . DOI:10.1038/nclimate1634
URL
[本文引用: 1]
全球环境变化与综合灾害风险防范研究
1
2009
... 在全球环境变化的背景下,各类气象灾害频发[1 ] ,对植被生长造成极大压力.各类灾害引起的粮食危机、生态恶化等,对国家长期粮食安全和社会稳定造成直接的威胁[2 ] .环境与植被之间存在显著相关性,长期的环境胁迫会使植物产生抗逆性以适应逆境[3 ] .探究植被在环境胁迫下的抗逆性规律对规避自然灾害风险、减缓灾害造成的损失有重要的意义. ...
全球环境变化与综合灾害风险防范研究
1
2009
... 在全球环境变化的背景下,各类气象灾害频发[1 ] ,对植被生长造成极大压力.各类灾害引起的粮食危机、生态恶化等,对国家长期粮食安全和社会稳定造成直接的威胁[2 ] .环境与植被之间存在显著相关性,长期的环境胁迫会使植物产生抗逆性以适应逆境[3 ] .探究植被在环境胁迫下的抗逆性规律对规避自然灾害风险、减缓灾害造成的损失有重要的意义. ...
Little change in global drought over the past 60 years
1
2012
... 在全球环境变化的背景下,各类气象灾害频发[1 ] ,对植被生长造成极大压力.各类灾害引起的粮食危机、生态恶化等,对国家长期粮食安全和社会稳定造成直接的威胁[2 ] .环境与植被之间存在显著相关性,长期的环境胁迫会使植物产生抗逆性以适应逆境[3 ] .探究植被在环境胁迫下的抗逆性规律对规避自然灾害风险、减缓灾害造成的损失有重要的意义. ...
1
2015
... 在全球环境变化的背景下,各类气象灾害频发[1 ] ,对植被生长造成极大压力.各类灾害引起的粮食危机、生态恶化等,对国家长期粮食安全和社会稳定造成直接的威胁[2 ] .环境与植被之间存在显著相关性,长期的环境胁迫会使植物产生抗逆性以适应逆境[3 ] .探究植被在环境胁迫下的抗逆性规律对规避自然灾害风险、减缓灾害造成的损失有重要的意义. ...
Drought as a natural hazard: Concepts and definitions
1
2000
... 干旱是世界范围的主要灾害[4 ] ,是影响植物生长最重要的非生物胁迫之一.干旱-植被关系已经成为学术研究的热点问题[5 ] .近年来,国内外学者为探究干旱-植被关系开展了大量研究.目前涉及干旱与植被变化的研究中,大多都集中于气候因子与植被时空变化的相关性分析[6 ⇓ -8 ] 以及植被对气候变化的响应[9 -10 ] ,干旱胁迫下大尺度植物抗逆性监测方法还鲜有报道. ...
植物应对干旱胁迫的阶段性策略
1
2012
... 干旱是世界范围的主要灾害[4 ] ,是影响植物生长最重要的非生物胁迫之一.干旱-植被关系已经成为学术研究的热点问题[5 ] .近年来,国内外学者为探究干旱-植被关系开展了大量研究.目前涉及干旱与植被变化的研究中,大多都集中于气候因子与植被时空变化的相关性分析[6 ⇓ -8 ] 以及植被对气候变化的响应[9 -10 ] ,干旱胁迫下大尺度植物抗逆性监测方法还鲜有报道. ...
植物应对干旱胁迫的阶段性策略
1
2012
... 干旱是世界范围的主要灾害[4 ] ,是影响植物生长最重要的非生物胁迫之一.干旱-植被关系已经成为学术研究的热点问题[5 ] .近年来,国内外学者为探究干旱-植被关系开展了大量研究.目前涉及干旱与植被变化的研究中,大多都集中于气候因子与植被时空变化的相关性分析[6 ⇓ -8 ] 以及植被对气候变化的响应[9 -10 ] ,干旱胁迫下大尺度植物抗逆性监测方法还鲜有报道. ...
The relationship between the normalized difference vegetation index and drought indices in the South Central United States
1
2019
... 干旱是世界范围的主要灾害[4 ] ,是影响植物生长最重要的非生物胁迫之一.干旱-植被关系已经成为学术研究的热点问题[5 ] .近年来,国内外学者为探究干旱-植被关系开展了大量研究.目前涉及干旱与植被变化的研究中,大多都集中于气候因子与植被时空变化的相关性分析[6 ⇓ -8 ] 以及植被对气候变化的响应[9 -10 ] ,干旱胁迫下大尺度植物抗逆性监测方法还鲜有报道. ...
云南省植被NDVI时间变化特征及其对干旱的响应
1
2016
... 干旱是世界范围的主要灾害[4 ] ,是影响植物生长最重要的非生物胁迫之一.干旱-植被关系已经成为学术研究的热点问题[5 ] .近年来,国内外学者为探究干旱-植被关系开展了大量研究.目前涉及干旱与植被变化的研究中,大多都集中于气候因子与植被时空变化的相关性分析[6 ⇓ -8 ] 以及植被对气候变化的响应[9 -10 ] ,干旱胁迫下大尺度植物抗逆性监测方法还鲜有报道. ...
云南省植被NDVI时间变化特征及其对干旱的响应
1
2016
... 干旱是世界范围的主要灾害[4 ] ,是影响植物生长最重要的非生物胁迫之一.干旱-植被关系已经成为学术研究的热点问题[5 ] .近年来,国内外学者为探究干旱-植被关系开展了大量研究.目前涉及干旱与植被变化的研究中,大多都集中于气候因子与植被时空变化的相关性分析[6 ⇓ -8 ] 以及植被对气候变化的响应[9 -10 ] ,干旱胁迫下大尺度植物抗逆性监测方法还鲜有报道. ...
呼伦贝尔草原NDVI时空变化及其对气候变化的响应
1
2018
... 干旱是世界范围的主要灾害[4 ] ,是影响植物生长最重要的非生物胁迫之一.干旱-植被关系已经成为学术研究的热点问题[5 ] .近年来,国内外学者为探究干旱-植被关系开展了大量研究.目前涉及干旱与植被变化的研究中,大多都集中于气候因子与植被时空变化的相关性分析[6 ⇓ -8 ] 以及植被对气候变化的响应[9 -10 ] ,干旱胁迫下大尺度植物抗逆性监测方法还鲜有报道. ...
呼伦贝尔草原NDVI时空变化及其对气候变化的响应
1
2018
... 干旱是世界范围的主要灾害[4 ] ,是影响植物生长最重要的非生物胁迫之一.干旱-植被关系已经成为学术研究的热点问题[5 ] .近年来,国内外学者为探究干旱-植被关系开展了大量研究.目前涉及干旱与植被变化的研究中,大多都集中于气候因子与植被时空变化的相关性分析[6 ⇓ -8 ] 以及植被对气候变化的响应[9 -10 ] ,干旱胁迫下大尺度植物抗逆性监测方法还鲜有报道. ...
1982—2013年内蒙古地区干旱变化及植被响应
1
2019
... 干旱是世界范围的主要灾害[4 ] ,是影响植物生长最重要的非生物胁迫之一.干旱-植被关系已经成为学术研究的热点问题[5 ] .近年来,国内外学者为探究干旱-植被关系开展了大量研究.目前涉及干旱与植被变化的研究中,大多都集中于气候因子与植被时空变化的相关性分析[6 ⇓ -8 ] 以及植被对气候变化的响应[9 -10 ] ,干旱胁迫下大尺度植物抗逆性监测方法还鲜有报道. ...
1982—2013年内蒙古地区干旱变化及植被响应
1
2019
... 干旱是世界范围的主要灾害[4 ] ,是影响植物生长最重要的非生物胁迫之一.干旱-植被关系已经成为学术研究的热点问题[5 ] .近年来,国内外学者为探究干旱-植被关系开展了大量研究.目前涉及干旱与植被变化的研究中,大多都集中于气候因子与植被时空变化的相关性分析[6 ⇓ -8 ] 以及植被对气候变化的响应[9 -10 ] ,干旱胁迫下大尺度植物抗逆性监测方法还鲜有报道. ...
2001-2018年西北地区植被变化对气象干旱的响应
1
2020
... 干旱是世界范围的主要灾害[4 ] ,是影响植物生长最重要的非生物胁迫之一.干旱-植被关系已经成为学术研究的热点问题[5 ] .近年来,国内外学者为探究干旱-植被关系开展了大量研究.目前涉及干旱与植被变化的研究中,大多都集中于气候因子与植被时空变化的相关性分析[6 ⇓ -8 ] 以及植被对气候变化的响应[9 -10 ] ,干旱胁迫下大尺度植物抗逆性监测方法还鲜有报道. ...
2001-2018年西北地区植被变化对气象干旱的响应
1
2020
... 干旱是世界范围的主要灾害[4 ] ,是影响植物生长最重要的非生物胁迫之一.干旱-植被关系已经成为学术研究的热点问题[5 ] .近年来,国内外学者为探究干旱-植被关系开展了大量研究.目前涉及干旱与植被变化的研究中,大多都集中于气候因子与植被时空变化的相关性分析[6 ⇓ -8 ] 以及植被对气候变化的响应[9 -10 ] ,干旱胁迫下大尺度植物抗逆性监测方法还鲜有报道. ...
Overview of the radiometric and biophysical performance of the MODIS vegetation indices
1
2002
... NDVI可以有效反映地表植被覆盖和植被生长状况,在植被监测上运用十分广泛.然而NDVI存在难以克服低植被覆盖区域土壤背景影响以及对高生物量植被的监测存在探测饱和等问题[11 ] ,使用单一的植被指数难以准确刻画大尺度干旱胁迫下的植被变化[12 ] .除了绿度特征变化[13 ] ,干旱通过改变水分状况、影响水分有效性进而对植被的总初级生产力造成强烈而广泛的影响[14 ] .此外,大量研究表明,干旱胁迫还会诱导多种作物花青素的生物合成[15 -16 ] .因此,表征植被水分含量、生产力以及色素含量的遥感指数在干旱胁迫下植被变化监测的潜力还有待挖掘.鉴于此,本文基于不同植被类型各遥感指数距平百分率与干旱程度相关性差异,选取指数刻画植被变化,构建植物抗逆性综合监测方法.以中国2001—2020年干旱为例,在季节尺度上进行干旱胁迫下植物抗逆性监测并分析我国不同类型植被抗逆性差异及其分布规律. ...
Amazon drought and forest response: Largely reduced forest photosynthesis but slightly increased canopy greenness during the extreme drought of 2015/2016
1
2018
... NDVI可以有效反映地表植被覆盖和植被生长状况,在植被监测上运用十分广泛.然而NDVI存在难以克服低植被覆盖区域土壤背景影响以及对高生物量植被的监测存在探测饱和等问题[11 ] ,使用单一的植被指数难以准确刻画大尺度干旱胁迫下的植被变化[12 ] .除了绿度特征变化[13 ] ,干旱通过改变水分状况、影响水分有效性进而对植被的总初级生产力造成强烈而广泛的影响[14 ] .此外,大量研究表明,干旱胁迫还会诱导多种作物花青素的生物合成[15 -16 ] .因此,表征植被水分含量、生产力以及色素含量的遥感指数在干旱胁迫下植被变化监测的潜力还有待挖掘.鉴于此,本文基于不同植被类型各遥感指数距平百分率与干旱程度相关性差异,选取指数刻画植被变化,构建植物抗逆性综合监测方法.以中国2001—2020年干旱为例,在季节尺度上进行干旱胁迫下植物抗逆性监测并分析我国不同类型植被抗逆性差异及其分布规律. ...
MODIS植被指数监测农业干旱的适宜性评价
1
2013
... NDVI可以有效反映地表植被覆盖和植被生长状况,在植被监测上运用十分广泛.然而NDVI存在难以克服低植被覆盖区域土壤背景影响以及对高生物量植被的监测存在探测饱和等问题[11 ] ,使用单一的植被指数难以准确刻画大尺度干旱胁迫下的植被变化[12 ] .除了绿度特征变化[13 ] ,干旱通过改变水分状况、影响水分有效性进而对植被的总初级生产力造成强烈而广泛的影响[14 ] .此外,大量研究表明,干旱胁迫还会诱导多种作物花青素的生物合成[15 -16 ] .因此,表征植被水分含量、生产力以及色素含量的遥感指数在干旱胁迫下植被变化监测的潜力还有待挖掘.鉴于此,本文基于不同植被类型各遥感指数距平百分率与干旱程度相关性差异,选取指数刻画植被变化,构建植物抗逆性综合监测方法.以中国2001—2020年干旱为例,在季节尺度上进行干旱胁迫下植物抗逆性监测并分析我国不同类型植被抗逆性差异及其分布规律. ...
1980—2013年中国陆地生态系统总初级生产力对干旱的响应特征
1
2020
... NDVI可以有效反映地表植被覆盖和植被生长状况,在植被监测上运用十分广泛.然而NDVI存在难以克服低植被覆盖区域土壤背景影响以及对高生物量植被的监测存在探测饱和等问题[11 ] ,使用单一的植被指数难以准确刻画大尺度干旱胁迫下的植被变化[12 ] .除了绿度特征变化[13 ] ,干旱通过改变水分状况、影响水分有效性进而对植被的总初级生产力造成强烈而广泛的影响[14 ] .此外,大量研究表明,干旱胁迫还会诱导多种作物花青素的生物合成[15 -16 ] .因此,表征植被水分含量、生产力以及色素含量的遥感指数在干旱胁迫下植被变化监测的潜力还有待挖掘.鉴于此,本文基于不同植被类型各遥感指数距平百分率与干旱程度相关性差异,选取指数刻画植被变化,构建植物抗逆性综合监测方法.以中国2001—2020年干旱为例,在季节尺度上进行干旱胁迫下植物抗逆性监测并分析我国不同类型植被抗逆性差异及其分布规律. ...
Drought stress in plants: A review on morphological characteristics and pigments composition
1
2009
... NDVI可以有效反映地表植被覆盖和植被生长状况,在植被监测上运用十分广泛.然而NDVI存在难以克服低植被覆盖区域土壤背景影响以及对高生物量植被的监测存在探测饱和等问题[11 ] ,使用单一的植被指数难以准确刻画大尺度干旱胁迫下的植被变化[12 ] .除了绿度特征变化[13 ] ,干旱通过改变水分状况、影响水分有效性进而对植被的总初级生产力造成强烈而广泛的影响[14 ] .此外,大量研究表明,干旱胁迫还会诱导多种作物花青素的生物合成[15 -16 ] .因此,表征植被水分含量、生产力以及色素含量的遥感指数在干旱胁迫下植被变化监测的潜力还有待挖掘.鉴于此,本文基于不同植被类型各遥感指数距平百分率与干旱程度相关性差异,选取指数刻画植被变化,构建植物抗逆性综合监测方法.以中国2001—2020年干旱为例,在季节尺度上进行干旱胁迫下植物抗逆性监测并分析我国不同类型植被抗逆性差异及其分布规律. ...
Gene expression changes related to the production of phenolic compounds in potato tubers grown under drought stress
1
2009
... NDVI可以有效反映地表植被覆盖和植被生长状况,在植被监测上运用十分广泛.然而NDVI存在难以克服低植被覆盖区域土壤背景影响以及对高生物量植被的监测存在探测饱和等问题[11 ] ,使用单一的植被指数难以准确刻画大尺度干旱胁迫下的植被变化[12 ] .除了绿度特征变化[13 ] ,干旱通过改变水分状况、影响水分有效性进而对植被的总初级生产力造成强烈而广泛的影响[14 ] .此外,大量研究表明,干旱胁迫还会诱导多种作物花青素的生物合成[15 -16 ] .因此,表征植被水分含量、生产力以及色素含量的遥感指数在干旱胁迫下植被变化监测的潜力还有待挖掘.鉴于此,本文基于不同植被类型各遥感指数距平百分率与干旱程度相关性差异,选取指数刻画植被变化,构建植物抗逆性综合监测方法.以中国2001—2020年干旱为例,在季节尺度上进行干旱胁迫下植物抗逆性监测并分析我国不同类型植被抗逆性差异及其分布规律. ...
TerraClimate, a high-resolution global dataset of monthly climate and climatic water balance from 1958-2015
1
2018
... 遥感数据用于构建刻画环境和植被状态的指数数据集.主要包括TerraClimate数据集和中分辨率成像光谱仪(MODerate-resolution Imaging Spectroradiometer,MODIS)数据集.TerraClimate数据集[17 ] 提供的饱和水汽压差数据(Vapor Pressure Deficit,VPD)可以表征空气湿度的变化,时间分辨率为每月,空间分辨率为4 km.2001—2020年8 d最大化合成、500 m空间分辨率的MOD09A1、MOD17A2H数据用于构建遥感指数数据集,每年46期,数据下载地址为:https://ladsweb.nascom.nasa.gov/search/.其中MOD09A1数据集利用QA波段去除云/雪干扰,利用前后两期无云雪影像进行线性插值,利用Whittaker Smoother方法进行数据平滑,完成数据预处理. ...
1982—1999年我国陆地植被活动对气候变化响应的季节差异
1
2003
... 由于植被对水分的需求在年内不同季节有明显差异,其生理活动在不同季节对气候变化同样具有不同的响应[18 ] ,因此以季节尺度监测我国植物抗逆性.以各季节中VPD相对同期历年均值差异最大的时期计算干旱程度,计算公式为: ...
1982—1999年我国陆地植被活动对气候变化响应的季节差异
1
2003
... 由于植被对水分的需求在年内不同季节有明显差异,其生理活动在不同季节对气候变化同样具有不同的响应[18 ] ,因此以季节尺度监测我国植物抗逆性.以各季节中VPD相对同期历年均值差异最大的时期计算干旱程度,计算公式为: ...
Monitoring the vernal advancement and retrogradation (green wave effect) of natural vegetation
1
1974
... Remote sensing index
Tab. 1 指数类型 指数名称 计算公式 编号 表征植被长势 归一化植被指数[19 ] ( ρ N I R - ρ R e d ) ( ρ N I R + ρ R e d ) 增强型植被指数[20 ] 2.5 × ρ N I R - ρ R e d ρ N I R + 2.4 ρ R e d + 1 优化土壤调整植被指数[21 ] ρ N I R - ρ R e d ρ N I R + ρ R e d + 0.16 表征植被生产力 总初级生产力 表征植被水分状况 地表水体指数[22 ] ρ N I R - ρ S W I R ρ N I R + ρ S W I R 短波红外水分胁迫指数[23 ] ρ S W I R 1 - ρ N I R ρ S W I R 1 + ρ N I R 归一化多波段干旱指数[24 ] ρ N I R - ( ρ S W I R 1 - ρ S W I R 2 ) ρ N I R + ( ρ S W I R 1 - ρ S W I R 2 ) 表征植被花青素含量 调整花青素反射指数[25 ] 1 ρ G r e e n - 1 ρ V R E 1 × ρ N I R 修正花青素含量指数[26 ] ρ N I R ρ G r e e n
式中:Indexi 为指数第i 期像元值; I n d e x i m e a n i 期像元值历年同期均值;std( I n d e x i s t a r t - I n d e x i e n d ) 为第i 期2001—2020年各指数标准差.对于 SIWSI,当T 2 >2时,判定为植被异常;对于NDVI、GPP、mACI,当T 2 <-2时,判定为植被异常. ...
Development of a two-band enhanced vegetation index without a blue band
1
2008
... Remote sensing index
Tab. 1 指数类型 指数名称 计算公式 编号 表征植被长势 归一化植被指数[19 ] ( ρ N I R - ρ R e d ) ( ρ N I R + ρ R e d ) 增强型植被指数[20 ] 2.5 × ρ N I R - ρ R e d ρ N I R + 2.4 ρ R e d + 1 优化土壤调整植被指数[21 ] ρ N I R - ρ R e d ρ N I R + ρ R e d + 0.16 表征植被生产力 总初级生产力 表征植被水分状况 地表水体指数[22 ] ρ N I R - ρ S W I R ρ N I R + ρ S W I R 短波红外水分胁迫指数[23 ] ρ S W I R 1 - ρ N I R ρ S W I R 1 + ρ N I R 归一化多波段干旱指数[24 ] ρ N I R - ( ρ S W I R 1 - ρ S W I R 2 ) ρ N I R + ( ρ S W I R 1 - ρ S W I R 2 ) 表征植被花青素含量 调整花青素反射指数[25 ] 1 ρ G r e e n - 1 ρ V R E 1 × ρ N I R 修正花青素含量指数[26 ] ρ N I R ρ G r e e n
式中:Indexi 为指数第i 期像元值; I n d e x i m e a n i 期像元值历年同期均值;std( I n d e x i s t a r t - I n d e x i e n d ) 为第i 期2001—2020年各指数标准差.对于 SIWSI,当T 2 >2时,判定为植被异常;对于NDVI、GPP、mACI,当T 2 <-2时,判定为植被异常. ...
Optimization of soil-adjusted vegetation indices
1
1996
... Remote sensing index
Tab. 1 指数类型 指数名称 计算公式 编号 表征植被长势 归一化植被指数[19 ] ( ρ N I R - ρ R e d ) ( ρ N I R + ρ R e d ) 增强型植被指数[20 ] 2.5 × ρ N I R - ρ R e d ρ N I R + 2.4 ρ R e d + 1 优化土壤调整植被指数[21 ] ρ N I R - ρ R e d ρ N I R + ρ R e d + 0.16 表征植被生产力 总初级生产力 表征植被水分状况 地表水体指数[22 ] ρ N I R - ρ S W I R ρ N I R + ρ S W I R 短波红外水分胁迫指数[23 ] ρ S W I R 1 - ρ N I R ρ S W I R 1 + ρ N I R 归一化多波段干旱指数[24 ] ρ N I R - ( ρ S W I R 1 - ρ S W I R 2 ) ρ N I R + ( ρ S W I R 1 - ρ S W I R 2 ) 表征植被花青素含量 调整花青素反射指数[25 ] 1 ρ G r e e n - 1 ρ V R E 1 × ρ N I R 修正花青素含量指数[26 ] ρ N I R ρ G r e e n
式中:Indexi 为指数第i 期像元值; I n d e x i m e a n i 期像元值历年同期均值;std( I n d e x i s t a r t - I n d e x i e n d ) 为第i 期2001—2020年各指数标准差.对于 SIWSI,当T 2 >2时,判定为植被异常;对于NDVI、GPP、mACI,当T 2 <-2时,判定为植被异常. ...
Landscape-scale characterization of cropland in China using Vegetation and Landsat TM images
1
2002
... Remote sensing index
Tab. 1 指数类型 指数名称 计算公式 编号 表征植被长势 归一化植被指数[19 ] ( ρ N I R - ρ R e d ) ( ρ N I R + ρ R e d ) 增强型植被指数[20 ] 2.5 × ρ N I R - ρ R e d ρ N I R + 2.4 ρ R e d + 1 优化土壤调整植被指数[21 ] ρ N I R - ρ R e d ρ N I R + ρ R e d + 0.16 表征植被生产力 总初级生产力 表征植被水分状况 地表水体指数[22 ] ρ N I R - ρ S W I R ρ N I R + ρ S W I R 短波红外水分胁迫指数[23 ] ρ S W I R 1 - ρ N I R ρ S W I R 1 + ρ N I R 归一化多波段干旱指数[24 ] ρ N I R - ( ρ S W I R 1 - ρ S W I R 2 ) ρ N I R + ( ρ S W I R 1 - ρ S W I R 2 ) 表征植被花青素含量 调整花青素反射指数[25 ] 1 ρ G r e e n - 1 ρ V R E 1 × ρ N I R 修正花青素含量指数[26 ] ρ N I R ρ G r e e n
式中:Indexi 为指数第i 期像元值; I n d e x i m e a n i 期像元值历年同期均值;std( I n d e x i s t a r t - I n d e x i e n d ) 为第i 期2001—2020年各指数标准差.对于 SIWSI,当T 2 >2时,判定为植被异常;对于NDVI、GPP、mACI,当T 2 <-2时,判定为植被异常. ...
Derivation of a shortwave infrared water stress index from MODIS near-and shortwave infrared data in a semiarid environment
1
2003
... Remote sensing index
Tab. 1 指数类型 指数名称 计算公式 编号 表征植被长势 归一化植被指数[19 ] ( ρ N I R - ρ R e d ) ( ρ N I R + ρ R e d ) 增强型植被指数[20 ] 2.5 × ρ N I R - ρ R e d ρ N I R + 2.4 ρ R e d + 1 优化土壤调整植被指数[21 ] ρ N I R - ρ R e d ρ N I R + ρ R e d + 0.16 表征植被生产力 总初级生产力 表征植被水分状况 地表水体指数[22 ] ρ N I R - ρ S W I R ρ N I R + ρ S W I R 短波红外水分胁迫指数[23 ] ρ S W I R 1 - ρ N I R ρ S W I R 1 + ρ N I R 归一化多波段干旱指数[24 ] ρ N I R - ( ρ S W I R 1 - ρ S W I R 2 ) ρ N I R + ( ρ S W I R 1 - ρ S W I R 2 ) 表征植被花青素含量 调整花青素反射指数[25 ] 1 ρ G r e e n - 1 ρ V R E 1 × ρ N I R 修正花青素含量指数[26 ] ρ N I R ρ G r e e n
式中:Indexi 为指数第i 期像元值; I n d e x i m e a n i 期像元值历年同期均值;std( I n d e x i s t a r t - I n d e x i e n d ) 为第i 期2001—2020年各指数标准差.对于 SIWSI,当T 2 >2时,判定为植被异常;对于NDVI、GPP、mACI,当T 2 <-2时,判定为植被异常. ...
The influence of soil salinity, growth form, and leaf moisture on-the spectral radiance of spartina alterniflora canopies
1
1983
... Remote sensing index
Tab. 1 指数类型 指数名称 计算公式 编号 表征植被长势 归一化植被指数[19 ] ( ρ N I R - ρ R e d ) ( ρ N I R + ρ R e d ) 增强型植被指数[20 ] 2.5 × ρ N I R - ρ R e d ρ N I R + 2.4 ρ R e d + 1 优化土壤调整植被指数[21 ] ρ N I R - ρ R e d ρ N I R + ρ R e d + 0.16 表征植被生产力 总初级生产力 表征植被水分状况 地表水体指数[22 ] ρ N I R - ρ S W I R ρ N I R + ρ S W I R 短波红外水分胁迫指数[23 ] ρ S W I R 1 - ρ N I R ρ S W I R 1 + ρ N I R 归一化多波段干旱指数[24 ] ρ N I R - ( ρ S W I R 1 - ρ S W I R 2 ) ρ N I R + ( ρ S W I R 1 - ρ S W I R 2 ) 表征植被花青素含量 调整花青素反射指数[25 ] 1 ρ G r e e n - 1 ρ V R E 1 × ρ N I R 修正花青素含量指数[26 ] ρ N I R ρ G r e e n
式中:Indexi 为指数第i 期像元值; I n d e x i m e a n i 期像元值历年同期均值;std( I n d e x i s t a r t - I n d e x i e n d ) 为第i 期2001—2020年各指数标准差.对于 SIWSI,当T 2 >2时,判定为植被异常;对于NDVI、GPP、mACI,当T 2 <-2时,判定为植被异常. ...
Three-band model for noninvasive estimation of chlorophyll, carotenoids, and anthocyanin contents in higher plant leaves
1
2006
... Remote sensing index
Tab. 1 指数类型 指数名称 计算公式 编号 表征植被长势 归一化植被指数[19 ] ( ρ N I R - ρ R e d ) ( ρ N I R + ρ R e d ) 增强型植被指数[20 ] 2.5 × ρ N I R - ρ R e d ρ N I R + 2.4 ρ R e d + 1 优化土壤调整植被指数[21 ] ρ N I R - ρ R e d ρ N I R + ρ R e d + 0.16 表征植被生产力 总初级生产力 表征植被水分状况 地表水体指数[22 ] ρ N I R - ρ S W I R ρ N I R + ρ S W I R 短波红外水分胁迫指数[23 ] ρ S W I R 1 - ρ N I R ρ S W I R 1 + ρ N I R 归一化多波段干旱指数[24 ] ρ N I R - ( ρ S W I R 1 - ρ S W I R 2 ) ρ N I R + ( ρ S W I R 1 - ρ S W I R 2 ) 表征植被花青素含量 调整花青素反射指数[25 ] 1 ρ G r e e n - 1 ρ V R E 1 × ρ N I R 修正花青素含量指数[26 ] ρ N I R ρ G r e e n
式中:Indexi 为指数第i 期像元值; I n d e x i m e a n i 期像元值历年同期均值;std( I n d e x i s t a r t - I n d e x i e n d ) 为第i 期2001—2020年各指数标准差.对于 SIWSI,当T 2 >2时,判定为植被异常;对于NDVI、GPP、mACI,当T 2 <-2时,判定为植被异常. ...
Nondestructive estimation of anthocyanin content in grapevine leaves
1
2009
... Remote sensing index
Tab. 1 指数类型 指数名称 计算公式 编号 表征植被长势 归一化植被指数[19 ] ( ρ N I R - ρ R e d ) ( ρ N I R + ρ R e d ) 增强型植被指数[20 ] 2.5 × ρ N I R - ρ R e d ρ N I R + 2.4 ρ R e d + 1 优化土壤调整植被指数[21 ] ρ N I R - ρ R e d ρ N I R + ρ R e d + 0.16 表征植被生产力 总初级生产力 表征植被水分状况 地表水体指数[22 ] ρ N I R - ρ S W I R ρ N I R + ρ S W I R 短波红外水分胁迫指数[23 ] ρ S W I R 1 - ρ N I R ρ S W I R 1 + ρ N I R 归一化多波段干旱指数[24 ] ρ N I R - ( ρ S W I R 1 - ρ S W I R 2 ) ρ N I R + ( ρ S W I R 1 - ρ S W I R 2 ) 表征植被花青素含量 调整花青素反射指数[25 ] 1 ρ G r e e n - 1 ρ V R E 1 × ρ N I R 修正花青素含量指数[26 ] ρ N I R ρ G r e e n
式中:Indexi 为指数第i 期像元值; I n d e x i m e a n i 期像元值历年同期均值;std( I n d e x i s t a r t - I n d e x i e n d ) 为第i 期2001—2020年各指数标准差.对于 SIWSI,当T 2 >2时,判定为植被异常;对于NDVI、GPP、mACI,当T 2 <-2时,判定为植被异常. ...
Linking definitions, mechanisms, and modeling of drought-induced tree death
1
2012
... 植被生态系统的恢复能力指系统发生变化后恢复到原来状态的能力.初级生产力作为生态系统最重要的生物状态变量,其动态受环境驱动变量变化的影响.恢复能力较强的植被,当生态系统驱动变量恢复到正常水平,其生物状态变量也能近似恢复到正常水平[27 ] .以干旱后第二年植被有机物累积量作为监测植被恢复情况的依据,相比监测植被恢复到原始状态所需的时间,这一方法不需要长时间的跟踪且工作量较小.计算公式为: ...
Effects of drought on vegetation productivity of farmland ecosystems in the drylands of Northern China
1
2021
... 我国植物抗逆性存在显著的空间异质性,主要由植被的空间分布决定.已有研究表明,干旱对雨养农田的影响最大,其次是自然植被,对灌溉农田的影响最小[28 ] .春季、夏季植物抗逆性综合评分低于70分的区域主要位于山西、陕西北部,冬季抗逆性综合评分低于70分的区域主要位于河南、山东、湖北一带.这些地区年降雨量在400~800 mm,处于亚湿润区向半干旱区的过渡地带,主要植被类型是农田,由于灌溉水源缺乏,依靠天然降水发展雨养农业成为发展农业生产的基本方略,受干旱影响最大;春季评分高于90分的区域主要集中在内蒙古东北部以及云南的南部地区,夏季评分高于90分的区域主要集中在内蒙古北部、西藏西南部以及黑龙江北部地区.这些地区主要以自然植被为主.内蒙古东北部以及西藏西南部地区以及黑龙江北部地区分布有大面积的多年冻土.由于其埋深大、水分补给少的特点,植被生长环境旱化,植被根系发达、耐旱性强. ...
Global diversity of drought tolerance and grassland climate-change resilience
1
2013
... 从我国不同植被类型的抗逆性综合评分分布来看(图4 ),落叶针叶林综合评分的分布最为集中,且在夏季其抗逆性明显优于其他植被类型.我国落叶针叶林主要分布在50 °N以上地区,这些地区降雨量常年在400~600 mm之间.落叶针叶林适宜生长在较干旱的环境中,蒸腾作用弱,水分利用效率高.因此相对于别的植被,尤其在夏季干旱胁迫下,落叶针叶林表现出更强的抗逆性.我国常绿阔叶林主要分布在长江以南地区,夏季生长尤为旺盛,蒸腾作用强,对水分缺失更为敏感,导致了夏季干旱胁迫下其抗逆性低于落叶阔叶林.不同植被类型抗逆性存在显著差异,同一植被类型抗逆性同样存在显著的类内异质性.落叶针叶林综合评分分布相比其他类型植被更为集中,我国落叶针叶林集中分布在大兴安岭北部山地,因此抗逆性类内差异很小.春秋两季草地的抗逆性优于落叶针叶林但抗逆性类内差异大,综合评分分布相对分散.我国草种资源种类繁多,各类型草种广泛分布,不同类型草种的生理耐旱性的差异可达十倍[29 ] ,故其具有较大的抗逆性类内差异. ...


