

1 引言
城市社区韧性,是指社区在内外部复杂环境系统中充分调动可利用资源,快速应对和适应风险灾害的冲击,并恢复居民生活稳态的能力。由于现代城市风险灾害的不确定性,社区韧性被引入城市防灾治理领域[1],也逐步被纳入到全球风险治理的核心话语体系[2-3]。社区作为城市诸多系统之一,其韧性与供应系统高度关联。突发公共卫生事件时,社区作为城市基本单元与神经末梢,对物资需求变化极其敏感,常导致城市局部地区物资需求的迅速增 长[4],低韧性社区往往面临更大的生活必需品供应匮乏风险,也容易成为非常时期城市供应保障的薄弱环节而触发一系列严重问题。供应保障涉及突发公共事件下居民基本生存问题,显著影响社区系统韧性,因此,构建城市社区韧性评估模型、识别低韧性社区并探索社区韧性针对性提升策略,对提升现代化城市治理能力与保障居民福祉具有重要意义。
社区韧性评估研究较为丰硕,前人学者曾提出如社区灾害韧性框架、4R模型、社区韧性框架[5⇓-7]等模型,为社区韧性深入研究提供了一定参考,但研究大多局限于社区单一系统韧性的讨论,对多系统关联或网络视角介入社区韧性相关研究关注较少。国外学者多关注突发公共事件下城市空间韧性提升或社区保健系统构建等[8⇓⇓-11],国内学者近年多关注社区防疫规划与策略及基层医疗配套等[12-13]。未来城市存在若干各自发展又相互关联的系统,这与作为单一系统的城市有着根本的区别[14],社区系统无法孤立存在,其与城市供应体系等外部资源环境紧密交互,构成动态的复杂体系。传统关注社区内部功能结构与社区事务管理的社区治理[15],已不能满足当今社区供应保障管理需求。本研究结合复杂网络理论解析城市网络中社区与供应关系,并以特大城市社区生活物资供应为例开展实证研究,尝试测度城市供应保障下的社区动态韧性,从而探索提出基于复杂网络理论构建社区韧性评估方法框架,实现从“单系统评价”走向“多系统关联评价”的社区韧性评估底层理论思维突破。
当前国内城市供需体系包括“原产地-批发市场-农贸市场或前置仓-社区”等多个层级,其中“市场-社区”层级最切中居民在突发事件下的基本生存问题。从“体系韧性”的概念共识走向理论实践尤为重要,复杂网络(Complex Network)为研究城市供需网络中的社区韧性提供了路径,其是由节点与节点间的相互关联组成的复杂系统。有学者结合复杂网络方法挖掘人流时空行为模式、构建多灾种时空耦合网络[16⇓-18]等。在突发公共事件情境下,受灾地区物资需求迅速变化从而影响城市基础设施网络。在物资供应保障研究方面,大多研究从供给端出发,容易忽视与市民日常生活直接关联的“市场-社区”生活必需品物资供应这一层级,而该层级最能反映突发情况下社区需求与设施网络动态变化[19],对剖析基层社区供应保障的影响因素举足轻重。在研究方法上,主要包括抗毁性算法、多智能体、遗传算法、结构方程模型[20⇓-22]等,其中抗毁性算法可模拟城市真实情况,蓄意攻击现实薄弱节点,有效衡量物资供应保障与社区韧性之间的关系。
因此,本研究采用复杂网络方法研究“市场-社区”层级的生活物资供应网络,选取抗毁性算法模拟供需网络中的社区韧性与供应关系,解析供应系统与社区系统的关联机制,识别潜在供应保障不足的低韧性社区,关注低韧性社区居民物资需求与物资供应网络的动态响应,以期为基层应急预案决策与生活物资保障提供科学依据,为城市社区管理与供应设施建设提供参考借鉴。
2 研究设计
2.1 研究思路
本研究聚焦与市民生活密切相关的生活物资供应网络(本文中生活物资主要指蔬菜、粮油、方便食品及日常生活用品等生活必需品),基于“市场-社区”供应网络层级构建社区韧性评估模型,如图1所示。
图1
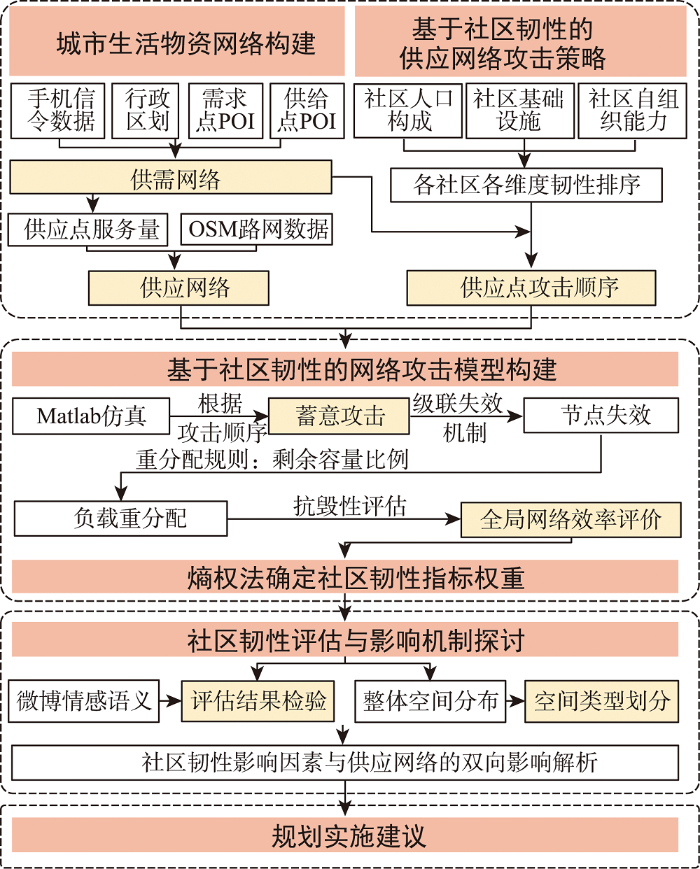
首先,借助手机信令、POI(Point of Interest)、OSM(Open Street Map)等多源数据构建城市生活物资供需网络和供应网络,同时基于社区韧性不同影响因子制定供应网络制定攻击策略;其次,利用抗毁性分析方法模拟社区韧性影响因子对整体供应网络的影响,结合熵权法确定各因素权重,识别突发事件下潜在的低韧性社区;最后,通过解析不同社区韧性影响因素对网络的影响,探究社区韧性与供应保障的双向影响机制,为完善提升社区人居环境与供应保障供量化依据。
2.2 模型构建
模型构建有2个前提假设:① 假设同层级的城市内部社区级供应点间能够自由进行物资调配; ② 假设城市外部供应与内部运力充足。
2.2.1 构建供需网络与供应网络
城市生活物资网络分为供需网络和供应网络,其中供需网络是供应点与需求点之间的网络,供应网络是供应点之间的网络,分别用于计算供应点的常态服务量与供应点间的联系程度。
(1)供需网络的构建
因手机信令数据包含用户所在地理位置及驻留时长信息,可作为研究城市居民出行行为的基础数据,包含职住、娱住等日常出行信息,故采用手机信令轨迹数据模拟城市真实的供需关系。研究根据居民的时空间对应关系识别其采买范围和居住空间,操作方法如下:
① 通过GIS平台将供、需点空间数据与500 m×500 m网格进行空间链接,使其带有网格ID信息;
② 通过信令数据停留时长识别出居民的稳定停留地,将通勤类交通出行量数据(Origin-Destination Data,OD)排除;并从手机信令数据的单向非通勤OD中进一步筛选出供、需网格间的OD,即为前往市场等供应点购物物资的市民的出行轨迹;
③ 将数据转换为供需网格间的OD矩阵,利用ArcGIS构建基于真实人群轨迹的供需网络空间 模型。
供应点x的服务能力
式中:
(2)供应网络的构建
突发事件中,供应点间的物资调配机制受到两个供应点间联系度的影响。设定供应点x和y的生活物资服务联系度为
式中:
此外,由于现实生活中距离较远或生活物资储备量较小的供应点难以对其他供应点提供物资调配,故研究设定生活物资联系度门槛值
2.2.2 基于社区韧性的网络攻击模型构建
(1)基于社区韧性的供应网络攻击策略
本研究从社区人口构成、社区基础设施、社区自组织能力3个维度衡量社区韧性,并扩展为5个指标作为供应网络攻击策略设定的依据(表1)。经评估得到社区韧性排序并识别出低韧性社区后,对供需网络中的主要供应点依次进行蓄意攻击,以此模拟城市突发公共事件下对社区与市场的打击,从而来评估整个生活物资网络的抗毁性。
表1 社区供应保障与韧性评估指标体系
Tab. 1
| 韧性评估维度 | 指标要素 | 对韧性的影响 | 数据来源及计算方法 |
|---|---|---|---|
| 社区人口构成 | 人口密度 | 正向影响 | 手机信令;网格单元总人口/单元面积(%) |
| 老年人比例 | 正向影响 | 手机信令再校准;大于60岁人口/总人数(%),并根据广州统计年鉴进行校准(校准系数为1.214) | |
| 人均消费能力 | 负向影响 | 手机信令数据;综合话费与手机型号进行分级 | |
| 社区基础设施 | 商超密度 | 负向影响 | POI;计算方法:供应点POI数量(网格单元商场、超市等)/单元面积(%) |
| 社区自组织能力 | 非通勤人流比例 | 正向影响 | 手机信令;非通勤人数/总人数(%) |
(2)考虑级联失效的供应网络抗毁性评估
复杂网络中的微小变动都将对其他节点产生影响[24],级联失效是供应链中断的根本原因之一。级联失效是指在复杂网络中局部的失效可能导致关联部分的接连性失效,最后导致整体网络的失效。突发事件中,需求端居民时空行为变化会导致物资需求变化,例如受灾供应点失效后居民需求会转向其他供应点等。居民需求不是一个宏观的静态数字,更关系到突发事件下社区中个体的受灾情况与真实需求变化。
因此,社区居民的动态反馈应被给予充分重视,本研究制定针对基于社区韧性的攻击策略时,将受灾社区物资需求的级联失效与级联传播纳入考虑。主要包括以下几个方面:
① 蓄意攻击下节点失效
根据上文提到的5个指标分别制定攻击策略,通过Matlab软件模拟灾害攻击供应点。被攻击节点失效后,其物资负载量转由附近供应点承担。设定每个供应点能承载的最大负载量为
式中:
② 负载重分配
重分配负载公式为:
式中:
③ 全局网络效率评价
当供应点i过载且周围节点均过载时,供应点i上的超额负载将无法分配,划定为缺失服务量。当网络中缺失服务量不再增加,网络级联效应结束。采用全局网络效率来评价供应网络受到蓄意攻击后韧性变化,其通常用于反应整个网络中节点间连接的难易程度,公式如下:
式中:
2.2.3 利用熵权法确定社区韧性权重
熵权法通过各指标变异离散程度来进行权重计算,即关注各指标熵值提供的信息量大小。采用5种方式蓄意攻击后供应网络的全局网络效率变化斜率作为指标,计算社区韧性指标权重。
首先,计算各社区主要供应点受攻击后全局网络效率曲线变化斜率:
式中:
接着,通过对标准化后的数据计算信息熵,并得到社区韧性指标权重:
式中:
最后,根据熵权法得到的权重,综合评价社区韧性,公式如下:
式中:
3 实证研究
3.1 研究区概况
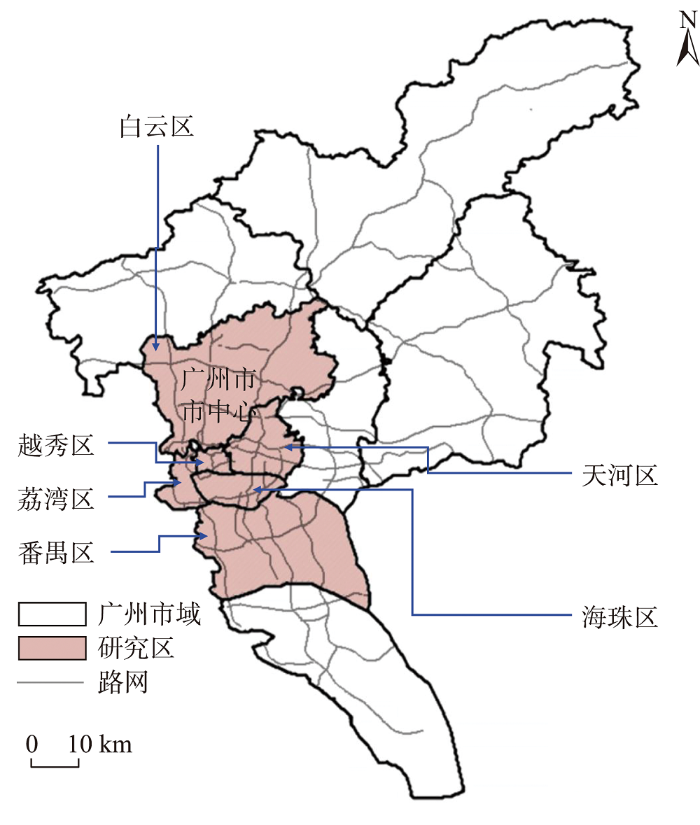
研究选取广东省广州市中心六区作为研究 区域(图2),研究区面积约1 605 km2,常住人口约 1 275万人。作为人口基数庞大的特大城市,广州供需网络层级复杂且不同类型的社区数量众多,社区供应保障能力在应对突发公共事件时尤为重要。社区供应保障韧性是民生底线,以广州作为实证案例能为特大城市社区韧性提升与供应设施配备提供参考。
图2
3.2 数据来源与处理
如表2所示,本研究采用的数据主要包括3类:① 社区位置点数据;② 用于构建城市供需网络的数据:手机信令OD数据、POI(生活物资供应点、需求点等)、道路网与行政区划数据;③ 微博签到数据:包含2021年6月广州新冠疫情时的签到位置与文本数据,用来校验低韧性社区识别结果。
表2 数据来源
Tab. 2
| 数据类型 | 数据说明 | 数据来源 | 年份 |
|---|---|---|---|
| 手机信令数据 | 包括非通勤OD、社区人口数、老年人比例、人均消费能力等信息,共 63 577条 | 中国联通智慧足迹 | 2021 |
| 需求点POI | 包括住宅区、宿舍等,共31 263个 | 百度地图开放平台API | 2022 |
| 生活物资供应点POI | 肉菜市场、前置仓、社区商超、购物中心等,共20 945个 | 百度地图开放平台API | 2022 |
| 交通道路路网 | 都市高速路 、高速公路 、省道 、县道 、乡镇道路 、行人道路 、其他道路 | OpenStreetMap | 2022 |
| 行政区划数据 | 后处理为500 m×500 m网格 | 国家地理信息公共服务平台 | 2022 |
| 社交媒体数据 | 微博签到与文本数据,共16.3万条 | 新浪微博 | 2021 |
注:① 手机信令数据于2021年9月采集,在此期间广州市几乎无新增境内确诊病例和境内无症状感染者,为常态化时期的人流OD信息,用于建立正常情况的供需网络;② 微博签到数据为2021年6月采集,该时期广州芳村与海珠中部等多地爆发疫情,从16万条数据中识别市民情感,将其作为实际案例检验低韧性社区识别结果。
数据处理主要包括如下4个方面:
(1)数据清洗:对重复数据进行清洗。
(2)OD数据扩样:根据联通运营商市场占有率扩样至全市人口。① 扩样常住人口=移动常住人口×扩样系数;② 扩样系数=1/(运营商市场占有率×移动电话普及率)。
(3)道路网数据处理:主要包括Arcpy单线化处理与GIS的OD成本分析。
(4)社交媒体数据处理:筛选包含“疫情”、“物资”等关键词的文本数据,进行数据清洗与自然情感倾向判断。
3.3 城市供需网络构建与分析
研究发现,供需网络构建结果与广州“十四五”时期供需网络特征、规划发展方向基本一致。如图3所示,广州中心六区供需网络整体呈现以中心城区为核心,向北、东、南部延伸的供应格局;供需网络最密集的区域集中在荔湾-越秀-海珠-天河东西走向,整体发展态势较好,东部供需网络联系相对最为紧密。同时,分析主要供需联系通道可知:在车陂-棠下街道、天河-石牌街道、瑞宝-南州街道等呈现小组团分布特征;在赤岗-凤阳街道呈现大组团分布。社区-市场联系主要以500~2 000 m中短距离为主。
图3
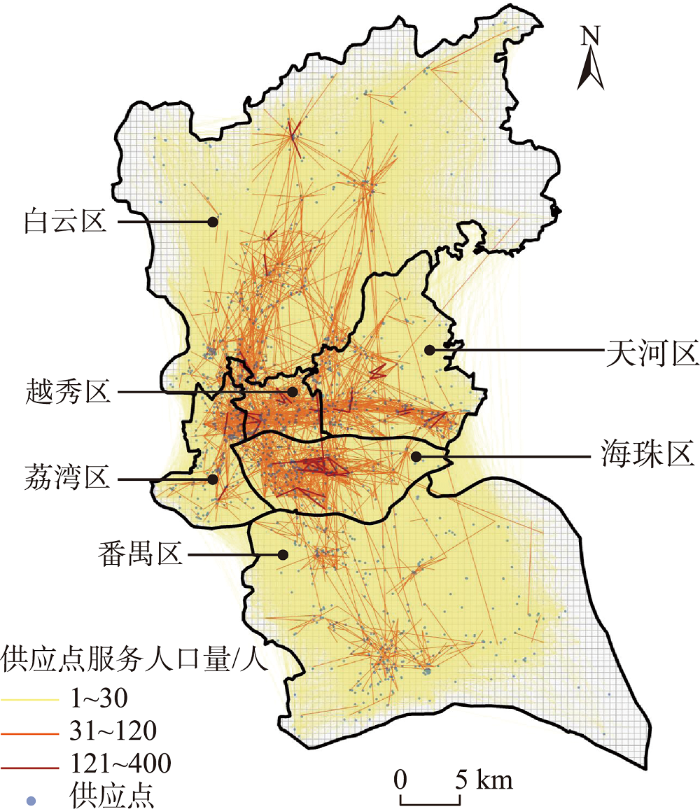
图3
广州市中心六区供需网络及供应点服务能力分析
Fig. 3
Analysis of supply-demand network and service volume of supply nodes in six central districts of Guangzhou
研究发现(图4),广州中心城区生活物资网络供应点联系较为密集,重大公共事件突发时,供应点能通过物资调度有效疏散服务量,满足周边城市居民的需求;中心城区服务量较大,存在多个核心供应点,其联系范围广且与周边供应点联系度高;番禺区与白云区供应点分布较为零散,点与点之间联系较弱,存在多个孤立供应点,疫情发生时物资调度易有阻碍,网络受到攻击时难以通过周围供应点疏散服务量。
图4
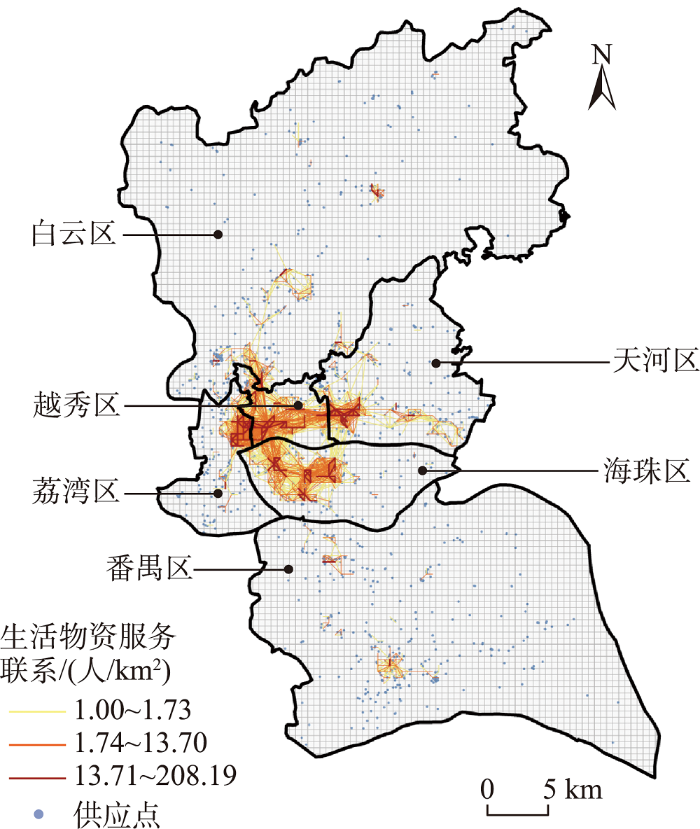
图4
广州市中心六区供应网络及生活物资服务联系度分析
Fig. 4
Analysis of supply network and service connection degree of daily necessities in six central districts of Guangzhou
3.4 社区韧性评估结果与校验
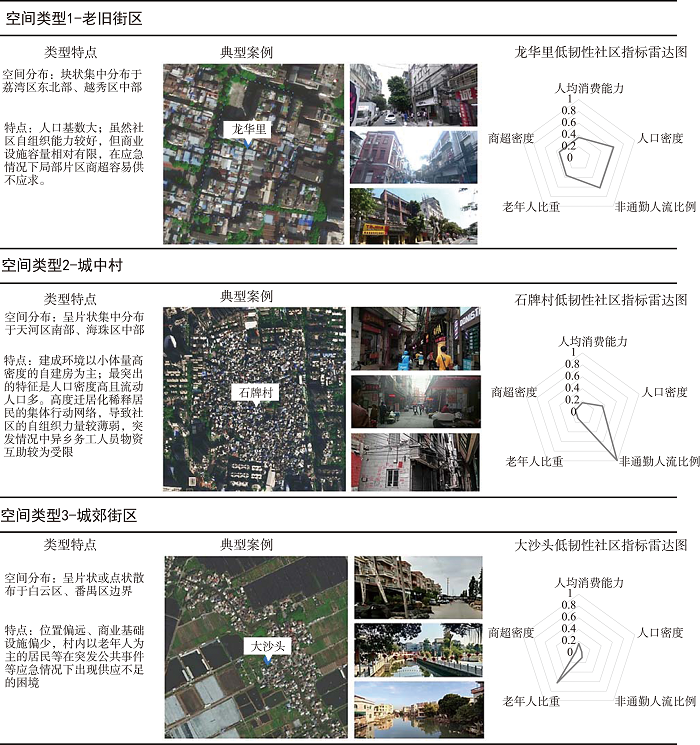
通过上文2.2节提出的网络抗毁性评估与熵权法综合评定后,得到人口密度、老年人比例、人均消费能力、商超密度、非通勤人流比例的权重结果分别为0.48、0.11、0.06、0.08、0.27。如图5所示,基于复杂网络理论的社区韧性综合评价和识别分析发现:潜在供应保障缺失的低韧性社区整体呈局部成片聚集、少数分散分布,主要集中分布在越秀区中部、海珠区中部、荔湾区东北部及天河区南部,呈东西向块状分布,其他低韧性社区散布在番禺区与白云区的边缘地带;高韧性社区主要分布在天河区中部与东部、番禺区北部、海珠区南部等区域,相对完善的设施配套与住区规划使供应保障韧性较强。通过结合卫星影像、街景图片及实地考察进一步分析发现,低韧性社区主要分为3种空间类型(表3):老旧街区、城中村、城郊街区,分别选取典型样本地区进行指标细化评估,限于篇幅不再赘述。
图5
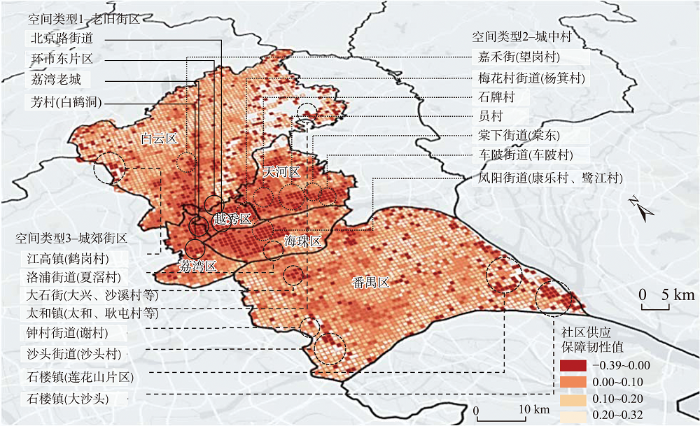
图5
基于复杂网络的社区韧性评估结果
Fig. 5
Community resilience results based on complex network method
为检验社区韧性评估结果的准确性,选取城市重大公共事件下的公共情绪感知进行检验。通过突发事件时期微博语义分析可以侧面反映当时公众感知情况,与社区韧性评估结果进行对比分析(图6),可发现通过本文提出的评估方法识别的低韧性社区与微博负面情感空间分布典型区域基本耦合。
图6
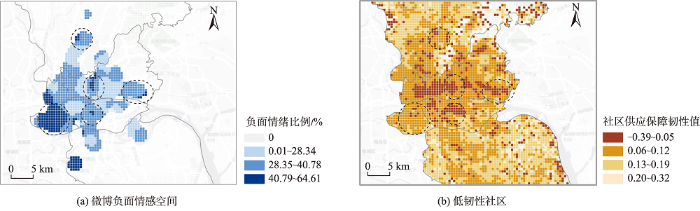
图6
微博负面情感空间(生活物资供应缺失公众情绪感知)与低韧性社区评估结果对比分析
注:虚线圈代表负面情绪重点区域。
Fig. 6
A comparative analysis of Weibo negative emotional space and the evaluation results of low resilience communities
3.5 社区韧性与供应网络的双向影响解析
通过针对社区韧性的5个不同指标进行攻击的全局网络效率变化(图7),可以发现:① 社区人口密度是网络供应韧性的主要影响因素,基于人口密度的攻击在第120次左右就降低至一个稳定低值,侧面也反映了人口是设施规划布局需要关注的核心问题; ② 在供应网络全局网络效率降低的不同阶段,社区韧性主要影响因素不同。其中,在供应网络级联失效前期阶段,商超密度和非通勤人流比例是影响供应网络的重要因素,因社区商超类设施可保障社区居民的基本生活需求,面临突发公共事件时可根据需求量变动调整物资储配从而保障供应网络的持续运转;在失效中期阶段,非通勤人流比例是影响供给网络的重要因素,在公共突发事件下,居委会或业委会等与社区机动人员能否在短时间内形成较好的协作关系,相互援助应急物资与灾害资讯,对供应网络也会产生重要影响;在失效后期阶段,老年人比例和商超密度成为影响供给网络的重要因素。
图7
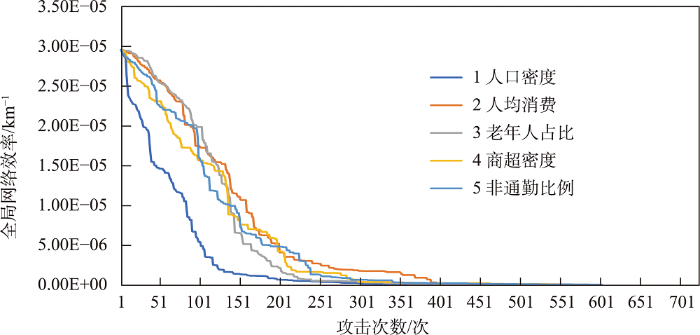
图7
基于社区韧性的5种蓄意攻击下的全局网络效率变化
Fig. 7
Changes in global network efficiency under five deliberate attacks based on community resilience
综上可以发现,社区韧性系统与供应网络之间存在动态双向影响,如图8所示。
图8
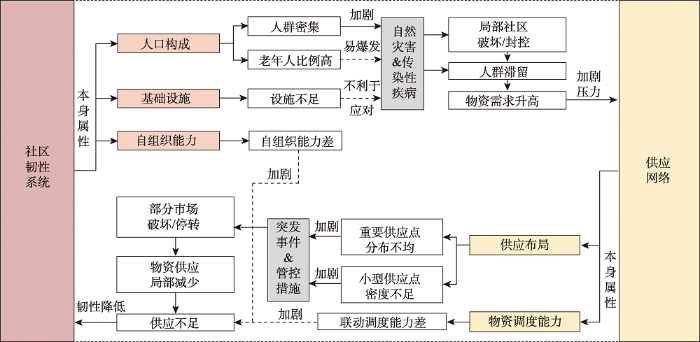
图8
社区韧性与供应网络的双向影响解析
Fig. 8
The bidirectional influence between community resilience and supply system
对于供应网络而言,供应设施的合理布局与供应点之间的物资调度是影响社区韧性的2个主要传导路径。一方面,社区基础设施是系统韧性的物质基础,设施的合理布局和完备性能提高社区抵御和应对灾害的能力。农贸市场、社区商超等不同层级的生活物资供应设施均需合理配置。因此,除了考虑设施物资服务能力外,还需考虑可预见灾害下的物资预储备,提升供应节点在复杂网络中的韧性。另一方面,复杂网络中供应端的高度联动将进一步提升社区层面的供应韧性。社区与市场都不是“孤岛”,彼此孤立考虑会过于放大某个供应点失效对某社区的影响[29],网络结构中的权衡与调整十分重要[30],因此,突发事件下区域内部社区超市、肉菜市场等供应点间有必要建立物资调度预案机制,物资补供与有效分配有利于纾解社区可能面临的物资匮乏困境,上述基于复杂网络抗毁性分析的社区韧性动态评估方法为之奠定良好的基础。
4 讨论
本研究提出的方法框架本质上是通过双系统的关联来进行评估,是基于体系思维的方法推导与实证尝试,具有较好的方法论价值与推广意义。以供应网络与社区为研究对象,基于复杂网络尝试解析城市子系统间的作用机理,也为其他城市子系统间的量化研究提供思路参考。在韧性评估结果层面,不同的韧性评估指标体系得到不同结果准确与否,评估“数值”是否能真实反映社区面临灾害冲击时的韧性变化,尚未得到明确的学界共识,本评估框架创新性通过城市多源数据反馈供应动态,并预判社区面临突发情况时的物资保障效果,除了能提供结合社区评估提出完善设施、提升治理等建议外,还能有效评估突发事件下哪些社区存在多少物资供应缺口,可为落实应急管理、物资输送与规划决策等提供量化支撑与科学参考。
社区作为城市治理基本单元,对推动供需联动与增强城市韧性具有关键作用。首先,政府重视社区基础设施更新,强化供应设施物理韧性。由于低韧性社区基础设施相对欠缺、人口基数大、流动人口多或人口老龄化等问题,网络失效风险相对较高[30],建议通过新增、扩容等方式逐步完善供应网络,增强设施稳定性、配送及时性。其次,应重视数据与技术整合,提升社区应急技术韧性。在多源数据所构建的韧性评估模型基础上整合需求及相关设施数据,搭建社区应急智能化信息系统,实现物资供应的“风险识别-风险评估-监控预警”的信息共享交互。最后,优化社区组织结构,提升社区治理韧性。给予基层政府充分的自治职能,组织社区队伍有序参与社区应急实践,提升社区工作方案精细度,在社区之间建立远程支助网络,使其在应对突发危机以及风险管理规划方面相互联系,夯实社区应急组织的整合性和自治力。
5 结语
本研究以广州中心城区为例,基于复杂网络分析供应保障下的社区韧性并构建社区韧性评估框架,从“自下而上”视角解析城市生活物资供需网络,结合级联失效机制对供应网络进行抗毁性分析评估,进一步提炼影响社区供应保障的核心影响因素,研究解析突发事件下不同因素对供需网络的影响程度,并尝试解析社区韧性与供应网络之间的双向影响机理和针对性提出优化提升策略。研究发现:① 基于复杂网络的供应保障低韧性社区空间分布以局部成片聚集、少数分散为主,大致分成老旧街区、城中村及城郊街区3种空间类型;② 在供应网络全局网络效率降低的不同阶段,社区韧性的主要影响因素不同。其中,人口密度为首要考虑因素,非通勤人流比例一定程度上可测度社区自组织能力; ③ 社区韧性与供应保障存在复杂的双向影响关系。低韧性社区更易出现突发公共事件,导致局部供应网络崩溃;供应设施布局与供应点间的物资调度也会影响社区整体韧性。
供需端物资信息的迅速传递与供应点间的高度联动才能更有效地提升城市供应体系韧性与社区韧性,本研究可为未来城市管理搭建实时更新的数字供需网络平台提供参考借鉴。本研究侧重方法框架的讨论,采用精度较高的人群轨迹数据,并结合市民“生活物资”相关需求情感、实地调查验证韧性评估结果和现实情况较为符合,但研究选取的韧性指标体系有待进一步优化,指标测度的数据质量也待进一步提升。需要补充说明的是:① 研究虽针对老年人口比例等数据进行整体校正,但因采用手机信令数据不包含部分无现代通讯工具人群,存在误差不可避免,未来随着城市地区电子支付普及化,该部分人群对采购行为识别的影响相对较小; ② 在特大城市中各区域早晚时段人口分布差异较大,导致物资分配存在一定差异,未来研究中建议考虑结合日夜不同时空供应动态对社区韧性进行深入解析; ③ 建议未来研究构建定量模型对社区韧性与供应网络的双向影响机理进一步探索,或根据规划决策方案对提升后的低韧性社区进行模拟攻击,以期校核方案的科学性与可靠性。
参考文献
规划提高城市免疫力——应对新型冠状病毒肺炎突发事件笔谈会
[J].
Planning improves city’s immunity: A written conversation on covid-19 breakout
[J].
Urban sustainability and resilience: From theory to practice
[J].
Quantifying disaster resilience of a community with interdependent civil infrastructure systems
[J].
COVID-19智能体模型及城市疫情封控措施评价研究
[J].
DOI:10.3778/j.issn.1002-8331.2011-0305
[本文引用: 1]

国内新冠肺炎(COVID-19)疫情平稳后,外来输入携带病毒的人与货物可能导致国内出现疫情小幅反弹。针对各地疫情反弹后城市采取封控措施的尺度对城市运行的影响问题,结合多智能体仿真、复杂网络模型中的小世界网络与GIS技术,构建了COVID-19城市空间智能体模型,通过马尔科夫蒙特卡洛方法(Markov chain Monte Carlo,MCMC)率定了模型的关键参数。利用该模型,对某市二次疫情进行模拟,采用不同空间尺度(社区封控、区县封控)的封控措施对疫情在空间上扩散范围和数量上增长情况的影响程度进行分析。研究结果表明,出现感染者后前3~5天是封控的最佳时机。社区封控对缩小疫情空间扩散范围和降低感染者数量增幅,在单点爆发与多点散发两种模式下效果基本相似,因此适合应对单点爆发模式。区县封控应对多点散发效果更好。结合分析结果为疫情出现反弹后封控措施制定提出建议。
Research on COVID-19 agent model and evaluation of urban epidemic siege measures
[J].After the COVID-19 epidemic has stabilized in China, the domestic epidemic situation may rebound slightly due to imported people and goods carrying the virus. The COVID-19 urban space agent model is constructed to deal with the impact of the city’s containment measures on the operation of the city after the epidemic rebounds. Combined with multi-agent simulation and small-world networks in complex network models with GIS, the key parameters of the model are calibrated by the Markov chain Monte Carlo method(MCMC). The COVID-19 urban space agent model is used to simulate the secondary epidemic in a city and analyze the degree of influence of the spatial spread and quantitative growth of the epidemic by adopting different spatial scales(community siege, district and county siege). The results show that the best time for siege is 3 to 5 days after the emergence of infected people, and the effect of community siege on reducing the spatial spread range of epidemic situation and reducing the increase of the number of infected persons is basically similar under the two modes of single point outbreak and multi-point distribution, so it is suitable for dealing with single point outbreak mode. District and county siege should be more effective. Combined with the results of the analysis, suggestions are made for the formulation of containment measures after the epidemic rebounds.
Social systems, ecological networks and disasters: Toward a socio-political ecology of disasters
[J].
A framework to quantitatively assess and enhance the seismic resilience of communities
[J].This paper presents a conceptual framework to define seismic resilience of communities and quantitative measures of resilience that can be useful for a coordinated research effort focusing on enhancing this resilience. This framework relies on the complementary measures of resilience: “Reduced failure probabilities,” “Reduced consequences from failures,” and “Reduced time to recovery.” The framework also includes quantitative measures of the “ends” of robustness and rapidity, and the “means” of resourcefulness and redundancy, and integrates those measures into the four dimensions of community resilience—technical, organizational, social, and economic—all of which can be used to quantify measures of resilience for various types of physical and organizational systems. Systems diagrams then establish the tasks required to achieve these objectives. This framework can be useful in future research to determine the resiliency of different units of analysis and systems, and to develop resiliency targets and detailed analytical procedures to generate these values.
A place-based model for understanding community resilience to natural disasters
[J].
Measuring and improving community resilience: A fuzzy logic approach
[J].
国外社区韧性研究的知识图谱与热点前沿——基于Web of Science(2001―2020年)的可视化分析
[J].
Knowledge graph, hot topics and frontiers of community resilience studies abroad—Visual analysis based on web of science database(2001-2020)
[J].
Disaster resilience indicators for benchmarking baseline conditions
[J].
Social prescribing: A ‘natural’ community-based solution
[J].This paper discusses social prescribing as part of the wider NHS England universal personalised care model, and it describes how community nurses can engage with social prescribing systems to support community resilience. A case study based on the example of gardening, as a nature-based social prescription provided by the RHS Bridgewater Wellbeing Garden, is provided to illustrate the scope, reach and impact of non-medical, salutogenic approaches for community practitioners. The authors argue that social prescribing and, in particular, nature-based solutions, such as gardening, can be used as a non-medical asset-based approach by all health professionals working in the community as a way to promote health and wellbeing. They consider how the negative impact of social distancing resulting from COVID-19 restrictions could be diluted through collaboration between a holistic, social prescribing system and community staff. The paper presents a unique perspective on how community nurses can collaborate with link workers through social prescribing to help combat social isolation and anxiety and support resilience.
雄安新区韧性社区建设策略——基于复杂适应系统理论的研究
[J].
The construction strategy of resilient communities in Xiong’an new area: Based on the theory of complex adaptive system
[J].
常态化防控要求下城市基层医疗设施规划研究 ——以广州为例
[J].
DOI:10.3969/j.issn.1000-0232.2020.04.001
[本文引用: 1]
“后新冠”时期常态化防控需要高效的分级诊疗体系支撑,完备的基层医疗设施配套是分级诊疗体系的基础。以广州为例,运用POI 数据分析、实地走访调研等方法,发现我国目前基层医疗设施在服务定位、空间布局、以及与整体医疗系统对接等三方面均存在问题,致使其未能满足常态化防控的需求。据此,提出转变基层医疗设施定位、建立城市医疗分区、优化基层医疗资源配置、制定基层医疗设施应急响应改造措施等规划建议。
Research on the planning of medical facilities at the sub-district level under the requirements of regular epidemic prevention and control: A case study of Guangzhou
[J].
未来城市体系:概念、机理与创造
[J].
Future Cities as a system of systems: Its concept, mechanism and creation
[J].
社区智慧治理技术框架构建研究
[J].
A technical framework of community smart governance
[J].
复杂网络视角下时空行为轨迹模式挖掘研究
[J].
DOI:10.13249/j.cnki.sgs.2021.09.002
[本文引用: 1]
针对时空行为轨迹大数据的序列性、时空交互性、多维度性等复杂特性,构建结合时间地理学与复杂网络的分析框架,建立时空行为路径与时空行为网络之间的转换关系,利用复杂网络社群发现算法对时空行为轨迹进行社群聚类、模式挖掘与可视化。基于北京郊区居民一周内活动出行GPS轨迹数据的案例分析发现:① 复杂网络分析方法可以有效挖掘具有相似行为的群体特征和识别出典型的行为模式。② 可以灵活处理多元异构与多维度的行为轨迹大数据以及满足不同叙事、不同空间相互作用、不同时序的应用需求。③ 北京郊区被调查居民的行为模式存在日间差异与空间分异。
Pattern mining of spatio-temporal behavior trajectories by complex network analysis
[J].The big data of spatio-temporal behavior trajectory have multiple complex characteristics, such as sequential properties, spatio-temporal interaction, and multidimensionality. Facing these complexities, this paper explores a new pattern mining method of spatio-temporal behavior trajectories to provide a more flexible approach to pattern mining, particularly for the trajectory big datasets. This paper explores a new spatio-temporal behavior pattern mining method by three steps. First, based on Social Affiliation theory, we develop a conversion method from space-time paths to spatio-temporal networks by individuals, by incorporating the analytical framework of time geography and complex network. The temporal and spatial attributes of activities are saved in the spatio-temporal networks. Second, this study uses the Louvain Method to detect communities, that is, the clustering trajectories or behavior patterns in a behavioral network. This community-detection method is widely used in the field of network science, particularly for handling a large set network data. Third, relying on the visualization techniques from time geography, this study integrates the advantages of 2-dimentional and 3-dimentional charts to analyze and display the characteristics of spatio-temporal behavior patterns based on multiple perspectives. By mining similar or cohesive communities, this study further explores the characteristics of spatial heterogeneities in behavioral patterns and their day-to-day variabilities. By adopting a weekly-long trajectory data from a GPS-based individual activity-travel survey in 2012 Beijing, this study reveals three major findings. First, complex network analysis can effectively extract grouping patterns with similar behaviors, along with identifying representative behavior patterns from messy trajectories. Besides, the new approach provides a new perspective for further exploring the spatio-temporal interaction of human activities in time geography and social geography. It has the capacity to flexibly handle heterogeneous and multidimensional behavior trajectories and detect patterns from trajectory big data by varying narratives of activity-travel events, spatial interaction levels, and lengths of time series or sequences. Second, in the case study, considering the time allocation characteristics and sequence of activities, activity and sequence narrative are selected for analysis, and 6 major behavior patterns based on similarity mining are analyzed and compared. Results show that the residents have a typical behavior pattern in which they worked from 9 AM to 7 PM after sleeping on weekdays, and then conducted leisure, entertainment, housework and private affairs before 9 PM. Third, this study extends the complex network method to behavior pattern mining with multi-day spatio-temporal data. The effect of spatial interaction was considered when measuring the individual connections, and the spatial distribution characteristics of community were compared by adjusting the distance attenuation factor. This finding suggests significant spatial heterogeneities in behavioral patterns of surveyed residents in the suburb of Beijing. The residents also have significant day-to-day variabilities in spatio-temporal behavior patterns, mainly between weekday and weekend as well as between Saturday and Sunday.
Detecting and visualizing cohesive activity-travel patterns: A network analysis approach
[J].
多灾种时空耦合网络构建:从多维网到单顶点网
[J].
DOI:10.11821/dlyj020200894
[本文引用: 1]
基于1970—2017年秦岭南北72个站点气象数据,以“地理时空分析-小波相干分析-时空耦合网络”为方法框架,对秦岭南北干旱-热浪时空耦合特征进行分析;进而以干旱-热浪时空耦合网络为基础,完善时空网络连边规则,拓展单顶点网分析方法,再认识多灾种时空耦合的群聚群发效应。结果表明:① 全球变暖背景下,秦岭南北降水模态逐渐由20世纪80年代雨涝主导向干旱主导转变,同时热浪在2010年前后经历第2个谷值期后快速增加,加剧了区域干旱-热浪耦合风险。② 秦岭南北干旱-热浪变化具有同步性,但是不同时段显著周期存在差异。其中,在20世纪70—80年代初,秦岭南北干旱-热浪4~8 a周期同步减弱,并向低频2~4 a周期转变;后期同步耦合增强时段有2个,分别是1995—2002和2012—2017年。在空间格局上,秦岭以北和汉江谷地为秦岭南北干旱-热浪耦合影响关键区域,而丹江口水库附近、嘉陵江流域、秦岭南坡中段为干旱-热浪耦合波动区。③ 在研究方法上,地理时空分析为秦岭南北干旱-热浪时空耦合提供基本事实判断,小波相干可定量干旱-热浪多时间尺度耦合关系,多灾种时空耦合网络可解释多灾种“平静-爆发”现象,识别干旱-热浪耦合稳定区和波动区,三种方法相辅相成,初步形成面向多灾种时空耦合分析方法体系。
Spatiotemporal network modeling of multi-hazard: From bipartite to single point network
[J].Modeling the processes of multi-hazard interaction could provide a pathway for a better understanding of the question how to identify and characterize the interaction of natural hazards and what is the possible cumulative or amplification effect where a hazard triggered or combined secondary hazards, which would help scientists to understand multi-hazard cause even damage to the social-ecological system. Based on the daily observations of 72 meteorological stations released by the National Meteorological Information Center of China, this study focuses on the spatiotemporal variation in concurrences of droughts and heat waves in the south and north of Qinling Mountains region for the period of 1960-2016 by using geographical analysis, wavelet conference, complex networks and other statistical techniques. Specifically, we finished the prospective transform from bipartite to single-point network and the modification in the spatiotemporal network rules for multi-hazards, which enriched the traditional research paradigm to investigate changes in concurrent of multi-hazards under the global warming. The results showed that: (1) The wet-dry pattern in the south and north of Qinling Mountains region has switched from the dominant flooding in the 1980s to continuous droughts. Meanwhile, the increasing shift of heat waves occurred after the depression or hiatus process during 1998-2010. Severe droughts and heat waves concurrences have become frequent and higher risk of multi-hazards have increased more than single hazard in recent years. (2) Investigation reveals there is synchronous variation between the concurrent droughts and heat waves, and the relationship shows different periodicity in different periods between 1970 and 2017. A statistically significant high-power region is evidently found from the 1970s to the 1980s at the shortest timescales, i.e. 4-8 years, with droughts and heat waves decreasing simultaneously, and then the weaker correlation is observed until the early 1990s. High-power regions are also observed during 1995-2002 and 2012-2017 from quasi-decadal to the interannual timescales, i.e. 2-4 years, which show a substantial increase in concurrent droughts and heatwaves across the study region. (3) Spatially, Guanzhong basin and Hanjiang river basin are two specific regions prone to concurrent of droughts and heat waves, while the cold spots of multi-hazard are observed in the Jialing river basin, the middle part of south piedmont of Qinling Mountains and the region near Danjiangkou reservoir. (4) Here, the multi-hazard approaches framework is provided to analyse the effects of concurrent and compound extremes. In particular, spatiotemporal analysis can be used to understand the background of multi-hazard and provide some basic evidences about the interaction of natural hazards. To quantify the presence of scale-dependency in the relationship of droughts and heat waves, wavelet coherence is used from a nonstationary perspective. Finally, the spatiotemporal network for multi-hazard could explain the ‘burst’ phenomena of multi-hazard, i.e. the spatiotemporal distribution of concurrent droughts and heat waves is best described by power lows, which are neither regular nor completely random.
Designing for networked community resilience
[J].
面向突发事件的粮食铁水联运网络抗毁性研究
[J].
Study on the invulnerability of rail-water intermodal transportation network of grain for emergencies
[J].
基于遗传算法的应急物流设施选址与调度
[J].
Location and scheduling of emergency logistics facilities based on genetic algorithm
[J].
Reimagining global food value chains through effective resilience to COVID-19 shocks and similar future events: A dynamic capability perspective
[J].The restructuring of global value/supply chains gained increasing attention as the unprecedented COVID-19 echoed around the world. Yet, the COVID-19 related theory-driven, large scale quantitative, and empirical studies are relatively scarce. This study advances the extant literature by empirically investigating how do firms in the global food value chains (GFVCs) re-imagine their businesses structure in response to the COVID-19-becoming more resilient and competitive to the current pandemic and similar future events. We leverage a unique data of 231 senior managers of the Australian GFVCs and examine their firms' response strategies. Drawing upon key insights from the dynamic capability view, we find that GFVCs' competitiveness is achieved when exposure to COVID-19 shocks elicits dynamic capabilities-readiness, response, recovery-and these capabilities work jointly and sequentially to cultivate resilience. A key finding of this study is that firms with domestic plus global value chain partners are more resilient than those having only global business partners. This finding implies that excessive reliance on offshoring sometimes becomes lethal, especially amid unexpected and prolonged global shocks and, therefore, companies should strike a balance between domestic and global business partners to remain competitive. These findings offer important contributions to theory, practice, and UN sustainable development goals.© 2021 The Authors. Published by Elsevier Inc.
Including quality in Social network analysis to foster dialogue in urban resilience and adaptation policies
[J].
Robustness of assembly supply chain networks by considering risk propagation and cascading failure
[J].
Nonlinear model of cascade failure in weighted complex networks considering overloaded edges
[J].Considering the elasticity of the real networks, the components in the network have a redundant capacity against the load, such as power grids, traffic networks and so on. Moreover, the interaction strength between nodes is often different. This paper proposes a novel nonlinear model of cascade failure in weighted complex networks considering overloaded edges to describe the redundant capacity for edges and capture the interaction strength of nodes. We fill this gap by studying a nonlinear weighted model of cascade failure with overloaded edges over synthetic and real weighted networks. The cascading failure model is constructed for the first time according to the overload coefficient, capacity parameter, weight coefficient, and distribution coefficient. Then through theoretical analysis, the conditions for stopping failure cascades are obtained, and the analysis shows the superiority of the constructed model. Finally, the cascading invulnerability is simulated in several typical network models and the US power grid. The results show that the model is a feasible and reasonable change of weight parameters, capacity coefficient, distribution coefficient, and overload coefficient can significantly improve the destructiveness of complex networks against cascade failure. Our methodology provides an efficacious reference for the control and prevention of cascading failures in many real networks.
适灾韧性理念下的社区灾害脆弱性实证研究
[J].
A positive study on disaster vulnerability of urban community based on disaster resilience theory
[J].
Invulnerability analysis and optimization strategy of sector network using cascading failure model
[J].
考虑节点过载的复杂网络级联失效模型
[J].
Cascading failure model of complex networks considering overloaded nodes
[J].In order to discuss redundant capacity of nodes against load, this paper proposes a cascading failure model of complex networks considering overloaded nodes. Firstly, the cascading failure model is constructed according to the overloaded coefficient, failure probability and residual coefficient. Then, based on the characteristics of nodes, the load distribution strategies of the overloaded nodes are proposed. Finally, under cascading failure, invulnerability is simulated in BA scalefree network. The results show that in the load distribution strategies of the overloaded nodes, the mixed distribution strategy is better on the whole, which can significantly control cascading failure and increase the invulnerability; to a certain extent, raising the overloaded coefficient and distribution coefficient is helpful to reduce the impact of cascading failure, while this is not effective when both are large; and the invulnerability gets enhanced, when the residual coefficient is a certain value.
Risk and resilience: Strategies for security
[J].
Community detection in action: Identification of critical elements in infrastructure networks
[J].
基于疫情分析的上海社区韧性影响因素研究
[J].
Research on the influencing factors of community resilience in Shanghai based on analysis of the pandemic situation
[J].
面向日常活动与环境供需矛盾的城市韧性综合评估及空间特征研究——以南京为例
[J].
DOI:10.11821/dlyj020211186
[本文引用: 1]
随着环境变化加剧、技术进步扩散、城市化生活转向等因素的交织叠加,日常活动空间的供需过程需要并可以更具韧性,但既有研究鲜有涉及。因而,聚焦中国社会经济发展主要矛盾,挖掘面向城市居民日常活动与环境供需矛盾的城市韧性内涵,建构有机整合的理论框架和评估指标体系,并以南京市中心城区为例,依托地理大数据支撑,进行日常活动-环境系统的韧性评估及空间特征研究。主要结论:① 韧性要素在活动与环境间以及数量与质量之间的供需结构失调,且供需不均衡和不充足的问题同时存在并相互制约。② 活动韧性、环境韧性各自的空间分异显著且供需水平及相互匹配程度较低,导致系统韧性呈现低水平蔓延的空间形态。③ 活动韧性、环境韧性及系统韧性之间的空间支撑或匹配作用没有充分发挥,导致日常活动空间的供需关系分异较大且缺少连续良性的空间互动。基于此,应根据韧性演进阶段,促进日常活动空间供需网络的整体动态协同优化。
Comprehensive evaluation and spatial characteristics of urban resilience under the scenario of supply-demand contradictions between daily activities and the environment: A case study of Nanjing City
[J].With the interaction of environmental changes, technological progress, and urbanized life, the supply-demand process of daily activity space needs and can be more resilient, but the existing study is rarely involved. Therefore, this study focuses on the main contradiction of China's social and economic development, excavates the connotation of urban resilience under the scenario of supply-demand contradictions between daily activities and the environment, and then constructs an organically integrated theoretical framework and evaluation index system of urban resilience. Finally, taking the central urban area of Nanjing as an example, and relying on the support of geographical big data, the comprehensive evaluation on spatial characteristics of daily activity-environment system resilience is carried out. The main conclusions are as follows: (1) The structure of supply and demand of resilience factors between activities and environment as well as between quantity and quality is out of balance, and the imbalance and insufficiency of supply and demand exist simultaneously and restrict each other. (2) The spatial distribution of activity resilience and environmental resilience is significantly different, and the level of their supply and demand is low, as well as the degree of their mutual matching, which resulted in a spatial pattern of low-level spread of daily activity-environment system resilience. (3) The spatial support or matching role among activity resilience, environmental resilience, and system resilience has not been fully exerted, leading to serious differentiation of supply and demand of daily activity space, and lack of continuous benign interaction in spatial distribution. Therefore, the overall dynamic synergistic optimization of the supply and demand network of daily activity space should be promoted according to the evolution stage of resilience. In short, for urban resilience research, this paper has some reference value for the expansion of cross-fields, the integration of theoretical frameworks, the optimization of evaluation methods, and the implementation of governance concepts.
山洪视角下社区韧性影响因素及其定量分析
[J].
DOI:10.18306/dlkxjz.2022.03.006
[本文引用: 1]
山洪灾害具有广泛性、突发性、破坏性等特征,开展山洪易发区的社区韧性评估,从而提高灾害应对能力是当前防灾减灾的前沿热点和难点。论文提出了一套多学科的综合方法:① 利用中介效应明晰了山洪视角下社区韧性评价体系各指标间的定量化传递关系;② 构建了基于决策实验室分析和解释结构模型的耦合数学模型,确定社区韧性影响因素的多级递阶解释结构模型,分析社区韧性的差异化影响因素;③ 采用信息扩散方法,定量分析山洪灾害社区韧性的变化趋势并排序。以粤北山洪易发区为例,从城镇、村落、城乡结合部3种类型社区进行灾害韧性分析。结果表明:山洪视角下的社区韧性指标体系是一个多维度多层次的复杂网络系统,包括环境、社会、心理、制度和信息沟通5个方面;不同类型社区灾害韧性的直接影响因素呈差异化特征,而供排水设施建设和洪灾应急演练为社区韧性的根本影响因素,对增强山洪视角下社区韧性发挥本质性作用;由于调研村落多位于山洪频发区,居民防范灾害、减轻灾害影响的意识较强,村落较城镇和城乡结合社区呈现出更高的韧性。研究可为提升粤北山洪易发区社区韧性及社区防灾减灾能力提供科学参考,该综合分析方法亦可为其他类型灾害的精细化防灾减灾提供支持。
Influencing factors and quantitative analysis of community resilience to flash floods
[J].Based on the characteristics of flash floods such as extensiveness, abruptness, and destructiveness, the current focus of disaster prevention and mitigation is to assess the resilience of communities in regions with frequent flash flood disasters, so as to enhance the disaster response level. This study proposed a set of multidisciplinary integrated methods: 1) The quantitative transmission relationship among the indicators of the community resilience evaluation system under the impact of flash floods was clarified by examining the mediating effect. 2) The coupling decision mathematical model of the decision laboratory model and the interpretive structure model was established, the multilevel interpretive structure model of the influencing factors of community resilience was constructed, and then the differential influencing factors of community resilience were analyzed. 3) Information diffusion method was used to quantitatively analyze and rank the community resilience of flash flood disasters. Taking the flood-prone areas in northern Guangdong Province as the research area, this study analyzed three types of communities—that is, towns, villages, and peri-urban areas, and the results show that the community resilience indicator system from the perspective of flash flood impact is a multi-dimensional and multi-layered complex network system, including five aspects: environmental, social, psychological, institutional, and communication. The direct influencing factors of community resilience to different types of disasters are different. The construction of water supply and drainage facilities and flood emergency drills, as the fundamental influencing factors of community resilience, play an essential role in enhancing community resilience to flash floods. Since most of the surveyed villages are located in areas with frequent flash floods, residents have a high awareness of disaster prevention and mitigation and the villages show higher community resilience than the sample towns and peri-urban areas. The study can provide an important reference for improving the resilience of communities in the flood-prone areas in northern Guangdong and their disaster prevention and mitigation capabilities. This comprehensive analysis method can also provide strategic support to the refinement of disaster prevention and mitigation of other types of disasters.
