

1 引言
特别地,大数据和人工智能技术在监测、解释和评估城市的可持续发展进程中正发挥着重要作 用[6]。相较于通过问卷调查和走访以获取城市地区现状和发展轨迹的传统方法,越来越多的工作开始借助非传统的城市数据源如移动电话数据、卫星图像数据和市民活动产生的数据进行城市可持续发展研究[7]。例如,Aiken等[8]利用LightGBM[9]根据移动电话数据推断家庭收入进行资源分配,Abitbol等[10]和Rolf等[11]利用卷积神经网络[12]抽取卫星图像特征,推断城市不同地区的经济发展水平,进一步地,Liu等[13]提出KnowCL模型,引入基于卫星图像和街景图象的对比学习,在社会经济指标预测任务上达到当前最优水平。此外,Chen等[14]利用共享单车和出租车轨迹数据识别城中村边界,以及Zheng等[15]基于交通流量数据设计强化学习框架[16]进行交通信号灯控制以减少城市道路交通拥堵。由此可见,海量多源异构城市数据为城市可持续发展研究带来了良好的发展机遇,但与此同时,当前数据驱动的城市可持续发展研究仍存在较大的局限性——大多数工作往往侧重一种类型城市数据或某一具体问题,缺少对不同城市数据源、不同城市元素之间内在关联的考虑,难以实现在城市可持续发展的多场景泛化应用。以推断城市不同地区的经济发展水平为例,现有工作[10-11]仅考虑了卫星图像所反映的街区俯视环境,忽略了街区之间在交通流量方面的转移模式、在城市功能方面的相似性以及空间邻近街区的辐射影响等因素[13],导致推断结果的准确性有待商榷,难以直接用于城市可持续发展进程的监测。此外,在实际场景中政府和相关机构往往需要了解地区在人口、收入水平、教育水平和空间环境等多方面的可持续发展情况,现有工作仅针对某一方面考虑,在灵活性和实用性上有待提升。因此,如何实现对海量多源异构城市数据的有效组织融合,进而支撑多方面、多场景的应用,成为了当前数据驱动的城市可持续发展研究亟待解决的问题。
与此同时,近期通过知识图谱组织融合数据的解决方案在针对以城市为典型场景的时空应用中受到了较多关注[17-18],为知识图谱驱动的城市可持续发展提供了重要参考价值。知识图谱是由谷歌公司于2012年提出的概念[17],是当前知识工程中最先进的技术,通过有向图的方式对概念和事物及其相互之间的语义关联进行结构化组织,是一种可为计算机理解和利用的语义网络,其中节点代表概念/实体,边代表实体之间的相互关联/语义关系[19]。特别地,当前知识图谱驱动的城市应用研究首先根据场景需求确定包含的实体和关系类型,构建相应知识图谱,进而将知识图谱作为输入建立深度学习模型或进行逻辑查询执行相应任务。其中,以深度学习为基础的工作往往通过不同神经网络结构学习知识图谱上实体和关系的表征向量,将其输入到任务相关的模块进行预测。例如,Wang等[20]构建描述城市里兴趣点(Point of Interest, POI)、POI类别以及街区之间空间关联的空间知识图谱,通过平移距离模型学习实体表征,并结合强化学习框架以推断移动用户的画像信息。Wang等[21]构建描述用户、POI、POI类别以及时间单元之间时空关联的时空城市知识图谱,并建立基于张量分解的深度学习模型,根据用户和POI之间的访问关系,预测用户的移动轨迹。Liu等[22]根据城市街区之间的流量转移构建知识图谱,将街区和街区间流量分别作为知识图谱上的实体和关系,建立基于卷积神经网络的自编码器模型,预测街区间的流量变化。此外,以逻辑查询为基础的工作往往针对知识图谱上特定的实体调用数据库工具执行对应功能的逻辑查询命令。例如,王晓爽等[23]提出了基于时空特征的大气污染执法事件知识图谱,将大气污染相关的知识建模为图谱上的实体和关系,并通过逻辑查询的方式从给定案件出发,对大气污染执法进行案件溯源。高嘉良等[24]构建了以旅游景点、游客、城市为核心的旅游知识图谱,根据不同类型实体之间的关联关系,分析游客行为与市场需求,为旅游目的地可持续发展规划提供决策支持。综上所述,一方面,现有研究在多个任务上的尝试表明了知识图谱在城市应用方面的可行性和有效性,并提供了从构建到应用的典型研究框架参考;另一方面,当前研究所构建的知识图谱往往从少量的城市数据源出发,针对单一场景和任务定制,仅包含少量城市实体和语义关系,难以驱动涵盖社会、经济和生态等多方面多场景的城市可持续发展研究。因此,知识图谱驱动的城市可持续发展仍存在诸多机遇与挑战。
为此,本文开展面向城市可持续发展的知识图谱构建及应用框架的研究与实践,重点关注社会经济领域的城市可持续发展,贡献如下: ① 提出了一种系统的城市商圈/街区知识图谱构建方法,抽象出城市可持续发展所关注的人、地、组织、商圈和街区等实体类型,并定义实体属性及实体间的关系,完成城市商圈/街区知识图谱本体构建,在本体指导下从海量多源异构城市数据中构建城市商圈/街区知识图谱;② 围绕城市商圈/街区知识图谱驱动的城市可持续发展应用,从城市可持续发展进程的状态监测、现象解释和决策评估3个方面开展讨论,并选取典型场景进行应用验证。
2 城市商圈/街区知识图谱驱动的城市可持续发展研究框架
2.1 城市商圈/街区知识图谱概念与特征
式中:
2.2 研究框架
图1展示了城市商圈/街区知识图谱驱动的城市可持续发展研究框架。研究首先基于海量多源异构城市数据构建城市商圈/街区知识图谱,进而将其作为知识源,支撑围绕街区、商圈等城市要素的城市可持续发展应用。
图1
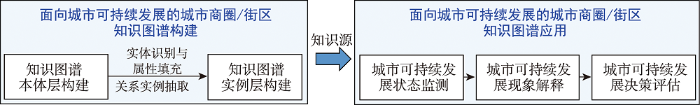
图1
城市商圈/街区知识图谱驱动的城市可持续发展研究框架
Fig. 1
The framework of urban business area/region knowledge graph for urban sustainability
具体而言,面向城市可持续发展的城市商圈/街区知识图谱构建细分为本体层构建和实例层构建 2个阶段:
(2)实例层构建:实例层构建是在城市商圈/街区知识图谱本体的指导约束下,从海量多源异构城市数据中提取具体的实体及其属性和关系,对本体定义的相关概念进行实例化。特别地,城市商圈/街区知识图谱本体明确了知识图谱中的实体类型、关系类型和实体属性类型等信息,例如,确定包含“人”类实体,指出其具有“性别”、“年龄”等属性类型;城市商圈/街区知识图谱则是具体化的实体、实体属性内容及实体间关系,例如,实体“小明”及其属性信息是“性别:男,年龄:24”等。
进一步地,面向城市可持续发展的城市商圈/街区知识图谱应用则包括状态监测、现象解释和决策评估3个阶段:
(1)城市可持续发展状态监测:及时准确地获取细粒度的城市状态数据,如城市人口、用地类型占比、社区健康状况、绿化率和碳排放等社会、经济和生态相关指标信息,能够为城市可持续发展提供有效感知,实现状态监测,具有重要实用价值。特别地,长时间、多尺度和多指标的城市状态监测能够为城市可持续发展过程中的现象解释和决策评估提供信息输入。现有研究往往通过单一的数据源如遥感图像[39⇓-41]等进行表征学习,在此基础上训练回归模型或分类模型推断城市相关指标值,面临着信息建模不全面和模型迁移能力差等问题。相较而言,城市商圈/街区知识图谱中融合了城市多源异构数据,将通用的语义关联建模为实体间的关系,为城市状态监测提供了新的机遇。一方面,可以利用城市商圈/街区知识图谱上的逻辑关系路径和局部子图结构,将不同层面的信息进行聚合,从而丰富每个实体的表征,实现更有效的指标推断;另一方面,城市商圈/街区知识图谱作为知识源,具有较好的鲁棒性,其蕴含的城市知识可以较好地注入到传统仅依靠单一数据源的指标推断模型中,提升推断的准确性。此外,基于城市商圈/街区知识图谱的迁移学习和小样本学习方法亦具有较大的应用价值,能够促进城市商圈/街区知识图谱驱动的城市可持续发展状态监测。
(2)城市可持续发展现象解释:城市可持续发展过程中产生了诸多问题和现象亟待理解和解决。例如,在我国城市和农村之间形成的过渡区域城乡结合部、在大城市如深圳、香港所产生的城中村以及在拉美国家大城市形成的贫民窟。理解和探寻产生这些现象的原因,将极大地推动城市可持续发展。特比第,针对城市可持续发展过程中产生的问题和现象,城市商圈/街区知识图谱所形成的多模态知识将具有较大研究价值。例如,城市商圈/街区知识图谱中的遥感图像和街景图像能够对局部城市环境提供视觉理解,而由路网划分识别的“街区”类实体则包含了道路信息,“地点”类实体构成的局部子图描述了街区附近的功能区分布,结合上述信息可以通过城市商圈/街区知识图谱对城中村、贫民窟等现象进行多模态、多尺度的理解和归因。此外,传统知识图谱研究中通过语义关系间的逻辑约束进行推理的范式可以借鉴到城市商圈/街区知识图谱驱动的城市可持续发展现象解释中,建立城市语义关系间的逻辑约束,通过城市商圈/街区知识图谱上的模式匹配等手段进行解释。
(3)城市可持续发展策略评估:基于上述的状态监测和现象解释,城市商圈/街区知识图谱驱动的城市可持续发展的最终目标是协助进行政策制定和效果评估,即通过输入信息和约束将政策制定转化为城市商圈/街区知识图谱上的相关任务进行决策,并通过历史数据拟合或构建模拟环境对决策效果进行评估,确定是否适用于实际场景,促进城市可持续发展。特别地,潜在的研究方向包括且不限于:在城市的社会可持续发展方面,通过城市商圈/街区知识图谱对“人”类实体的关联建模,可以挖掘个体的线上线下行为意图,从而支持对政府政策施行的社会域认知评估;在城市的经济可持续发展方面,通过城市商圈/街区知识图谱对“地点”类实体和空间知识的建模,为城市规划提供仿真环境,可引入强化学习等人工智能技术完成用地类型比例分配和基础设施选址等决策任务,并对规划效果进行评估;在城市的生态可持续发展方面,通过城市商圈/街区知识图谱中的城市图像信息,可有效反映城市绿化分布,并结合“人”类实体的访问关联知识,确定市民出行需求,从而依托城市商圈/街区知识图谱输出更有效的城市环境改造策略。由此可见,城市商圈/街区知识图谱为城市可持续发展决策评估提供了新的解决思路。
表1总结了城市商圈/街区知识图谱在社会、经济和生态等方面的城市可持续发展应用。
表1 城市商圈/街区知识图谱驱动的城市可持续发展应用概览
Tab. 1
| 应用概览 | 社会方面 | 经济方面 | 生态方面 |
|---|---|---|---|
| 节点级别 | 个体就业/学历/健康监测、 区域人口/就业监测、 …… | 个体收入情况监测、 店铺营收情况监测、 区域经济监测与解释、 …… | 区域绿化监测与解释、 区域韧性监测与评估、 …… |
| 子图级别 | 城中村识别与解释 …… | 功能区产业结构监测、 行政区经济水平监测、 …… | 碳排放监测与评估、 用地规划与评估、 …… |
具体而言,从城市商圈/街区知识图谱的结构出发,可将城市可持续发展应用划分为节点级别和子图级别的应用:
(1)节点级别应用:节点级别应用关注城市商圈/街区知识图谱中的每个实体,围绕城市关键元素,可对个体和街区的多种社会经济指标进行监测和解释。例如监测个体的就业和健康情况,街区的人口和经济活跃度等。在实际应用中,将个体和街区映射为城市商圈/街区知识图谱上的“人”类实体和“街区”类实体,通过知识图谱表示学习获取相应实体的表征向量,将上述监测和解释应用转化为城市商圈/街区知识图谱的实体表征分类和回归任务。此外,在生态方面,可利用城市商圈/街区知识图谱的图结构将遥感图像和街景图像等多模态信息融合,对街区的绿化程度和韧性进行监测与解释。
(2)子图级别应用:子图级别应用关注城市商圈/街区知识图谱的局部子图所构成的特定场景应用。例如,在城市商圈/街区知识图谱上根据“街区”类实体的连接关系和遥感图像等识别城中村,确定哪些“街区”类实体构成的子图对应真实城市环境中的城中村;在城市商圈/街区知识图谱上根据“商圈”类实体和“地点”类实体的连接关系和属性信息,监测城市不同功能区的产业结构;在城市商圈/街区知识图谱上根据“街区”类实体的连接关系和用地属性等进行用地规划和效果评估。类似于节点级别应用,子图级别应用通过学习城市商圈/街区知识图谱上的子图表征向量,结合具体下游任务模型实现多种类型城市可持续发展指标的监测、解释和评估。
3 城市商圈/街区知识图谱驱动的城市可持续发展实证分析
本节基于第2节提出的城市商圈/街区知识图谱驱动的城市可持续发展研究框架,进行实证分析,介绍所构建的城市商圈/街区知识图谱以及具体的应用验证。
3.1 城市商圈/街区知识图谱构建
3.1.1 本体层构建
(1)实体类型与属性构建:基于自顶向下的构建思路,本文参考城市可持续发展研究中的核心概念,从海量多源异构城市数据中抽象出6种实体类型及其具有的属性:
“人”实体类型与属性:人,又称为用户,是城市里的主要活动对象。需要注意的是,本文中主要指城市中的人类,而在充分数据支撑下,更广义的城市商圈/街区知识图谱中“人”实体类型可以扩展为人类、汽车类、单车类等事物类对象。为充分刻画城市中每个个体,进一步为此类型实体增加画像属性信息,包括性别、年龄、收入、学历和职业等。
“地点”实体类型与属性:地点描述城市中的基本功能单元和场所,如学校、医院、商场、交通枢纽等,是城市中人们进行社会生产生活发生的细粒度场所。为充分刻画城市中每个地点,进一步为此类型实体增加属性信息,包括名称、地址、经纬度坐标和类别信息等。
“组织”实体类型与属性:组织描述城市中承担不同作用或因共同目标结合而成的集体和系统,例如各种行政机构、商业集团品牌和社会团体等,是社会运转的基础。为充分刻画城市中每个组织,进一步为此类型实体增加属性信息,包括名称、类别、下辖实体(办公场所、门店等物理实体)数量以及组织文本描述信息等。
“街区”实体类型与属性:街区是相对地点对城市空间的一种更粗粒度划分,常见于行政区划分、路网划分和网格划分等,在研究群体层面的城市可持续发展中具有实际意义,旨在反映城市空间上的结构以及城市中人们进行社会生产生活的区位选择。本文从城市可持续发展强调的社会、经济和生态3个方面对此类实体进行属性增强。在社会方面,增添街区的人口密度、平均教育和收入水平、犯罪率等信息;在经济方面,增添刻画街区经济活跃度的指标,如公司企业数量和餐馆数量等;在生态方面,为对街区的环境和绿化有更深入了解,增添了街区对应的俯视遥感图像和街区内部采集的街景图象。此外,还包括了街区边界范围和面积等基本信息。
“商圈”实体类型与属性:考虑到经济是城市可持续发展的重要动力,本文将描述城市范围内经济和社会活动等行为聚簇形成的空间作为一类实体,即“商圈”类实体,侧重城市中人们进行社会生产生活过程中形成的但不具有明确物理边界的空间。该类实体具有的属性包括商圈名称、中心经纬度坐标等。
“类别”实体类型与属性:城市中的地点和组织往往被划分为不同类别,以描述其功能信息,即“类别”类实体。结合专家知识,本文将该类型细分为粗粒度类别、中粒度类别和细粒度类别3个层次,通过不同粒度来区分类别语义信息。该类实体具有的属性包括名称和文本描述信息等。
(2)关系类型定义:围绕上述定义的6类实体,根据建模的知识方面可将城市商圈/街区知识图谱中实体间的关系分为空间知识相关、从属知识相关、语义知识相关和关联知识相关等。
空间知识相关的关系建模城市元素之间在空间上的位置、位属知识,包括:
“位于”关系:描述“地点”类实体和“街区”类实体的空间位属关系,表示地点在街区边界范围内。例如,清华大学——位于——清华园街区。对于位于街区边界的“地点”类实体,将其匹配到最近距离的街区。
“归属”关系:描述“地点”类实体和“商圈”类实体的空间位属关系,表示地点在商圈的辐射范围内。例如,东源大厦——归属——五道口商圈。
“街区交界”关系:描述“街区”类实体间的边界相邻关系,表示交界的街区。
“街区邻近”关系:描述“街区”类实体间的距离邻近关系,表示2个街区的欧式空间距离在某一阈值内。例如,蓝旗营街区——街区邻近——清华园街区。
“服务辐射”关系:描述“商圈”类实体和“街区”类实体的服务依赖关系,将“商圈”类实体与在其服务辐射范围内的“街区”类实体在城市商圈/街区知识图谱中关联。例如,五道口商圈——服务辐射——清华园街区。
从属知识相关的关系建模城市元素之间在认知层面的隶属和匹配知识,包括:
“隶属组织”关系:描述“地点”类实体和“组织”类实体的隶属关系。例如,清华园派出所——隶属组织——海淀区政府。
“地点所属类别”关系:描述“地点”类实体和“类别”类实体的属性关联。依据类别的层次可细分为“地点所属类别(粗)”、“地点所属类别(中)”和“地点所属类别(细)” 3种。例如,清华大学——地点所属类别(粗)——教育。
“组织所属类别”关系:描述“组织”类实体和“类别”类实体的属性关联。类似地,依据类别的层次可细分为“组织所属类别(粗)”、“组织所属类别(中)”和“组织所属类别(细)” 3种。例如,肯德基——组织所属类别(粗)——餐饮。
“类别从属”关系:描述不同层次的“类别”类实体具有上下位的层次关系。例如,北京菜——类别从属——中餐、中餐——类别从属——餐饮。
行为知识相关的关系建模人与其他城市元素之间在行为层面的关联知识,包括:
“居住地位于”关系:描述个体居住地信息,将“人”类实体和其对应居住地所在的“街区”类实体在城市商圈/街区知识图谱中关联。
“工作地位于”关系:描述个体工作地信息,将“人”类实体和其对应工作地所在的“街区”类实体在城市商圈/街区知识图谱中关联。
“访问”关系:描述个体的地点访问行为,将“人”类实体和其交互访问过的“地点”类实体在城市商圈/街区知识图谱中关联。
关联知识相关的关系建模城市元素之间除上述关系外的相关知识,包括:
“街区流量转移”关系:描述“街区”类实体间的(人)流量转移模式,将转移流量超过一定阈值的“街区”类实体在城市商圈/街区知识图谱中关联。
“街区功能相似”关系:描述“街区”类实体间的功能相似性,依据街区的地点类型分布,确定具有相似分布的“街区”类实体具备相似功能,在城市商圈/街区知识图谱中关联。
“相关组织”关系:描述“组织”类实体间在社会认知层面的相关性,隐含了组织间的复杂关联。例如,肯德基——相关组织——麦当劳。
“竞争”关系:描述“地点”类实体间在经济属性和空间位置上呈现的竞争关系,将存在局部竞争的两个“地点”类实体在城市商圈/街区知识图谱中关联。例如,肯德基(东源大厦店)——竞争——麦当劳(五道口店)。
“共现”关系:描述“地点”类实体间在群体访问行为中呈现的相互关联,隐含了“地点”类实体之间的互补性和相关性。例如,游客连续打卡的两个景点对应的“地点”类实体。
“部署于”关系:描述“组织”类实体在特定“街区”类实体对应范围内部署门店/下辖机构的信息,将“组织”类实体与对应“街区”类实体在城市商圈/街区知识图谱中关联。例如,肯德基——部署于——清华园街区。
基于上述实体类型与属性构建以及关系类型定义,实现了城市商圈/街区知识图谱的本体构建,如图2所示。其中,图中节点表示实体类型,边表示关系类型。此外,在足够数据和业务需求支撑下,可以对城市商圈/街区知识图谱的概念层建模进行修改完善。例如,将政区、交通和管线等其他社会实体以及活动或事件类实体引入到城市商圈/街区知识图谱的构建中。
图2
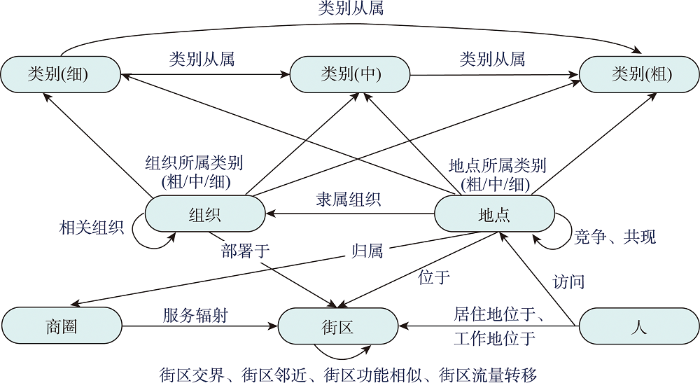
图2
城市商圈/街区知识图谱本体
Fig. 2
The ontology of urban business area/region knowledge graph
3.1.2 实例层构建
基于本体层构建提出的城市商圈/街区知识图谱本体,本文从海量多源异构城市数据中自动识别对应实体及属性值,并抽取实体间的关系,将实体和关系结合完成实例层构建:
(1)实体识别与属性填充:实体识别是指根据知识图谱本体定义的实体类型进行实例化,从数据中识别出具体的实体,而属性填充则是丰富实体的属性信息。对应于城市商圈/街区知识图谱构建,下面介绍依据城市商圈/街区知识图谱本体,对每种类型实体进行识别和属性填充的过程。
“人”类实体:基于不同平台和数据源采集的匿名用户数据,例如基站记录的移动用户轨迹数据、应用程序记录的用户签到数据等,将匿名用户匹配为城市商圈/街区知识图谱中的“人”类实体,并根据用户画像数据填充相应实体的年龄、收入、学历和职业等属性信息。
“地点”类实体:基于POI等地图数据,对脏数据、无意义数据进行过滤清洗,将基础设施、建筑物等匹配为“地点”类实体,并填充名称、地址、经纬度坐标和类别等属性信息。
“组织”类实体:基于“地点”类实体的名称属性和城市文本数据,利用字符串匹配和命名体识别等方法识别出“组织”类实体,根据文本数据填充相应实体的名称、类别和文本描述等属性信息。
“街区”类实体:基于路网数据对城市空间进行划分,将每段闭合的不规则几何区域匹配为一个“街区”类实体,并根据街区边界计算相应实体的面积,结合开放空间人口统计信息数据①(①
“商圈”类实体:基于生活服务平台爬取数据识别城市的商圈信息,匹配“商圈”类实体,填充商圈名称和中心经纬度坐标等属性信息。
“类别”类实体:基于专家知识划分的类别体系,匹配“类别”类实体,填充名称和文本描述等属性信息。
(2)关系实例抽取:关系实例抽取,又称关系抽取,是指根据知识图谱本体定义的关系类型和识别出的实体,将实体之间通过相应关系关联。对应于城市商圈/街区知识图谱构建,下面介绍依据城市商圈/街区知识图谱本体,抽取每种类型关系对应三元组实例的过程。
空间知识相关的关系实例:根据城市商圈/街区知识图谱本体的关系类型定义,空间知识相关的关系实例抽取通过计算对应头实体和尾实体是否满足相应空间约束即可,此处不再赘述。
从属知识相关的关系实例:根据实体属性信息可抽取“地点所属类别”和“组织所属类别”关系对应的实例;将“地点”类实体和“组织”类实体的属性信息匹配识别,抽取“隶属组织”关系对应的实例;根据专家知识划分的类别体系,依据上下位关系抽取“类别从属”关系对应的实例。
行为知识相关的关系实例:基于用户轨迹数据,本文参考现有研究[42],将轨迹数据进行去噪处理,将计算的移动速度超过120 km/h的记录过滤,先检测出用户轨迹中空间距小于特定阈值(构建过程中设置为300 m)且总停留时间大于特定阈值(构建过程中设置为10 min)的连续轨迹点,将其合并为一个停留点,最后基于规则从停留点中识别用户的居住地点和工作地点。在此基础上,通过空间约束抽取“居住地位于”和“工作地位于”关系对应的实例;“访问”关系实例抽取则将停留点匹配至最近的“地点”类实体,并将其与“人”类实体关联。
关联知识相关的关系实例:根据城市商圈/街区知识图谱本体的关系类型定义,基于城市区域的流量数据聚合可抽取“街区流量转移”关系对应的实例;基于“街区”类实体的地点类型分布向量,计算余弦距离并选取大于0.95的实体对抽取“街区功能相似”关系对应的实例;基于外部知识库②(②
3.1.3 构建基本信息
表2 城市多源异构数据集
Tab. 2
| 数据集 | 数据来源 | 数据内容 | 记录数/条 |
|---|---|---|---|
| 路网数据集 | 地图平台 | 路网标识、路网对应的经纬度坐标序列 | 2 523 |
| 地点数据集 | 地图平台 | 地点标识、名称、地址、经纬度坐标及所属类别 | 1 618 604 |
| 商圈数据集 | 生活服务平台 | 商圈标识、名称、中心经纬度坐标 | 365 |
| 组织数据集 | 百科文档 | 组织标识、组织名称 | 2 001 |
| 轨迹数据集 | 移动运营商 | 用户标识、经纬度坐标点、时间戳 | 447 061 |
| 画像数据集 | 问卷调查 | 用户标识、属性名称、属性值 | 4 255 |
| 遥感数据集 | ArcGis | 遥感图像标识、对应网格经纬度、遥感图像 | 300 663 |
| 街景数据集 | 地图平台 | 街景图像标识、对应拍摄经纬度、街景图像 | 112 859 |
表3 城市商圈/街区知识图谱不同类型实体数
Tab. 3
| 人 | 地点 | 组织 | 街区 | 商圈 | 类别 | |
|---|---|---|---|---|---|---|
| 北京市 | 51 089 | 1 481 100 | 1 545 | 1 900 | 333 | 437 |
表4 城市商圈/街区知识图谱不同类型关系实例数
Tab. 4
| 关系类型 | 实例数量 | 关系类型 | 实例数量 |
|---|---|---|---|
| 位于 | 1 481 100 | 组织所属类别(细) | 1 545 |
| 归属 | 1 256 591 | 类别从属 | 5 273 |
| 街区交界 | 10 126 | 居住地位于 | 47 269 |
| 街区邻近 | 20 902 | 工作地位于 | 36 863 |
| 服务辐射 | 8 392 | 访问 | 712 462 |
| 隶属组织 | 99 797 | 街区流量转移 | 297 040 |
| 地点所属类别(粗) | 1 481 100 | 街区功能相似 | 4 254 |
| 地点所属类别(中) | 1 481 100 | 相关组织 | 578 |
| 地点所属类别(细) | 1 481 100 | 竞争 | 11 830 |
| 组织所属类别(粗) | 1 870 | 共现 | 291 951 |
| 组织所属类别(中) | 1 858 | 部署于 | 25 037 |
图3
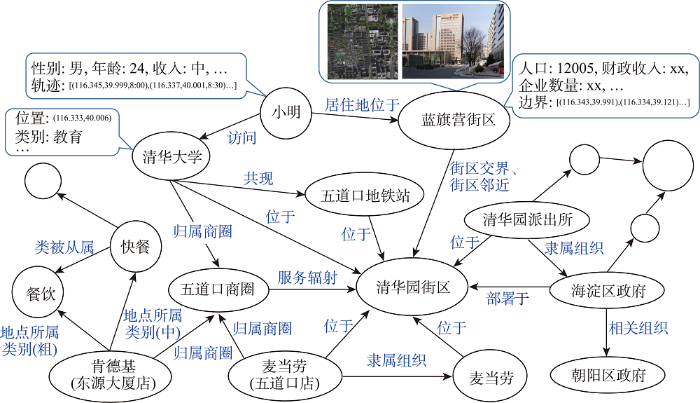
图3
城市商圈/街区知识图谱实例示意图
Fig. 3
The illustration of facts in urban business area/region knowledge graph
至此,本文将海量多源异构城市数据通过知识图谱的方式进行有效组织和融合,将城市中的人、地点、组织、街区、商圈和类别等要素表示在图谱中,增添了相应的属性信息,建模了上述城市要素在空间、从属、行为和关联等方面的关系。特别地,所构建的城市商圈/街区知识图谱为城市可持续发展提供了知识源,可针对具体的城市可持续发展应用从中提取相应知识进行利用。例如,根据上图中清华园街区在图谱中的关联信息,推断该街区的人口密度和财政收入等。
3.2 城市商圈/街区知识图谱驱动的城市可持续发展应用验证
(1)问题定义:社会经济指标预测任务旨在利用遥感图像、街景图像和电话信令等方便获取和时效性强的城市多源数据预测社会经济指标,包括街区的人口、犯罪率和经济活跃度等,替代耗时耗力的传统问卷调查和人口普查方式。本文考虑基于遥感图像和街景图象输入,预测对应街区的社会经济指标。
图4
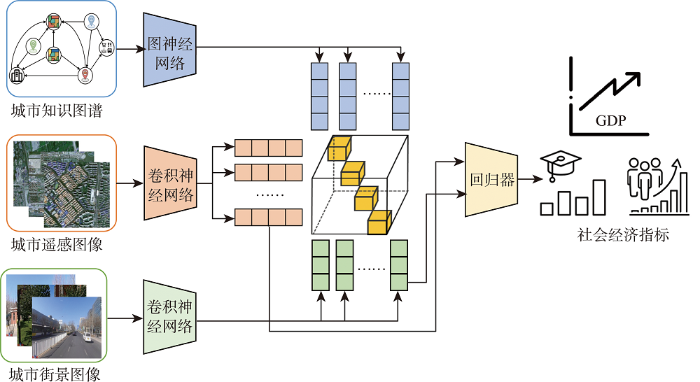
图4
城市商圈/街区知识图谱驱动的社会经济指标预测模型
Fig. 4
Urban business area/region knowledge graph-driven socioeconomic indicator prediction model
式中:
表5 基于城市图像的社会经济指标预测性能比较
Tab. 5
| 模型 | 人口 | 商业活跃度 | 餐饮业活跃度 | 消费能力 | ||||
|---|---|---|---|---|---|---|---|---|
| RMSE | RMSE | RMSE | RMSE | |||||
| KnowCL | 0.523 | 0.720 | 0.587 | 1.033 | 0.646 | 0.823 | 0.417 | 2.805 |
| 本文 | 0.556 | 0.695 | 0.598 | 1.019 | 0.692 | 0.768 | 0.423 | 2.789 |
通过观察表中结果,本文提出的模型在多个社会经济指标预测中均实现了最优性能,验证了引入城市商圈/街区知识图谱的有效性。通过跨模态对比学习的方式,城市商圈/街区知识图谱的语义知识注入到传统视觉编码器中,能够有效地辅助与城市可持续发展相关指标的监测。与此同时,所提跨模态对比学习框架不失为城市商圈/街区知识图谱驱动的城市可持续发展应用的基础模型,通过自监督学习方式进行表征预训练,能够支撑一系列下游城市可持续发展应用。
4 结论
城市正在成为人类社会发展的核心主题,同时,随着海量多源异构城市数据的产生,如何发挥数据优势,实现城市可持续发展对人类命运共同体具有重要意义。本文提出了面向城市可持续发展的城市商圈/街区知识图谱构建与应用研究框架。在构建方面,通过本体层建立城市商圈/街区知识图谱本体,进一步在实例层基于本体指导,从海量多源异构城市数据中构建了城市商圈/街区知识图谱;在应用方面,将城市商圈/街区知识图谱驱动的城市可持续发展应用细分为状态监测、现象解释和决策评估3个方面,并将应用问题转化为了城市商圈/街区知识图谱上的节点级别和子图级别的分类和回归问题求解。基于所提出的研究框架,本文构建了实体达到百万量级、实例达到千万量级的城市商圈/街区知识图谱,并在社会经济指标预测任务中,建立了基于知识图谱和城市图像的跨模态对比学习模型,实现了当前最优性能。
与此同时,本文所提出的城市商圈/街区知识图谱驱动的城市可持续发展研究框架仍存在一定的局限性。首先,本文所构建的城市商圈/街区知识图谱侧重于商圈和街区等城市元素,难以覆盖所有城市元素;其次,城市可持续发展应用广泛,涉及社会、经济和环境的多个方面,本文强调以商圈和街区为主的经济指标监测任务,仍具有较大的扩展空间。未来将进一步丰富所构建的知识图谱,将更多的城市元素和城市数据建模其中,并进一步研究多种场景下的城市可持续发展应用,提供更多的实例验证。
参考文献
Sustainability and resilience for transformation in the urban century
[J].We have entered the urban century and addressing a broad suite of sustainability challenges in urban areas is increasingly key for our chances to transform the entire planet towards sustainability. For example, cities are responsible for 70% of global greenhouse gas emissions and, at the same time, 90% of urban areas are situated on coastlines, making the majority of the world's population increasingly vulnerable to climate change. While urbanization accelerates, meeting the challenges will require unprecedented transformative solutions for sustainability with a careful consideration of resilience in their implementation. However, global and local policy processes often use vague or narrow definitions of the concepts of 'urban sustainability' and 'urban resilience', leading to deep confusion, particularly in instances when the two are used interchangeably. Confusion and vagueness slow down needed transformation processes, since resilience can be undesirable and many sustainability goals contrast, or even challenge efforts to improve resilience. Here, we propose a new framework that resolves current contradictions and tensions; a framework that we believe will significantly help urban policy and implementation processes in addressing new challenges and contributing to global sustainability in the urban century.
The new urban agenda: Key opportunities and challenges for policy and practice
[J].
Defining and measuring urban sustainability: A review of indicators
[J].
The urban south and the predicament of global sustainability
[J].
Expand the frontiers of urban sustainability
[J].
An integrated model based on a hierarchical indices system for monitoring and evaluating urban sustainability
[J].
Machine learning and phone data can improve targeting of humanitarian aid
[J].The COVID-19 pandemic has devastated many low- and middle-income countries, causing widespread food insecurity and a sharp decline in living standards1. In response to this crisis, governments and humanitarian organizations worldwide have distributed social assistance to more than 1.5 billion people2. Targeting is a central challenge in administering these programmes: it remains a difficult task to rapidly identify those with the greatest need given available data3,4. Here we show that data from mobile phone networks can improve the targeting of humanitarian assistance. Our approach uses traditional survey data to train machine-learning algorithms to recognize patterns of poverty in mobile phone data; the trained algorithms can then prioritize aid to the poorest mobile subscribers. We evaluate this approach by studying a flagship emergency cash transfer program in Togo, which used these algorithms to disburse millions of US dollars worth of COVID-19 relief aid. Our analysis compares outcomes—including exclusion errors, total social welfare and measures of fairness—under different targeting regimes. Relative to the geographic targeting options considered by the Government of Togo, the machine-learning approach reduces errors of exclusion by 4–21%. Relative to methods requiring a comprehensive social registry (a hypothetical exercise; no such registry exists in Togo), the machine-learning approach increases exclusion errors by 9–35%. These results highlight the potential for new data sources to complement traditional methods for targeting humanitarian assistance, particularly in crisis settings in which traditional data are missing or out of date.
LightGBM: A highly efficient gradient boosting decision tree
[C]//
Interpretable socioeconomic status inference from aerial imagery through urban patterns
[J].
A generalizable and accessible approach to machine learning with global satellite imagery
[J].Combining satellite imagery with machine learning (SIML) has the potential to address global challenges by remotely estimating socioeconomic and environmental conditions in data-poor regions, yet the resource requirements of SIML limit its accessibility and use. We show that a single encoding of satellite imagery can generalize across diverse prediction tasks (e.g., forest cover, house price, road length). Our method achieves accuracy competitive with deep neural networks at orders of magnitude lower computational cost, scales globally, delivers label super-resolution predictions, and facilitates characterizations of uncertainty. Since image encodings are shared across tasks, they can be centrally computed and distributed to unlimited researchers, who need only fit a linear regression to their own ground truth data in order to achieve state-of-the-art SIML performance.© 2021. The Author(s).
Convolutional networks for images, speech, and time series
[J].
Knowledge-infused contrastive learning for urban imagery-based socioeconomic prediction
[C]//
UVLens: Urban village boundary identification and population estimation leveraging open government data
[J].
Learning phase competition for traffic signal control
[C]//
Introducing the knowledge graph: things, not strings
[J].
Knowledge graphs
[J].
知识表示学习研究进展
[J].
Knowledge representation learning: A review
[J].
Incremental mobile user profiling: Reinforcement learning with spatial knowledge graph for modeling event streams
[C]//
Spatio-temporal urban knowledge graph enabled mobility prediction
[J].
Urban flow pattern mining based on multi-source heterogeneous data fusion and knowledge graph embedding
[J].
顾及时空特征的大气污染执法事理图谱构建方法研究
[J].
Logic graph construction of air pollution law enforcement event considering the spatiotemporal features
[J].
基于网络文本迁移学习的旅游知识图谱构建
[J].
Construction of tourism attraction knowledge graph based on web text and transfer learning
[J].
Freebase: A collaboratively created graph database for structuring human knowledge
[C]//
Wikidata
[J].
AMiner: Toward understanding big scholar data
[C]//
AliCoCo: Alibaba E-commerce cognitive concept net
[C]//
Building a knowledge graph to enable precision medicine
[J].Developing personalized diagnostic strategies and targeted treatments requires a deep understanding of disease biology and the ability to dissect the relationship between molecular and genetic factors and their phenotypic consequences. However, such knowledge is fragmented across publications, non-standardized repositories, and evolving ontologies describing various scales of biological organization between genotypes and clinical phenotypes. Here, we present PrimeKG, a multimodal knowledge graph for precision medicine analyses. PrimeKG integrates 20 high-quality resources to describe 17,080 diseases with 4,050,249 relationships representing ten major biological scales, including disease-associated protein perturbations, biological processes and pathways, anatomical and phenotypic scales, and the entire range of approved drugs with their therapeutic action, considerably expanding previous efforts in disease-rooted knowledge graphs. PrimeKG contains an abundance of 'indications', 'contradictions', and 'off-label use' drug-disease edges that lack in other knowledge graphs and can support AI analyses of how drugs affect disease-associated networks. We supplement PrimeKG's graph structure with language descriptions of clinical guidelines to enable multimodal analyses and provide instructions for continual updates of PrimeKG as new data become available.© 2023. The Author(s).
大规模地球科学知识图谱构建与共享应用框架研究与实践
[J].
DOI:10.12082/dqxxkx.2023.210696
[本文引用: 1]

地球科学(以下简称地学)知识图谱具有强大的知识表示和语义推理能力,已成为地学大数据和地学人工智能发展必要的基础设施。然而,目前的地学知识图谱研究主要面向实验场景,缺乏面向实际应用的大规模地学知识图谱构建方法和共享应用框架研究,导致尚未真正在地学领域现实应用中得到使用。为此,本文面向地学大数据和人工智能研究与应用对地学知识图谱的迫切需求,首先研究了大规模地学知识图谱的构建技术,在此基础上,提出一种覆盖地学知识图谱构建、共享和应用全生命周期的总体框架。然后,以“深时数字地球(DDE)”国际大科学计划为例,开展了面向实际应用的知识图谱平台研发实践。最后,利用该平台,构建了DDE大规模地学知识图谱,开展了知识图谱开放共享,有效实现了知识图谱应用,证明本框架可有效支撑大规模地学知识图谱的构建与共享应用。本文对于地学知识图谱现实应用价值的实现具有重要的促进作用。
Research and practice on the framework for the construction, sharing, and application of large-scale geoscience knowledge graphs
[J].
Geographic knowledge graph (GeoKG): A formalized geographic knowledge representation
[J].Formalized knowledge representation is the foundation of Big Data computing, mining and visualization. Current knowledge representations regard information as items linked to relevant objects or concepts by tree or graph structures. However, geographic knowledge differs from general knowledge, which is more focused on temporal, spatial, and changing knowledge. Thus, discrete knowledge items are difficult to represent geographic states, evolutions, and mechanisms, e.g., the processes of a storm “{9:30-60 mm-precipitation}-{12:00-80 mm-precipitation}-…”. The underlying problem is the constructors of the logic foundation (ALC description language) of current geographic knowledge representations, which cannot provide these descriptions. To address this issue, this study designed a formalized geographic knowledge representation called GeoKG and supplemented the constructors of the ALC description language. Then, an evolution case of administrative divisions of Nanjing was represented with the GeoKG. In order to evaluate the capabilities of our formalized model, two knowledge graphs were constructed by using the GeoKG and the YAGO by using the administrative division case. Then, a set of geographic questions were defined and translated into queries. The query results have shown that GeoKG results are more accurate and complete than the YAGO’s with the enhancing state information. Additionally, the user evaluation verified these improvements, which indicates it is a promising powerful model for geographic knowledge representation.
Demonstrating spindra: A geographic knowledge graph management system
[C]//
WorldKG: A world-scale geographic knowledge graph
[C]//
本体论研究综述
[J].
Overview of researches on ontology
[J].
知识图谱技术综述
[J].
Review on knowledge graph techniques
[J].
Ontology development 101: A guide to creating your first ontology
[R].
Discovering protein drug targets using knowledge graph embeddings
[J].Computational approaches for predicting drug-target interactions (DTIs) can provide valuable insights into the drug mechanism of action. DTI predictions can help to quickly identify new promising (on-target) or unintended (off-target) effects of drugs. However, existing models face several challenges. Many can only process a limited number of drugs and/or have poor proteome coverage. The current approaches also often suffer from high false positive prediction rates.We propose a novel computational approach for predicting drug target proteins. The approach is based on formulating the problem as a link prediction in knowledge graphs (robust, machine-readable representations of networked knowledge). We use biomedical knowledge bases to create a knowledge graph of entities connected to both drugs and their potential targets. We propose a specific knowledge graph embedding model, TriModel, to learn vector representations (i.e. embeddings) for all drugs and targets in the created knowledge graph. These representations are consequently used to infer candidate drug target interactions based on their scores computed by the trained TriModel model. We have experimentally evaluated our method using computer simulations and compared it to five existing models. This has shown that our approach outperforms all previous ones in terms of both area under ROC and precision-recall curves in standard benchmark tests.The data, predictions and models are available at: drugtargets.insight-centre.org.Supplementary data are available at Bioinformatics online.© The Author(s) 2019. Published by Oxford University Press. All rights reserved. For permissions, please e-mail: journals.permissions@oup.com.
Beyond the first law of geography: Learning representations of satellite imagery by leveraging point-of-interests
[C]//
Predicting multi-level socioeconomic indicators from structural urban imagery
[C]//
Tile2Vec: Unsupervised representation learning for spatially distributed data
[J].Geospatial analysis lacks methods like the word vector representations and pre-trained networks that significantly boost performance across a wide range of natural language and computer vision tasks. To fill this gap, we introduce Tile2Vec, an unsupervised representation learning algorithm that extends the distributional hypothesis from natural language — words appearing in similar contexts tend to have similar meanings — to spatially distributed data. We demonstrate empirically that Tile2Vec learns semantically meaningful representations for both image and non-image datasets. Our learned representations significantly improve performance in downstream classification tasks and, similarly to word vectors, allow visual analogies to be obtained via simple arithmetic in the latent space.
The TimeGeo modeling framework for urban mobility without travel surveys
[J].
Composition-based multi-relational graph convolutional networks
[C]//
Deep residual learning for image recognition
[C]//
Learning transferable visual models from natural language supervision
[C]//
