

1 引言
土地资源是人类社会进行生产和生活的基础和载体[1],城镇建设用地的无序蔓延、低效扩张会在一定程度上侵占农田、生态用地[2],进而对社会经济的可持续发展带来不利影响[3]。城镇建设用地的扩展与社会经济发展和生态环境保护之间存在密切联系[4],研究城镇建设用地的扩展模拟对推动城市化进程有显著意义,成为当前地理学研究的重要领域[5]。城镇建设用地扩展模型是分析城镇建设用地扩展规律和驱动机制的有效工具[6],传统的城镇用地扩展模型根据其建模方式可以分为两大类:一类是以计量数学模型[7]和系统动力学模型[8]为代表的数理统计模型,利用数理统计方法表达动态的时间变化,是“自上而下”的分析方法。另一类是以元胞自动机(Cellular Automata, CA)[9-10]代表的基于元胞空间邻域关系的动态模型;在模拟复杂的城市系统时,此类模型可以较好的模拟城市系统演变自组织、突变等复杂现象[11],是“自下而上”的建模方法。目前CA模型多与其他统计学方法或人工智能方法相耦合,如Markov模型[12]、逻辑回归模型[13]、人工神经网络[14]等,此外也出现一些先进的CA衍生模型,如FLUS[15]模型,使模拟结果更加准确。上述研究大多关注城镇建设用地扩展中元胞层面的转换规则,以提高模型的模拟精度,较少考虑城镇建设用地扩展中的分层驱动机制。土地利用系统具有等级特征,在城镇建设用地扩展过程中,各要素之间的相互作用和反馈往往发生在不同的组织层面和不同的尺度上[16]。因此,考虑城镇建设用地扩展中不同层面的分层驱动机制,有助于城镇用地扩展模拟的精度提升并加强其科学性。
现有对城镇建设用地扩展分层驱动机制的研究多从元胞和行政区划层面展开:元胞层面主要挖掘地形地貌、道路通达、空间化的社会经济[17-18]等多方面空间因子的驱动机制;城市群内各城市间的流动[19]、乡镇边界范围[20]等方面,较少考虑城镇建设用地元胞与斑块层面之间的层级关系。上述研究局限于行政区划范围进行分层驱动机制的分析,然而,斑块是土地利用在空间上的最小组成单位[21],且城市内部各城镇建设用地斑块的空间结构并不相同,具有空间异质性特征[22]。传统以元胞尺度展开的城镇建设用地扩展模拟,以元胞为最小单元进行分析,而斑块位于元胞层级之上,故应考虑二者之间的分层驱动机制。因此,探究城镇建设用地元胞与斑块层面的分层驱动机制,对模拟城镇建设用地的扩展具有重要意义。
近些年对于土地利用斑块层面的研究广泛应用于地理学各个方面。在城镇建设用地扩展特征驱动机制方面,研究斑块几何分形特征的时空演变规律[23];在城镇建设用地扩展模拟方面,现有研究利用矢量元胞自动机刻画不规则的城市空间表达,包括基于人口普查区块[24]、城市道路分割[25]、地籍调查定义[26]等的矢量元胞自动机构建。但上述研究忽略了城镇建设用地斑块之间的相互关系,欠缺对城镇建设用地自身空间网络结构的考虑,而通过分析城镇建设用地斑块的空间网络结构特征,能够捕捉城市扩展的空间维度、结构或模式[27]。空间网络模型现广泛应用于构建城市群复杂空间网络模型并识别出城市群的不同区域[28]等地理研究中,能够很好地揭示城市内部的城镇建设用地斑块的空间特征,体现了空间网络模型在解决地理问题上的优势。在城市化发展研究中,城镇建设用地的分布也具有特定的网络结构,因此,顾及城镇建设用地空间网络结构特征的城镇用地扩展模拟是科学合理的。
鉴于此,本文耦合空间网络模型和能够实现分层驱动机制的分层广义线性-元胞自动机(Hierarchical Generalized Linear-Cellular Automata, HGLM-CA)模型[29],构建了空间网络-分层广义线性-元胞自动机(SN-HGLM-CA)模型,将元胞和斑块的空间特征分层级作用于城镇建设用地的变化模拟中。以上海市大都市圈为例,首先运用空间网络模型识别2000—2020年的城镇建设用地网络结构,进而构建空间网络-分层广义线性-元胞自动机模型(SN-HGLM-CA),模拟2015—2020年城镇建设用地扩展,可为上海大都市圈的国土空间规划提供理论依据,并对分层级耦合元胞与斑块空间特征的城镇模拟提供实践证明。
2 研究方法
本文首先基于城镇建设用地斑块构建空间网络模型,得到斑块的空间重要性特征,进而分层级耦合元胞和斑块的空间特征构建SN-HGLM-CA模型,以上海大都市圈为例进行城镇建设用地扩展模拟,通过对比SN-HGLM-CA模型和Logistic-CA、SN-Logistic-CA、ANN-CA、SN-ANN-CA模型的模拟精度和景观指数来验证模型的有效性,技术路线图如图1所示。
图1
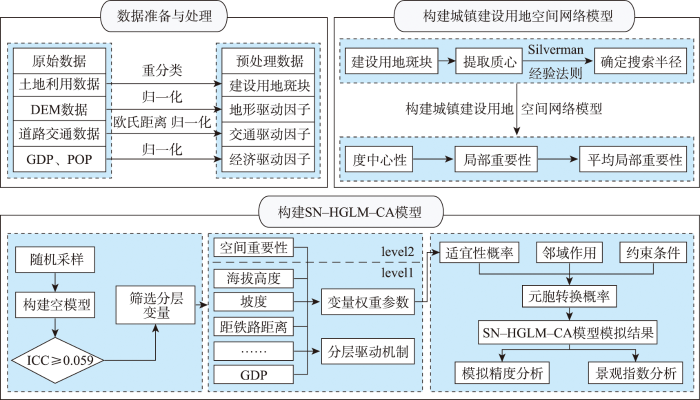
2.1 构建城镇建设用地空间网络模型
首先以城镇建设用地斑块的几何质心,作为空间网络的点,再基于Silverman经验法则[30]计算搜索半径,将质心与落在其搜索半径范围内的其它质心相连,作为空间网络的边,构建网络。根据质心的连结数目、面积和与其它质心相连的距离属性,依次计算度中心性、局部重要性、平均局部重要性指标。
搜索半径(
式中:
度中心性指一个节点在网络中拥有的联结数目,对于一个包含g个城镇建设用地斑块的研究区,斑块i的度中心性
局部重要性[32]综合考虑了互相连接的2个城镇建设用地斑块的距离和面积属性,能够表征城镇建设用地网络内部斑块间的空间联系强弱。
式中:
平均局部重要性[32]由节点的度中心性和相连的所有边的局部重要性计算得到,用于衡量斑块在全局中的空间重要性。
式中:
2.2 SN-HGLM-CA模型
HGLM模型在使用前需计算变量间组内相关系数(Intraclass Correlation Coefficient, ICC),判断实验数据是否适合进行分层研究。一般来说, ICC<0.059时为低度组内相关,组间因素造成的影响可忽略不计;0.059≤ICC<0.138时为中度组内相关,不同群组的样本存在一定差异; ICC≥0.138时为高度组内相关,组间差异不能忽视。本文采用HGLM模型将描述元胞特征的驱动因子置于较低层级(level 1),描述城镇建设用地斑块空间网络结构特征的土地空间重要性自变量置于较高层级(level 2),通过SN-HGLM模型计算得到驱动因子权重系数,公式如下:
level 1:
level 2:
式中:
CA的基本架构一般包括五个部分,常被称为CA的五元组,即元胞与元胞空间、元胞状态、邻域、时间、转换规则,为进行模型精度的比较,暂不考虑随机效应的影响[33],因此非城市元胞转换为城市元胞的概率可以表示为:
式中:t表示模拟过程在第t次迭代中,t = 1,2,…;
在元胞自动机模型邻域大小的选择中,
2.3 模型评价方法
本文从空间对比分析和指标计算两方面对模拟结果进行对比分析。空间对比分析即在研究区全局范围内均匀选取特征明显的局部区域,进行模拟形态的对比;指标计算方面根据已有研究选取了下列8个具有代表性的指标,包括3个精度评价指标和5个景观指数指标。精度评价指标为:总体精度(Overall Accuracy, OA)、卡帕系数(Kappa)和品质因数(Figure of Merit,FoM),前2个指标从模式层次进行度量,FoM值从元胞层次进行度量[35]。以上精度评价指标的值均为0~1,且值越大代表模拟的精度越高。景观指数指标为:斑块个数(Number of Patches, NP)、平均周长面积比(Mean Perimeter-Area Ratio, PARA)、平均欧氏最近邻距离(Mean Euclidean Nearest-Neighbor Distance, ENN)、最大斑块指数(Largest patch index, LPI)和基于上述景观指数的组合,用于评估实际和模拟土地利用模式之间景观相似性的景观相似度指数
式中:
3 研究区概况与数据来源
3.1 研究区概况
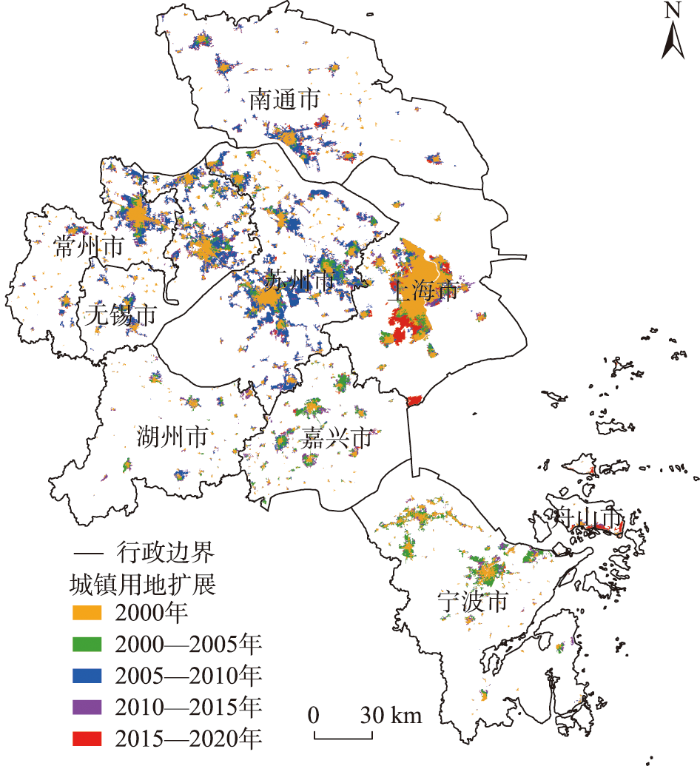
上海大都市圈包括上海、无锡、常州、苏州、南通、宁波、湖州、嘉兴、舟山在内的9个城市(图2),涵盖了长江三角洲城市群的核心城市,经济发展迅速,城市化水平高。挖掘上海大都市圈的城镇建设用地分布规律和扩展模式,是助力该地区未来城市规划建设的重要举措。
图2
3.2 数据来源及处理
本文所使用行政区划矢量数据和土地利用栅格数据均来源于中国科学院资源环境科学数据中心(
表1 驱动因子数据信息
Tab. 1
| 分类 | 驱动因子含义 | 数据来源 | 时间/年 | 原始数据值范围 | 数据预处理 |
|---|---|---|---|---|---|
| 地形地貌 | 海拔高度/m | 中国科学院资源环境科学数据中心 | 2015 | -76.96~1 548.99 | 归一化 |
| 坡度/° | 2015 | 0~65.34 | 重采样、归一化 | ||
| 道路交通 | 距铁路距离/m | Openstreetmap | 2015 | 0~89 511.10 | 欧氏距离、归一化 |
| 距高速公路距离/m | 2015 | 0~91 105.50 | 欧氏距离、归一化 | ||
| 距城市主干道距离/m | 2015 | 0~92426.80 | 欧氏距离、归一化 | ||
| 距城市次干道距离/m | 2015 | 0~70 250.10 | 欧氏距离、归一化 | ||
| 距城市支路距离/m | 2015 | 0~41 121.00 | 欧氏距离、归一化 | ||
| 距高架快速路距离/m | 2015 | 0~79 939.20 | 欧氏距离、归一化 | ||
| 距市中心距离/m | 2015 | 0~125 522.00 | 欧氏距离、归一化 | ||
| 距区县中心距离/m | 2015 | 0~77 802.20 | 欧氏距离、归一化 | ||
| 社会经济 | 公里格网GDP/万元/km2 | 中国科学院资源环境科学 数据中心 | 2015 | 780.81~2 069 174.62 | 重采样、归一化 |
| 公里格网POP/人/km2 | 2015 | 151.80 ~ 41 863.10 | 重采样、归一化 |
图3

表2 驱动因子多重共线性检验
Tab. 2
| 变量名称 | VIF | 变量名称 | VIF |
|---|---|---|---|
| 海拔高度 | 1.651 | 距城市支路距离 | 1.374 |
| 坡度 | 1.630 | 距高架快速路距离 | 2.311 |
| 距铁路距离 | 2.226 | GDP | 3.876 |
| 距高速公路距离 | 1.955 | POP | 3.809 |
| 距城市主干道距离 | 2.120 | 距市中心距离 | 1.908 |
| 距城市次干道距离 | 1.619 | 距区县中心距离 | 1.445 |
4 结果分析与讨论
4.1 城镇建设用地网络结构
通过构建城镇建设用地网络模型,得到其空间联系强度和空间重要性规律,提取上海大都市圈2000—2020年城镇建设用地的空间网络结构特征。
4.1.1 城镇建设用地空间联系强度
表3 2000—2020年上海大都市圈城镇建设用地空间网络模型参数
Tab. 3
| 年份 | 面积/km2 | 节点数/个 | 搜索半径/m | 边数量/条 |
|---|---|---|---|---|
| 2000 | 2 404.56 | 861 | 22 720 | 31 690 |
| 2005 | 3 365.91 | 815 | 23 472 | 27 784 |
| 2010 | 5 343.97 | 746 | 25 693 | 26 382 |
| 2015 | 5 819.49 | 796 | 24 438 | 29 258 |
| 2020 | 6 577.09 | 700 | 25 531 | 23 036 |
由图4可见,2000—2020年上海大都市圈城镇建设用地的空间联系逐渐加强,具体表现在2个方面:① 空间联系强度的最大值在逐渐增大; ② 空间联系强度值在全局范围内出现大幅增长。其中,2000年空间联系较强的城镇建设用地斑块主要分布在上海浦西一带、常州东北部、无锡北部等地区。城市化加强了上述地区的空间联系强度和对周边地区的辐射,嘉兴北部、宁波北部、无锡东部、苏州中部、舟山南部等地区城镇建设用地的空间联系强度逐渐提升,至2020年上海大都市圈地区的城镇建设用地斑块紧凑度高,空间联系强度大。由此表明上海大都市圈的建设对于9个城市的协同发展有明显的促进作用,加强了城市之间的联系度,构建了城市之间的紧密传导机制,推进区域全面建设[40]。
图4
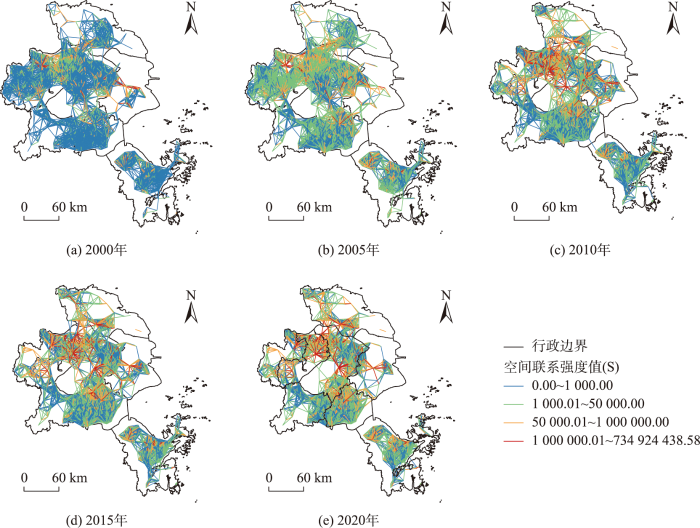
图4
2000—2020年上海大都市圈城镇建设用地空间联系强度
Fig. 4
Spatial network structure of urban land in Shanghai metropolitan area from 2000 to 2020
4.1.2 城镇建设用地空间重要性
在城镇建设用地空间联系强度的基础上,综合考虑斑块的所有连接边的平均空间联系强度,衡量其空间重要性(图5)。上海大都市圈城镇建设用地的空间重要性在时间和空间上表现为两大特征:在时间尺度上,2000—2020年空间重要性逐步增长,具体表现为:空间重要性强的城镇建设用地斑块出现数量上的增加和面积上的扩展。此外,空间重要性强的斑块从2000年的零星、分散分布,至2020年出现了全局范围的集聚分布。在空间格局上,2000—2020年上海大都市圈中城镇建设用地空间重要性强的斑块主要分布在南通南部、常州东部、无锡北部、苏州北部、上海中部、嘉兴北部、宁波中部及湖州和舟山的部分地区,说明上海大都市圈的城市化日益发展为多中心的空间结构[41]。因此,应该不断提升核心城市的影响力范围和周边城市的联系强度,促进区域的整体发展[42]。城镇建设用地斑块的空间重要性刻画了不同斑块在全局范围内的重要性等级,将其置于城镇用地扩展模拟中,能够更好地顾及城镇建设用地的空间网络结构特征,进而提升模型的精度。
图5
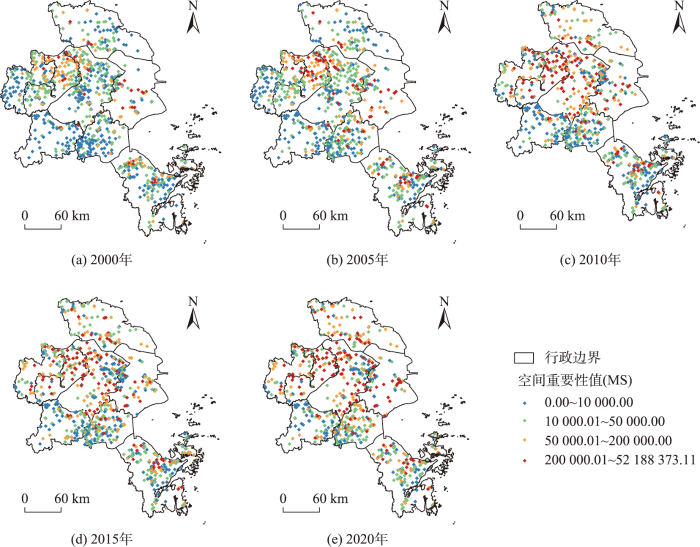
图5
2000—2020年上海大都市圈城镇建设用地空间重要性分布
Fig. 5
Spatial importance distribution of urban land in Shanghai metropolitan area 2000-2020
4.2 基于SN-HGLM-CA的城镇用地扩展模拟
4.2.1 分层驱动机制分析
构建SN-HGLM模型,计算得到的ICC= 0.525,为高度组内相关,组间差异不能忽视,因此采取分层分析。经过多次实验筛选解释变量与控制变量,最终确定驱动因子的层级结构为:坡度、距铁路距离、距高速公路距离、距城市主干道距离、距城市支路距离、距高架快速路距离为解释变量,其余空间因子变量为控制变量,不考虑空间重要性对其系数的影响。研究结果表明城镇建设用地斑块计算得到的空间重要性主要与地形和道路交通因子存在交互关系,与社会经济因子之间不存在明显的交互关系。此结果进一步说明了适宜的地形和完善的交通设施会有效促进城镇建设用地的分布,同时,建设用地也更容易用于交通设施的建设。得到变量参数识别结果如表4。
表4 SN-HGLM变量参数识别结果
Tab.4
| 驱动因子 | 系数 | P值 | 空间交互系数 | 空间交互P值 |
|---|---|---|---|---|
| 空间重要性 | 0.814 | 0.495 | - | - |
| 坡度 | -1.616 | 0.101 | -7.942 | 0.032 |
| 距铁路距离 | 3.409 | 0.312 | 14.766 | 0.234 |
| 距高速距离 | -0.734 | 0.835 | 8.048 | 0.515 |
| 距主干道距离 | 21.606 | 0.055 | 99.125 | 0.027 |
| 距支路距离 | -0.501 | 0.903 | 22.805 | 0.108 |
| 距高架距离 | 3.910 | 0.312 | -1.868 | 0.893 |
| 海拔高度 | -1.472 | 0.000 | - | - |
| 距次干道距离 | -10.831 | 0.000 | - | - |
| 距市中心距离 | -1.352 | 0.000 | - | - |
| 距区县中心距离 | -5.620 | 0.000 | - | - |
| GDP | -23.906 | 0.000 | - | - |
| POP | 11.080 | 0.000 | - | - |
结果显示,空间重要性与元胞状态转换为城镇建设用地的概率呈正相关,说明元胞所处的空间重要性越强,该元胞转换为城镇建设用地的概率越高。观察空间重要性对解释变量的分层驱动机制,空间重要性对距城市主干道距离的作用系数最大,说明空间重要性对距城市主干道距离的作用显著,其P值较小,说明距城市主干道距离和空间重要性对距城市主干道距离,对元胞转换为城镇建设用地的概率有显著影响。此外,空间重要性对坡度、距城市支路距离和据铁路距离的交互影响也较为显著。研究结果进一步证实了土地城镇化结构虽受经济、社会、政治、交通和自然等诸多因素的影响[43],但交通基础设施在城镇建设用地的演变中起着至关重要的作用,被认为是一个重要的推动力这一论断[41]。因此,在进行城镇用地扩展研究中,建设用地斑块的空间异质性与其它因子之间的交互关系不容忽视,有必要在模拟中考虑各空间因子变量的分层驱动机制。
4.2.2 模拟结果分析和讨论
对比5个模型的模拟精度(表5)可知,SN-HGLM-CA模型模拟精度优于SN-Logistic-CA模型,其中OA和Kappa值有小幅度提升,FoM值提升了约6.61%;与SN-ANN-CA模型的模拟结果对比,OA和Kappa值略低,FoM值略高。说明采用SN-HGLM-CA模型,考虑驱动因子的分层驱动机制,相较于线性回归的SN-Logistic-CA模型模拟精度更高,而人工智能算法的SN-ANN-CA模型在模拟上仍具有一定优势,整体精度更高。同时对比是否引入斑块层面空间网络结构的Logistic-CA和SN-Logistic-CA模型、以及ANN-CA和SN-ANN-CA模型发现,在这2种模型中引入斑块的空间特征对于精度的提升的不明显,这进一步证实了元胞和斑块层面的空间特征具有层级性,分层级耦合两者具有显著意义。
表5 2020年上海大都市圈城镇建设用地扩展模型精度对比
Tab. 5
| Logistic-CA | SN-Logistic-CA | ANN-CA | SN-ANN-CA | SN-HGLM-CA | |
|---|---|---|---|---|---|
| OA | 0.983 4 | 0.983 4 | 0.984 1 | 0.984 3 | 0.984 0 |
| Kappa | 0.919 1 | 0.919 2 | 0.922 5 | 0.922 9 | 0.921 8 |
| FoM | 0.234 3 | 0.234 5 | 0.245 3 | 0.247 3 | 0.250 0 |
由于是否引入斑块空间特征的Logistic-CA和SN-Logistic-CA模型、以及ANN-CA和SN-ANN-CA模型的模拟精度差异并不明显,且本文旨在探究分层级耦合元胞和斑块尺度对于城镇建设用地扩展的优势,故在空间和景观指数的对比分析中,仅对比SN-Logistic-CA、SN-ANN-CA和SN-HGLM-CA模型。为直观地展示3个模型模拟结果在空间上的异同,同时在研究区范围内均匀选取了5个典型的局部区域,将3个模拟结果与2020年上海大都市圈的实际城镇用地扩展情况进行比较(图6)。观察区域a的模拟结果,对于集中连片的边缘式扩展,SN-Logistic-CA模型不能合理的控制扩展范围,出现了盲目扩展的情况,而SN-ANN-CA模型未能捕捉到边缘扩展的细节,SN-HGLM-CA模型能够较好的实现大区域的边缘式扩展模拟,与实际城镇建设用地的填充形态更为接近。观察区域b的模拟结果,SN-Logistic-CA和SN-ANN-CA模型不能有效捕捉到小面积斑块边缘的局部扩展,SN-HGLM-CA模型表现出更好的效果。观察区域c的模拟结果,对于整个斑块的外延式扩展模拟, SN-Logistic-CA和SN-ANN-CA模型容易出现过度扩展的情况,SN-HGLM-CA模型能够捕捉到更多细节信息。观察区域d的模拟结果,对于斑块内部的填充式扩展, SN-Logistic-CA和SN-ANN-CA模型模拟结果较为粗糙,笼统的将斑块内部全部填充, SN-HGLM-CA模型的模拟结果更加准确。观察区域e的模拟结果,对于城市飞地的模拟,相比于其它几种模型, SN-HGLM-CA模型对于相应区域扩展的元胞数量的预测有明显优势。
图6
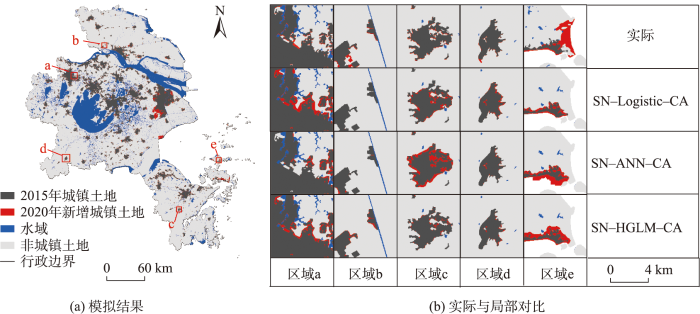
图6
模拟结果与实际的局部对比
Fig. 6
Local comparison between the simulated results and reality
在景观指数方面,本文共选取NP、PARA、ENN、LPI、
表6 2020年上海大都市圈城镇建设用地模拟景观指数对比
Tab. 6
| NP | PARA | ENN | LPI | ||
|---|---|---|---|---|---|
| 真实值 | 661 | 127.662 3 | 1 514.147 8 | 1.593 1 | - |
| SN-Logistic-CA | 686 | 130.249 7 | 1 384.005 2 | 1.652 7 | 95.46 |
| SN-ANN-CA | 675 | 122.478 7 | 1 420.680 5 | 1.621 6 | 96.46 |
| SN-HGLM-CA | 675 | 115.975 3 | 1 463.112 8 | 1.626 7 | 95.81 |
总体而言,本文构建的SN-HGLM-CA模型分层级耦合了元胞和斑块尺度的空间特征,相较于上述其它模型模拟精度更高。在景观形态上,得到的城镇斑块形状更加规整和紧凑,说明考虑驱动因素的层级关系,能够在一定程度上提高CA模型的模拟精度景观布局优势。因此,通过分析不同层级驱动因素与城镇用地扩展的相关关系,以及高层因素对低层因素的调节作用,便于解释城镇用地扩展机制,提高模型的模拟效果。
5 结论与展望
现阶段进行土地利用模拟时选取的空间变量因子数据大多涉及到自然地理环境、社会经济发展、人类活动各个方面,但已有研究较少关注城镇建设用地斑块的空间异质性特征对城镇用地扩展的影响。本文以上海大都市圈为例,构建SN-HGLM-CA模型顾及城镇建设用地斑块的空间异质性特征,并考虑驱动因子之间的层级关系,完成了城镇用地扩展的模拟,并与Logistic-CA、SN-Logistic-CA、ANN-CA、SN-ANN-CA模型对比模拟结果。本文将城镇建设用地斑块的空间异质性特征纳入驱动因素中,构建了基于分层回归方法的SN-HGLM-CA模型,实现了顾及斑块空间异质性的城镇用地扩展模拟。从城镇建设用地的空间网络结构特征中挖掘城镇扩展的规律,能够帮助政府决策者和规划者在城市规划中,在兼顾城镇建设用地发展现状的基础上分析现有趋势是否合理,是否需要对现有趋势加以改变,为城镇开发边界的划定提供参考依据,对于生态和农业空间保护具有重要意义。将城镇建设用地扩展模拟与景观指数评价结合起来,建立土地利用规划评价方法,为优化城镇建设用地扩展和布局提供科学支撑,具有一定的理论意义和实用价值。得出的主要结论如下:
(1)基于城镇建设用地斑块构建空间网络模型,能够识别研究区内斑块的空间重要性特征,挖掘城镇建设用地扩展的规律。
(2)分层回归模型相比于ANN模型能够揭示城镇建设用地扩展的驱动机制,同时相较于逻辑回归模型能够顾及变量间的层级性特征,有效剖析城镇建设用地扩展的分层驱动机制,在城镇建设用地扩展模拟中分层耦合了元胞和斑块的空间特征,在一定程度上提升了模型的可解释性和科学性。
(3)基于SN-HGLM-CA模型顾及城镇建设用地斑块空间异质性层级关系的城镇用地扩展模拟,在模拟精度和景观形态上均取得了良好效果,相较于SN-Logistic-CA模型,FoM值提高了约6.61%,但整体精度仍略低于SN-ANN-CA模型;在景观格局方面,斑块数量和景观形状指数均为最小,说明模拟得到的城镇斑块布局更加紧凑,且形状更加规整。因此,与Logistic-CA、SN-Logistic-CA、ANN-CA和SN-ANN-CA模型相比,所构建的SN-HGLM-CA模型能够获得最佳的模拟结果。
本文构建的SN-HGLM-CA模型,在分层级耦合元胞和斑块空间特征的城镇建设用地扩展模拟时虽然具有优良的效果,但仍存在以下议题需要进一步研究:① 土地斑块的空间分布结构具有高度复杂性和不规律性,可以进一步丰富提取其空间异质性特征的计算指标,如考虑使用道路距离代替欧氏距离; ② 该模型属于线性模型,虽然能够解析城镇用地扩展的驱动机制,但无法像学习模型那样捕捉城镇用地扩展的非线性特征,如何保留机制模型“简单”的优势,同时兼具学习模型非线性的特点,将成为下一步工作的重点。
参考文献
土地资源配置如何影响城市经济效率——基于中国286个地级以上城市工业数据的实证检验
[J].
How does land resource allocation affect urban economic efficiency: An empirical test based on industrial data of 286 cities above prefecture level in China
[J].
基于Markov-FLUS模型的饶河流域土地利用多情景模拟分析
[J].
Land use multi-scenario simulation analysis of Rao River Basin based on Markov-FLUS model
[J].
基于随机森林模型的黄河流域城市建设用地结构时空演化及其驱动机制研究
[J].
DOI:10.18306/dlkxjz.2023.01.002
[本文引用: 1]

城市是区域人口、产业等要素集聚的主要空间载体,系统揭示黄河流域城市建设用地结构演化及其驱动机制对于深入推进黄河流域生态保护和高质量发展战略落实具有重要意义。基于黄河流域2007—2019年城市建设用地数据,论文运用信息熵模型分析了黄河流域城市建设用地结构的时空演化特征,并用随机森林模型探讨其驱动机制。结果表明:① 2007—2019年,黄河流域城市建设用地面积快速增长,年均增速达5.34%,但城市建设用地结构信息熵不断降低,经历了“高位无序—相对稳定—低位有序”的变化过程;② 黄河上、中、下游城市建设用地规模增速依次加大,年均增速分别达到3.91%、5.06%、6.22%;中游地区城市建设用地结构信息熵下降最多,上游地区和下游地区降幅相近;③ 黄河流域各类建设用地主要配置在省会及经济发达城市;黄河流域城市用地结构信息熵存在空间异质性,省会城市及经济发达城市建设用地结构信息熵存在降低趋势,而欠发达城市的信息熵逐步增大;④ 城市用地规模和城市人口规模对城市建设用地结构演化的作用最强,产业结构升级和财政支出规模的作用强度次之,经济发展水平和政策支持力度的作用较小,上中下游影响因子的作用强度存在异质性;⑤ 城市用地规模、城市人口规模、财政支出规模与城市建设用地结构信息熵呈正向变动关系,经济发展水平和产业结构升级与城市建设用地结构信息熵呈负向变动关系,政策支持力度则与城市建设用地结构信息熵呈现出“倒U”型关系。
Spatiotemporal changes of urban construction land structure and driving mechanism in the Yellow River Basin based on random forest model
[J].
DOI:10.18306/dlkxjz.2023.01.002
[本文引用: 1]
Cities are the main spatial carriers for the agglomeration of regional population, industry and other factors, and systematically revealing the evolution of urban construction land structure and its driving mechanism is of great significance for further promoting the implementation of ecological conservation and high-quality development strategy of the Yellow River Basin. Based on the urban construction land data of the Yellow River Basin from 2007 to 2019, the spatiotemporal change characteristics and differentiation patterns of the construction land structure in the basin were analyzed by using the information entropy model, and the formation mechanism of the driving factors was examined by using the random forest model. The results show that: 1) From 2007 to 2019, the area of urban construction land in the Yellow River Basin continued to grow, with an average annual growth rate of 5.34%, but the information entropy of urban construction land structure decreased, and experienced a change process of high-level disorder, relatively stable, and low-level orderly. 2) The growth rate of urban construction land use in the upper, middle, and lower reaches of the Yellow River increased successively, with the annual growth rate reaching 3.91%, 5.06% and 6.22% respectively. The information entropy of urban construction land use structure in the middle reaches of the Yellow River decreased the most, and the decline rates in the upper reaches and lower reaches were similar. 3) All types of construction land in the basin are mainly distributed in provincial capitals and cities in economically developed areas, and there is a clear spatial heterogeneity in the information entropy of urban construction land use structure in the region. The information entropy of urban construction land use structure in provincial capital cities and economically developed cities showed a decreasing trend, while the information entropy of less developed cities gradually increased. 4) The scale of urban land use and the size of urban population have the strongest effect on the change of urban construction land use structure, followed by the intensity of industrial structure upgrading and scale of fiscal expenditure. The role of economic development level and policy support is small, and the intensity of impact of upstream, middle reaches, and downstream influencing factors is heterogeneous. 5) The scale of urban land use, the size of urban population, and the scale of fiscal expenditure showed a positive change relationship with the information entropy of urban construction land use structure, the level of economic development and industrial structure upgrading showed a negative change relationship with the information entropy of urban construction land use structure, and the policy support showed an inverted U-shaped change relationship with the information entropy of urban construction land use structure.
“土地利用模拟”专栏导言
[J].
Introduction to the column "land use simulation"
[J].
黄河下游滩区周边城镇空间扩展特征与驱动机制
[J].
DOI:10.11821/dlyj020221277
[本文引用: 1]
在区域一体化及黄河流域生态保护和高质量发展战略背景下,黄河下游滩区将承担更加多元的生态与社会功能,滩区周边城镇空间进入新的快速成长期。基于城镇空间扩展差异指数、紧凑度、相关维数的定量测算探析2000—2020年黄河下游滩区周边城镇空间扩展格局及形态特征,在此基础上耦合随机森林回归算法与重心-时空地理加权回归(GTWR)模型,采用“主成分分析-重要性判断-驱动空间识别”的分析方法对城镇空间扩展时空变化进行驱动机制的多维度解析。结果表明:① 黄河下游滩区周边地区城镇空间呈圈层式扩展,时空分异与空间溢出特征显著;2005—2010年为高速发展期,此后众多城镇空间重心向靠近黄河与中心城市方向迁移,局部地区城镇空间沿河流方向轴向拓展,区域一体化发展不断加强。② 研究范围内城镇空间形态在波动变化中不断演进,经历了多点集中式扩展-局部线性蔓延-组团化协同发展的变化过程,城镇间联系日趋紧密,簇群结构日渐完善。③ 社会经济、产业结构、自然条件构成了滩区周边城镇扩张的内驱力,政策战略与水利工程形成了城镇发展的外驱力,二者耦合协同推动滩区周边城镇扩展格局与空间形态的不断变化。社会经济与产业结构是城镇扩张的主导驱动力,区域发展政策带动作用愈加显著。基于城镇空间扩展特征与驱动机制的研究,提出了滩区周边区域空间发展格局的优化建议。研究成果可为滩区周边城镇空间布局优化与政策制定提供科学支撑,助力高质量高标准建设沿黄城市群的发展目标。
Characteristics of urban land expansion and its mechanism of cities and towns around the floodplain of the Lower Yellow River
[J].
DOI:10.11821/dlyj020221277
[本文引用: 1]
With the implementation of ecological conservation and high-quality development of the Yellow River Basin, the urban space of cities and towns around the river floodplain area has entered into a new period of rapid growth. This research calculated the Urban Expansion Differentiation Index (UEDI), Compactness Index (C), and Correlation Dimension (Dc) of urban land around the Yellow River floodplain area. Based on the index calculation, this paper analyzed the urban land expansion pattern and morphological characteristics of urban space in the research area from 2000 to 2020. After that, coupled with Random Forests Regression and Geographically and Temporally Weighted Regression model (GTWR), the urban land expansion was regarded as a spatiotemporal system for the driving mechanism analysis in multiple dimensions. The results showed that: (1) Urban land in the research area is expanding in a circle pattern, with significant characteristics of spatiotemporal differentiation and spatial overflow. From 2005 to 2010, cities and towns in this area ushered in a period of high-speed development. Since then, the gravity centers of urban land tended to move towards the Yellow River or adjacent big cities. Urban spaces have developed along the river and the town agglomerations tended to be integrated. (2) The urban land spatial forms in this area evolved in fluctuation. The urban space has gone through the process of multi-point centralized development, local linear spread, and cluster coordinated development. In this process, the connections between cities and towns are becoming closer and closer, and the cluster structure is constantly improving. (3) Economic-social, industrial structure, and natural factors constitute the internal driving force, while the external driving force is composed of flood control projects, policies, and regulations. The coupling of internal and external driving forces promotes the evolution of urban land expansion around the Yellow River floodplain area. On the whole, urban spatial expansion is more dependent on economic development and industrial structure, and regional development policies also play a significant role. Based on the evolving characteristics of urban land expansion and its mechanism, we proposed optimization suggestions for the development pattern of cities and towns in the research area. The research results can provide scientific support for the optimization of spatial layout and policy formulation of cities and towns around the floodplain of the Lower Yellow River, promoting the construction of high-quality urban agglomeration along the Yellow River.
耦合地理模拟与优化的城镇开发边界划定
[J].
Delineating Urban Development Boundaries (UDBs) by coupling geographical simulation and spatial optimization
[J].
不同非空间模拟方法下CLUE-S模型土地利用预测——以秦淮河流域为例
[J].
DOI:10.13249/j.cnki.sgs.2017.02.011
[本文引用: 1]
基于快速城镇化背景下秦淮河流域土地利用历史状况,选择CLUE-S模型对其2020年土地利用情况进行模拟预测。分别使用线性回归、Markov模型、灰色GM(1,1)模型预测CLUE-S模型非空间模块的土地利用需求量,再嵌入CLUE-S中得到3种预测结果,对预测结果进行比较。另外设定“自然发展”情景与考虑规划政策影响的“优化格局”情景,模拟2020年不同情景下秦淮河流域土地利用格局情况,并进行景观格局分析。结果表明:线性回归模型、Markov模型、灰色GM(1,1)模型的Kappa指数分别为0.866、0.849、0.867,3种方法均满足模型精度要求;自然发展情景中2020年水域、水田、林地、城镇用地、旱地面积相对于2010年分别变化21.5%、-15.3%、-9.0%、51.5%、-28.9%,而优化格局情景下水域、水田、林地、城镇用地、旱地面积分别变化3.1%、-1.6%、10.8%、6.3%、-10.6%,相比于自然发展情景,优化情景土地利用状况更符合保护基本农田、增加生态用地连通性、提高雨水下渗能力以及缓解城市热岛效应的要求,为后期土地利用规划提供了依据。
Land use prediction based on CLUE-S model under different non-spatial simulation methods: A case study of the Qinhuai River watershed
[J].Under the background of rapid urbanization in the Qinhuai River Watershed, models of land use change are primary tools for analyzing the causes and consequences of land use changes. We choose CLUE-S model to simulate the land use situation of it in 2020. We use linear regression model, Markov model and the gray GM (1, 1) model respectively to predict the demand for land use which is needed by the non-spatial module of CLUE-S model, then we compared the three forecast results.In order to further verify the influence of policy on land use change, two prediction scenarios were established, one is "natural development" scenario where land use will change according to historical trend and the other is "optimization" scenario which considered the effects of planning policy. We simulated the Qinhuai River Watershed land use pattern in 2020 under different scenarios, and analyze the landscape pattern of it. The results shows that the Kappa index of Linear regression model, Markov model, the gray GM (1, 1) model are 0.866, 0.849, 0.867 respectively, so three methods all satisfy the requirements of model accuracy; In “natural development” scenario, the water area, paddy field, forest land, urban land and the dry farm change, compared to 2010, by 21.5%, 15.3%, 9.0%, 9.0%, 9.0%, respectively, while in “optimization” scenario water area, paddy field, forest land, urban land and the dry farm change by 3.1%, 1.6%, 10.8%, 6.3%, 10.8%, respectively; Under the “optimization” scenario, the land use condition can meet the requirement of protection of basic farmland and ecological land, increasing infiltration capacity of rainwater, and alleviating the urban heat island effect. This work could be the reference for the choice of the method of non-spatial module and provide scientific support for land use planning and managements of the watershed.
基于SD模型的中国2010―2050年土地利用变化情景模拟
[J].
DOI:10.13284/j.cnki.rddl.002939
[本文引用: 1]
通过将中国划分为4个生态区,在综合考虑社会经济和自然因素的前提下,利用系统动力学的原理和方法,选取对土地利用变化影响最大的驱动因素,分区构建中国土地利用变化系统动力学模型并模拟4种发展情景下2050年中国土地利用变化情况。结果表明:在不同情景设定下,土地利用变化差异较大,其中平稳发展情景较理想,生态用地保持良好,城市扩张较为合理;建设用地发展给予的压力以及气候条件的不断恶化,使得4种情景下水域面积在2045年前都呈现减少趋势,需要管理者严控城市扩张,提早规划布局以应对相应挑战;气温和降水对4个生态区的林地和草地影响程度不同,水域面积主要受到降水影响,而技术进步带来的粮食单产提高是影响耕地面积变化的重要因素。
Simulating multiple land use scenarios in China during 2010-2050 based on system dynamic model
[J].
基于约束性CA的大都市郊区城镇增长的情景模拟与管控——以武汉市江夏区为例
[J].
DOI:10.18306/dlkxjz.2016.07.001
[本文引用: 1]
大都市郊区是快速城镇化进程中空间演变最为频繁、人地矛盾最为突出的区域,尤其在中国加快推进“就地就近”城镇化战略的背景下,把握大都市郊区小城镇土地利用时空变化过程及其演变机制,对制定科学合理的管控政策和优化都市空间结构具有重要的现实意义。约束性元胞自动机(constrained Cellular Automata, constrained CA)能够通过简单的规则模拟复杂的城市动态演化过程。本文将土地利用总体规划指标、城镇空间发展战略布局、土地利用开发适宜性等,嵌入约束性CA的转换规则中,采用Logistic逐步回归法分析土地利用空间影响因素,对严格约束下的武汉市江夏区2020年土地利用进行情景模拟分析,并提出城市增长管控手段。结果表明:①研究时段内,江夏区城镇用地呈低效外延式扩张,土地利用集约节约程度较低,其人口规模并未有较大增长,对主城区人口的分散作用尚未真正形成;②约束性CA在模拟大都市郊区演化方面具有较高的可靠性,能够真实反映近郊小城镇的未来空间布局与结构,模拟结果与土地利用规划和城市规划较为契合;③将规划目标导向与现实发展趋势下的模拟结果进行叠加分析,可确定城镇增长需求与规划指标调控间冲突的空间分布,从而划定土地督察的重点监测区域,为加强大都市近郊区的违法用地监查和土地利用管控提供先验的预警知识。
Scenario simulation and control of metropolitan outskirts urban growth based on constrained CA: A case study of Jiangxia District of Wuhan City
[J].
A size-adaptive strategy to characterize spatially heterogeneous neighborhood effects in cellular automata simulation of urban growth
[J].
基于InVEST模型和元胞自动机的城市扩张对陆地生态系统碳储量影响评估——以广东省为例
[J].
Impact of urban expansion on carbon storage in terrestrial ecosystems based on InVEST model and CA: A case study of Guangdong Province, China
[J].
基于多准则CA-Markov模型的城市景观格局演变与预测——以上杭县城区为例
[J].
Urban landscape pattern evolution and prediction based on multi-criteria CA-markov model:Take Shanghang County as an example
[J].
Urban spatial growth modeling using logistic regression and cellular automata: A case study of Hangzhou
[J].
基于ANN-CA模型的郑州城市空间拓展研究
[J].
Study on the space expansion of Zhengzhou based on the ANN-CA model
[J].
A future land use simulation model (FLUS) for simulating multiple land use scenarios by coupling human and natural effects
[J].
Combining top-down and bottom-up dynamics in land use modeling: Exploring the future of abandoned farmlands in Europe with the Dyna-CLUE model
[J].
A partitioned and asynchronous cellular automata model for urban growth simulation
[J].
Modeling patterns of land use in Chinese cities using an integrated cellular automata model
[J].This paper introduces an urban growth simulation model applied to the full scope of China. The model uses a multicriteria decision analysis to calculate the land conversion probability and then integrates it with a cellular automata model. A nonlinear relationship is incorporated in to the model to interpret the impacts of different Land Use and Cover Change driving forces. The Analytical Hierarchical Process is also implemented to compute the variance between weights of different factors. Multiple sizes of neighborhood and different urban ratios in the model rules are tested, and a 5 × 5 neighborhood and an urban threshold of 0.33 are chosen. The study demonstrates the importance of spatial analysis on socioeconomic factors, population, and Gross Domestic Product in land use change simulation modeling. The model fills the gap between the purely economic theory simulation model and the geographic simulation model. The nationwide urban simulation is an example that addresses the lack of urban simulation studies in China and among large-scale simulation models.
基于城市流和层级性的城市群扩展模型构建
[J].
DOI:10.11821/dlxb202112010
[本文引用: 1]
城市群是具有网络关系与层级性的区域空间,一直是中国推进城镇化与区域协调发展的主体单元。本文综合考虑城市群的网络与层级性特征,运用城市流刻画城际网络交互作用,采用分层广义线性模型(HGLM)揭示城市群分层驱动机制。同时,选取长江中游城市群开展实证研究,通过与元胞自动机(CA)耦合,构建HGLM-CA模型模拟城市群空间扩展。将模拟结果与Logistic-CA模型、BBO-CA模型进行比对,据此评析HGLM-CA模型的优劣与改进方向。实证结果表明:城市群空间扩展是多层驱动因素共同作用的结果,城市流不仅会推动城市群空间扩展,而且对元胞层因素起到重要的调节作用,使之具有城际分异性;HGLM-CA模型相比Logistic-CA模型模拟精度更高,说明顾及城市流与层级性的城市群空间扩展模拟结果更为精准;与智能模型BBO-CA相比,HGLM-CA模型模拟精度较低,但其便于从层级性角度把握城市群空间扩展机制。
Model construction of urban agglomeration expansion simulation considering urban flow and hierarchical characteristics
[J].
DOI:10.11821/dlxb202112010
[本文引用: 1]
Since the launch of China's reform and opening up policy, the process of urbanization in China has been accelerated. With the development of cities, inter-city interactions have become increasingly close, and urban agglomerations tend to be integrated. Urban agglomerations are regional spaces with network relationships and hierarchies, and have always been the main units for China to promote urbanization and coordinated regional development. In this paper, we comprehensively consider the network and hierarchical characteristics of an urban agglomeration, while using urban flow to describe the interactions of the inter-city networks and the hierarchical generalized linear model (HGLM) to reveal the hierarchical driving mechanism of the urban agglomeration. By coupling the HGLM with a cellular automata (CA) model, we introduce the HGLM-CA model for the simulation of the spatial expansion of an urban agglomeration, and compare the simulation results with those of the logistic-CA model and the biogeography-based optimization CA (BBO-CA) model. According to the results, we further analyze the advantages and disadvantages of the proposed HGLM-CA model. We selected the middle reaches of the Yangtze River in China as the research area to conduct this empirical research, and simulated the spatial expansion of the urban agglomeration in 2017 on the basis of urban land-use data from 2007 and 2012. The results indicate that the spatial expansion of the urban agglomeration can be attributed to various driving factors. As a driving factor at the urban level, urban flow promotes the evolution of land use in the urban agglomeration, and also plays an important role in regulating cell-level factors, therefore, the cell-level factors of different cities show different driving effects. The HGLM-CA model can obtain a higher simulation accuracy than the logistic-CA model, which indicates that the simulation results for urban agglomeration expansion considering urban flow and hierarchical characteristics are more accurate. Compared with the intelligent algorithm model, i.e., BBO-CA, the HGLM-CA model obtains a lower simulation accuracy, but it can analyze the interaction of the various driving factors from a hierarchical perspective. It also has a strong explanatory effect for the spatial expansion mechanism of urban agglomerations.
Modelling multi-regional urban growth with multilevel logistic cellular automata
[J].
基于斑块层次的土地利用变化对土地质量影响的初步分析——以河北省张北县为例
[J].
The effects of land use change on land quality at patch scale—a case study in Zhangbei County, Hebei Province
[J].
Modeling spatial variations of urban growth patterns in Chinese cities: The case of Nanjing
[J].
基于重心-GTWR模型的京津冀城市群城镇扩展格局与驱动力多维解析
[J].
DOI:10.11821/dlxb201806007
[本文引用: 1]
城镇用地扩展格局及驱动力研究对城市群发展规划与决策具有重要意义。以京津冀地区为例,基于城镇用地扩展强度指数、城镇用地扩展差异指数、分形维数、土地城镇化率和重心转移模型,多维解析了城市群城镇用地扩展格局特征,并耦合重心转移模型和时空地理加权回归(GTWR)模型构建重心-GTWR模型,在对空间格局进行长时间序列多维度指标分析的基础上,运用该模型依序对其特征进行驱动力解读,进而总结凝练京津冀区域发展的主导模式与城市核心驱动力。主要结论为:① 1990-2015年,京津冀城市群城镇用地扩展强度呈现“下降—上升—下降”的趋势,高峰时期在2005-2010年,在2005年之前高速发展城市集中在北京、天津、保定和廊坊,2005年之后集中在邢台和邯郸;② 城市群城镇用地重心虽呈现出发散态势,但城市之间的局部相互作用力逐渐增强,城镇用地扩展驱动力表现出空间溢出特征;③ 京津冀城市群空间发展模式由以北京和天津为中心的双核发展模式向多核发展模式转变,并出现北部资源运输核心、中部经济发展核心和南部投资发展核心三大功能核心组团,城市群趋向于多核功能协同发展模式;④ 重心-GTWR模型结合了时空非平稳性和城市空间相互作用,将城市群城镇用地扩展作为一个时空变化系统进行分析,经验证,该模型在城镇用地扩展格局驱动力分析研究中具有可行性。
Multi-dimensional analysis of urban expansion patterns and their driving forces based on the center of gravity-GTWR model: A case study of the Beijing-Tianjin-Hebei urban agglomeration
[J].Research into urban expansion patterns and their driving forces is of great significance. Under the background of the integrated development of the Beijing-Tianjin-Hebei (Jing-Jin-Ji) urban agglomeration, it is important to study the temporal and spatial patterns of urban land expansion and the driving forces development. This paper uses land-use data of the Jing-Jin-Ji urban agglomeration from 1990 to 2015 and reveals the multi-dimensional characteristics of the urban land expansion patterns. We then combine the urban spatial interaction and the spatial and temporal nonstationarity of the urban land expansion process and build the center of gravity-geographically and temporally weighted regression (GTWR) model by coupling the center of gravity model with the GTWR model. Using the center of gravity-GTWR model, we analyze the driving forces of urban land expansion at the city scale, and summarize the dominant mode and core driving forces of the Jing-Jin-Ji urban agglomeration. The results show that: (1) Between 1990 and 2015, the expansion intensity of the Jing-Jin-Ji urban agglomeration showed a down-up-down trend, and the peak period of expansion was in 2005-2010. Before 2005, high-speed development was seen in Beijing, Tianjin, Baoding, and Langfang, which were then followed by rapid development in Xingtai and Handan. (2) Although the center of gravity of cities in the Jing-Jin-Ji urban agglomeration showed a divergent trend, the local interaction between cities was enhanced, and the driving forces of urban land expansion showed a characteristic of spatial spillover. (3) The spatial development mode of the Jing-Jin-Ji urban agglomeration changed from a dual-core development mode to a multi-core development mode, which was made up of three function cores: the transportation core in the northern part, the economic development core in the central part, and the investment core in the southern part. The integrated development between functional cores led to the multi-core development mode. (4) The center of gravity-GTWR model analyzes urban land expansion as a space-time dynamic system. The model proved to be feasible in the analysis of the driving forces of urban land expansion.
A cellular automata model based on irregular cells: Application to small urban areas
[J].
Mapping block-level urban areas for all Chinese cities
[J].
Entity-based modeling of urban residential dynamics: The case of yaffo, tel aviv
[J].The dynamics of the ethnic residential distribution in the Yaffo area of Tel Aviv, which is jointly occupied by Arab and Jewish residents, is simulated by means of an entity-based (EB) model. EB models consider householders as separate entities, whose residential behavior is defined by the properties of the surrounding infrastructure and of other householders. The power of the EB approach lies in its ability to interpret directly different forms of decisionmaker behavior in the model's terms. Several scenarios of residential interactions between members of local ethnic groups are compared on the basis of detailed georeferenced data taken from Israel's 1995 Population Census. The model simulates very closely the residential dynamics during the period 1955–95; the importance of the qualitative aspects of residential choice, as captured by the EB approach, is demonstrated by this correspondence.
New dimensions of urban landscapes: The spatio-temporal evolution from a polynuclei area to a mega-region based on remote sensing data
[J].
Patterns of typical Chinese urban agglomerations based on complex spatial network analysis
[J].The two prerequisites for monitoring SDG11.A “support positive economic, social and environmental links between urban, peri-urban and rural areas by strengthening national and regional development planning” are the classification of the urban–rural continuum and the extraction of spatial links. However, the complexity and diversity of urban patch distribution make it difficult to achieve a global rapid assessment. Based on the self-developed high-resolution global impervious surface area 2021 (Hi-GISA 2021) product, this study combined the complex network with remote sensing technology to propose a new method to delineate and evaluate the pattern and inner spatial links of the urban–rural continuum for five typical urban agglomerations in China, including the Beijing–Tianjin–Hebei urban agglomeration (BTHUA), the Yangtze River Delta urban agglomeration (YRDUA), the Greater Bay Area (GBAUA), the Chengdu–Chongqing urban agglomeration (CYUA), and the Middle Reaches of Yangtze River urban agglomeration (MRYRUA). The research results are in good agreement with Chinese government documents. First, the five urban agglomerations are all small-world networks with a low degree of overall polycentricity, and the urbanization degrees of GBAUA and YRDUA are higher than BTHUA, CYUA, and MRYRUA. Second, the imbalanced development of YRDUA is higher than the other regions, and the siphon effects of BTHUA and MRYRUA are more significant than YRDUA, CYUA, and GBAUA. Third, some multi-centers show significant siphon effects. The urbanization degree is highly correlated with the urbanization potential but not positively correlated with the degree of balanced development. The results can provide data, methods, and technical support for monitoring and evaluating SDG11.A.
Hierarchical generalized linear models
[J].DOI:10.1111/rssb.1996.58.issue-4 URL [本文引用: 1]
Deconvoluting kernel density estimation and regression for locally differentially private data
[J].Local differential privacy has become the gold-standard of privacy literature for gathering or releasing sensitive individual data points in a privacy-preserving manner. However, locally differential data can twist the probability density of the data because of the additive noise used to ensure privacy. In fact, the density of privacy-preserving data (no matter how many samples we gather) is always flatter in comparison with the density function of the original data points due to convolution with privacy-preserving noise density function. The effect is especially more pronounced when using slow-decaying privacy-preserving noises, such as the Laplace noise. This can result in under/over-estimation of the heavy-hitters. This is an important challenge facing social scientists due to the use of differential privacy in the 2020 Census in the United States. In this paper, we develop density estimation methods using smoothing kernels. We use the framework of deconvoluting kernel density estimators to remove the effect of privacy-preserving noise. This approach also allows us to adapt the results from non-parametric regression with errors-in-variables to develop regression models based on locally differentially private data. We demonstrate the performance of the developed methods on financial and demographic datasets.
长江中游城市群网络联系度与度中心性时序变化研究(2001—2016)
[J].
Study on temporal variations of network connectivity and degree centrality in the middle of the Yangtze River(2001-2016)
[J].
复杂网络理论及其应用研究概述
[J].
A brief review of complex networks and its application
[J].
Simulating urban land growth by incorporating historical information into a cellular automata model
[J].
A methodology to quantify the neighborhood decay effect of urban cellular automata models
[J].
Comparing the input, output, and validation maps for several models of land change
[J].
Integrating a deep forest algorithm with vector-based cellular automata for urban land change simulation
[J].With the capacity to represent irregular geographical entities precisely, vector‐based cellular automata (VCA) have been extensively employed in urban land change simulation at the land parcel level. However, while more driving factors are considered, modeling the complicated nonlinear relationship between land parcel attributes and multiple land‐use changes is increasingly difficult. Moreover, in VCA, the driving factors are unstructured and cannot be directly modeled by traditional deep learning methods, which can only be applied to structured data processing. In order to address these problems, a new VCA model DF‐VCA that adopts the deep forest (DF) algorithm for mining CA transition rules was proposed to simulate urban land‐use change at the parcel level. The DF algorithm is a new deep learning method that can directly mine high‐level features from unstructured data and obtain accurate land‐use transition rules. The proposed DF‐VCA model was applied to simulate the urban land change in Shenzhen, China. Compared with several traditional VCA models, the DF‐VCA model achieved the best simulation performance at parcel‐level (Figure of Merit = 39.88%), pattern‐level (similarity = 96.47%), and community‐level (correlation coefficient = 0.9269). The results show that the DF‐VCA model with strong representative learning ability could simulate urban land change at fine scales precisely. Furthermore, the proposed DF‐VCA model was applied in Shenzhen's future land change simulations to guide sustainable urban development.
Using a maximum entropy model to optimize the stochastic component of urban cellular automata models
[J].
解决多重共线性的新思路:路径分析
[J].
A new way to solve multicollinearity: Path analysis
[J].
长三角城市群城镇用地扩展时空格局及驱动力解析
[J].
Patterns of urban land expansion and its driving forces in Yangtze River Delta urban agglomeration
[J].
区域协调与空间治理背景下的上海大都市圈空间协同规划编制创新探索
[J].
Innovative collaborative spatial planning in Shanghai metropolitan area under the background of regional coordination and spatial governance
[J].
Did highways cause the urban polycentric spatial structure in the Shanghai metropolitan area
?[J].
Exploring the interactive coercing relationship between urbanization and ecosystem service value in the Shanghai-Hangzhou Bay Metropolitan Region
[J].
Urban land use
[M]//Handbook of Regional and Urban Economics.
Incorporation of extended neighborhood mechanisms and its impact on urban land-use cellular automata simulations
[J].
Simulation of land-use changes using the partitioned ANN-CA model and considering the influence of land-use change frequency
[J].Land-use change is a typical geographic evolutionary process characterized by spatial heterogeneity. As such, the driving factors, conversion rules, and rate of change vary for different regions around the world. However, most cellular automata (CA) models use the same transition rules for all cells in the model space when simulating land-use change. Thus, spatial heterogeneity change is ignored in the model, which means that these models are prone to over- or under simulation, resulting in a large deviation from reality. An effective means of accounting for the influence of spatial heterogeneity on the quality of the CA model is to establish a partitioned model based on cellular space partitioning. This study established a partitioned, dual-constrained CA model using the area-weighted frequency of land-use change (AWFLUC) to capture its spatial heterogeneity. This model was used to simulate the land-use evolution of the Dianchi Lake watershed. First, the CA space was divided into subzones using a dual-constrained spatial clustering method. Second, an artificial neural network (ANN) was used to automatically acquire conversion rules to construct an ANN-CA model of land-use change. Finally, land-use changes were simulated using the ANN-CA model based on data from 2006 to 2016, and model reliability was validated. The experimental results showed that compared with the non-partitioned CA model, the partitioned counterpart was able to improve the accuracy of land-use change simulation significantly. Furthermore, AWFLUC is an important indicator of the spatial heterogeneity of land-use change. The shapes of the division spaces were more similar to reality and the simulation accuracy was higher when AWFLUC was considered as a land-use change characteristic.
