

1 引言
西北地区地表干燥,植被稀少,是我国典型的气候变化敏感区和生态环境脆弱区[5-6]。西北地区正经历着明显的气候变化[7]。施雅风等基于多种观测事实指出我国西北地区气候特征由19世纪末至20世纪70年代的暖干趋势,转变为20世纪后期的暖湿化趋势[8⇓-10]。在气候转型的背景下,西北地区水体表现出了相应的变化。已有研究表明,近30年新疆境内面积超过1 km2的湖泊数量增加了14个,水体总面积则增加了950 km2[11]。此外,西北地区的黑河流域受气候变化的影响十分明显[12],近30年来其河流流量以0.4 m3s-1/a的速率增加。现有关于水体的研究一方面基于实测的水文观测数据进行地表水循环变化研究[13⇓⇓⇓-17];另一方面则基于卫星遥感技术在大尺度上研究水体(主要是内陆河湖)的水位和面积变化[18⇓-20]。现有的研究大多侧重于单个流域或湖泊。目前,区域尺度大范围的水体变化宏观研究仍旧缺乏,特别是关于西北地区水体变化的总体趋势及其空间分异规律的认识还比较薄弱。
遥感技术的发展为大范围水体变化的宏观研究提供了必要的条件和可能。当前,高时空分辨率的遥感数据日益丰富,水体遥感识别的技术也日益成熟,一些水体遥感产品已具有很高的精度。其中如JRC全球地表水数据集(JRC Global Surface Water)不仅空间分辨率较高且时间范围广[21],为后续许多水体时空变化的研究提供了重要数据源。比如,基于该数据集,冯祺宇等[22]生成了2000—2019年中国八大沙漠的湖泊时空分布数据集,监测了湖泊长期变化并探讨其驱动要素。此外,另有研究基于JRC数据分析了博斯腾湖水面面积的变化,发现湖泊面积在2000—2013年减少了近182 km2[23]。现有的研究总体上侧重于揭示水体变化的趋势,水体变化与气候变化的内在联系尚未有全面系统的评估。
本文基于高分辨率的全球地表水数据集(JRC Monthly History v1.3),提取2000—2020年西北地区逐月水体空间分布信息。在此基础上,深入分析西北地区水体面积的变化趋势及其空间分异规律。同时,结合高分辨率气候再分析数据(CMFD),探索西北地区水体变化与气候变化之间的内在联系。本文的研究有助于全面评估西北地区水体的时空变化,并为气候变化下西北地区生态环境的建设与保护提供决策支持与科学参考。
2 研究区概况与数据来源
2.1 研究区概况
西北地区位于欧亚大陆腹地和青藏高原东北部(73°15′E—111°15′E、31°32′E—49°10′N),西北地区包括新疆、青海、甘肃、陕西、宁夏,总面积 310万km2,约占我国陆地面积的三分之一。西北地区平均海拔约3 000 m,海拔从西北向东南递减。高原、山脉和盆地是该地区的主要地貌单元,西北地区的河流和湖泊大部分是内陆河流和湖泊(图1)。该地区地表类型以草原和沙漠为主,植被覆盖率低。西北地区主要位于干旱或半干旱地区,属温带大陆性季风气候,每年5月到10月为暖湿季。西北地区年平均气温在5℃以下,年平均降水量小于400 mm,总体上从东南向西南逐渐减少。西北地区水体的主要水源来自冰川融化的水和水源地的雪,河流的水文变化与湖泊的变化密切相关[24]。
图1
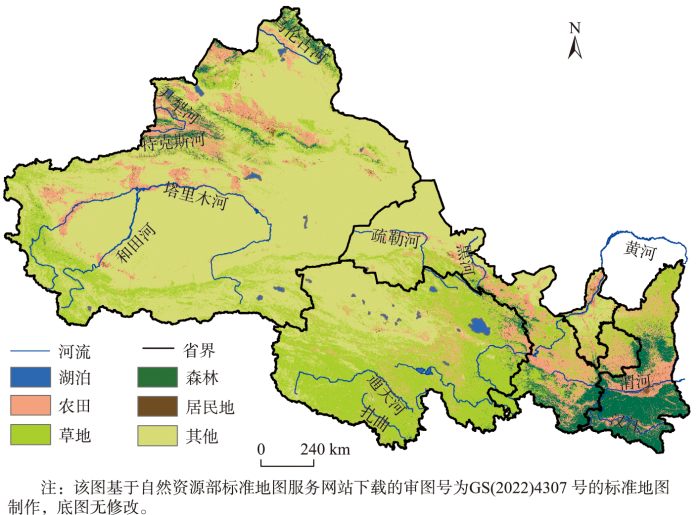
图1
中国西北地区的地理位置及土地利用
Fig. 1
Geographical location and land use map of Northwest China
2.2 数据来源
本研究使用了欧盟委员会联合研究中心JRC(Joint Research Centre of European Commission)全球地表水数据集(JRC Monthly water History v1.3)。该数据集基于陆地卫星(Landsat)5号专题测绘仪(TM)、陆地卫星7号增强型专题测绘仪(ETM+)和陆地卫星8号操作陆地成像仪(OLI)开发而成[21]。数据的空间分辨率为30 m,数据集生产中融合了DEM、城市地区数据(GHSL)等,使用专家系统、视觉分析对像元分类,分为“水体”、“非水体”、“无数据”三类,时间分辨率为月,共包含442张影像,分类器的错误检测率低于1%,遗漏检测率低于5%[21]。
为了认知西北地区水体(地表水)面积对气候变化的响应,气象数据使用了中国区域地面气象要素驱动数据集(CMFD)。CMFD[25]是一个空间分辨率为0.1°的网格再分析数据集。它提供了1979—2018年中国地区的3 h气候数据,包括降水、温度、大气压、比湿度、短波辐射、长波辐射和风速等气候变量。
3 研究方法
3.1 逐月、年水体分布遥感提取
区域水体分布的遥感提取因遥感数据源的不同而有不同的算法以及时空分辨率。考虑到时空分辨率与时空跨度,本研究基于已有的高分辨率全球水体数据,通过进一步的筛选和评价,提取了西北地区2000—2020年5—10月的地表水体分布影像,共126景。在此基础上,综合每年5—10月的遥感影像,生成年最大地表水范围遥感影像时间序列。最大地表水范围定义一年内至少有一次被识别为“水体”的像元集。同时,为保证逐像元趋势分析统计学上的有效性,排除了有效数据小于10年的像元。本研究中,水体主要指河流、湖泊和水库,不包括冰川,常年水体和季节性水体均考虑在内。常年水体是指逐月遥感影像中均表现为水体的像素单元,季节性水体则是指逐月遥感影像中部分月份表现为水体的像素单元。
在逐年、月水体分布30 m分辨率的遥感影像的基础上,为了进一步揭示水体变化的空间差异及尺度效应,分别在10、50和100 km的分辨率上,逐网格统计其各年、月的水体面积,进而生成了不同分辨率逐年月的水体面积空间分布影像时间序列。以上数据的提取均在Google Earth Engine平台进行。图2显示了本文总体的数据处理流程。
图2
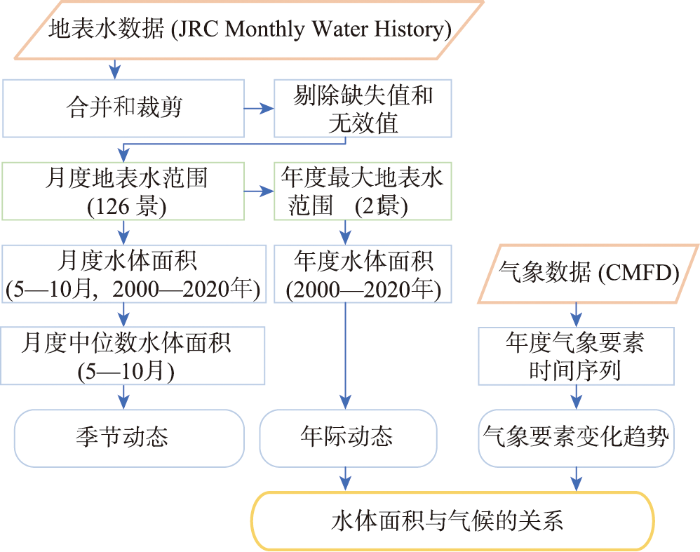
图2
基于JRC全球地表水数据集的水体面积动态研究数据处理流程
Fig. 2
Flow chart of data processing on investigating freshwater area dynamics based on JRC global surface water dataset
3.2 趋势检测
区域水体的变化具有趋势性、周期性和随机性等特征。本文重点分析近20年来西北地区水体面积(或数量)变化的趋势,包括西北地区水体面积变化的总体趋势以及各区块(如10 km网格)内水体面积的变化趋势。
其中:
式中:
3.3 水体面积变化与气候变化的联系
水体面积的变化不仅受气候变化的影响,同时也受流域内地表环境因素的影响,如地形、植被以及人类活动等。考虑到水体面积与气候变化之间复杂的、非线性联系,主要从联合概率分布的角度探讨西北地区水体面积变化与气候变化之间的联系,基于列联表(2×2矩阵)的方法确定两者之间的联系,计算水体面积和气候变量增加/减少的联合概率,联合概率估计:
式中:
此外,为分析水体面积变化与气候变化的关系及其空间差异,基于CMFD再分析数据,逐网格统计了降水和气温的年时间序列,在不同尺度上(10 km×10 km,50 km×50 km,100 km×100 km)计算了水体面积与年降水、年均温Pearson相关系数,以揭示区内水体面积变化主要的气象驱动因子的空间差异。
4 结果及分析
4.1 西北地区水体面积年内变化特征
图3显示了2000—2020年多年平均西北地区水体总面积的年内变化及相应的气候变量(降水、气温和潜在蒸发)的年内变化。由图中可以看出,西北地区水体总面积从5—9月总体呈上升趋势。 6月和9月是一年内水体面积增速最快的月份。从5月(2.40×10⁴ km2)到6月(2.78×10⁴ km2),水体面积增加15.8%。6—7月水体面积基本保持不变,7—8月水体面积则略有增加,8—9月,水体面积则再次有较大的扩张。水体面积在9月份达到年内的峰值(2.96×10⁴ km2)而后开始缓慢下降,9—10月(2.86×10⁴ km2),水体面积约缩减3.4%。
图3
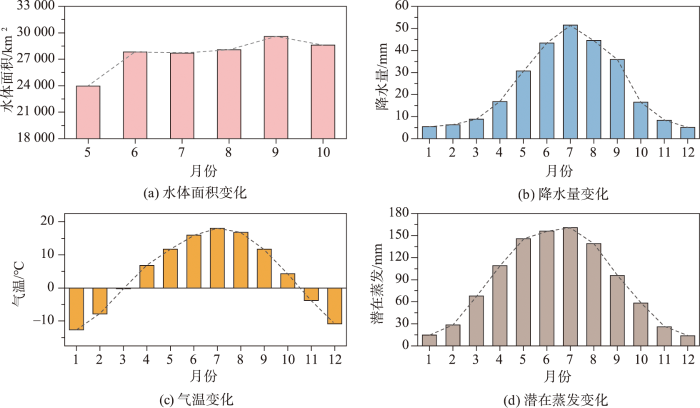
图3
中国西北地区水体面积的季节动态及年内气候变化
Fig. 3
Seasonal dynamics of freshwater area over Northwest China and Intra-annual climate variation
西北地区水体总面积的季节变化与降水和气温年内的波动关系密切。5—6月,随着气温的进一步回升,西北地区河湖上游的冰雪消融加剧,冰雪融水形成的径流对常年水体的补给增加,因此水体表现出扩张状态,同时部分径流可能汇入季节性水体。6—8月虽降水量达到峰值,但蒸发量也达到全年最大,因而水体面积增速变缓;至9月水体面积的快速扩张是由于进入雨季降水增多,且经过6、7、8月的降水累积,流域内增多的径流增加了西北地区水体的补给来源。9—10月,降水、气温都下降显著,造成部分水体的补给来源减少,因而水体面积下降。
图4给出了西北地区各月水体的空间分布。可以看出,西北地区水体分布在季节上存在明显空间差异,变化较明显的地区主要位于青海西部以及和田河、塔里木河沿岸。从6月开始,由气温升高冰雪消融增加引起的水体面积增加在青海西部开始显现,水体面积和数量均高于5月;随着降水增加,和田河、塔里木河沿岸的季节性水体从7月开始出现;到9月份,随着各流域水量增加,西北地区达到年内水体面积的峰值,进入10月由于气温、降水、蒸发均下降,西北地区水体面积减小。
图4
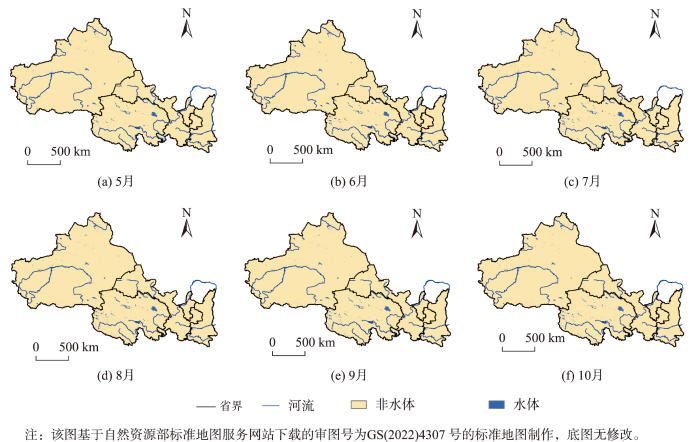
图4
中国西北地区水体空间分布的季节变化
Fig. 4
Seasonal variation of freshwater spatial distribution over Northwest China
4.2 西北地区水体面积年际变化趋势
2000—2020年西北地区水体面积(年最大地表水范围)的年际变化如图5所示,图5(a)表明,就西北地区总体而言,2000—2020年其水体面积从3.48×10⁴ km2增加到4.82×10⁴ km2,增长速率为682.64 km2/a,水体面积占西北总面积的比例由1.04%上升到1.41%,水体扩张效果显著。图5(a)同时还表明,2010年前后,西北地区水体总面积有显著的差异。2000—2010年多年平均全区水体总面积约为3.77×104 km2, 2011—2020年多年平均总面积则约为4.46×10⁴ km2,水体面积同比上涨23.55%。从空间分布上看(图5(c)和图5(d)),相比于2000—2010年,青海西部、塔里木河流域以及昆仑山脉的水体面积和水体数量在2011—2020年都显著增加,与长期以来(2000—2020年)的水体面积变化趋势一致。
图5

图5
2000—2020年西北地区水体面积的年际动态及其空间变化以及不同年代空间分布的年际变化
Fig. 5
Inter-annual dynamics and spatial variation of freshwater area over Northwest for period 2000 to 2020,and inter-annual variation of freshwater spatial distribution in different decades
为进一步揭示西北地区水体面积变化的空间差异,利用Mann-Kendall非参数检验法在10 km×10 km的网格上检测了西北地区水体面积变化的长期趋势(P<0.05),结果如图5(b)。总的来说,在塔里木河、和田河、台吉乃尔湖、达布逊湖和青海湖等常年水体周围,水体面积持续增加,增加的地区主要位于塔里木河流域及青海西部,即红框所在范围,显示了水体面积变化最为明显的区域。具体而言,水体面积显著增加的地区包括青藏高原北部边缘地区(即青海西部)、沱沱河和通天河的支流,以及可可西里湖、卓乃湖、西津乌兰湖、明镜湖和乌拉湖等。
4.3 不同气候变化区水体面积的变化
1979—2018年西北地区降水、气温、干燥指数的长期变化趋势如图6(a)所示。由图6中可以看出,近40年来西北地区全区平均气温以0.49℃/10 a的变化率显著上升,全区平均降水以22.76 mm/10 a的速率显著增加,干燥指数(潜在蒸发与降水之比)则以0.78/10 a的速率显著减少。然而,由于自然地理条件的差异,西北地区的气候变化存在着一定程度的空间分异性[29]。根据气温和干燥指数的年际变化趋势,西北地区气候变化的类型主要包括暖湿化(气温显著升高同时干燥指数显著降低)、暖干化(气温和干燥指数均显著升高)、温暖化(气温显著升高但干燥指数无显著变化)、湿润化(干燥指数显著降低但气温无显著变化)及无变化(气温和干燥指数均无显著变化)5类(图6(b)),其中,暖湿化、温暖化和湿润化面积所占的比例较高,分别占总面积的41%、37%和17%。总体来看,西北地区“暖化”的趋势(暖湿化、暖干化和温暖化)在区内较为普遍,而“湿化”趋势(暖湿化和湿润化)存在较为明显的空间差异,主要发生在区内较为干旱的西北部(年降水量小于400 mm)。
图6
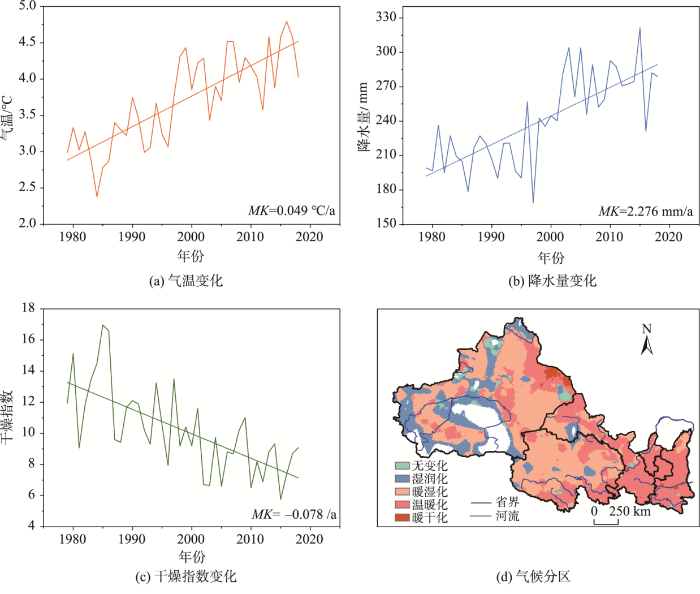
图6
西北地区气候变化趋势及气候变化类型分区[29]
注:该图基于自然资源部标准地图服务网站下载的审图号为GS(2022)4307号的标准地图制作,底图无修改。
Fig. 6
Climate change trends in Northwest China and climate change zoning
水体面积和数量在3个主要气候变化区内各不相同(图7)。总体来看,暖湿化区域多年平均水体面积(年均水体面积/年均水体数量)最高,约为279.12 km2。其次是湿润化和温暖化区域,分别为179.23 km2和138.01 km2。从变化趋势上看,暖湿化区域内的水体面积占比(水体面积/气候变化区面积)增长速率最高,约为0.33/10a。其次是湿润化区域,其水体面积占比上升速率约为0.21/10a。温暖化区域水体面积占比上升速率最小,约为0.06/10a,这可能是由于气温上升导致区内蒸发量增加,从而减缓水体面积的扩张速率。总的来说,暖湿化地区的水体面积扩张最显著。这可能因为一方面降水量的增加将产生更多的径流,流入水体(如塔里木河),从而导致区域水体面积扩大(如塔里木河源头和支流的面积显著上升)。另一方面,气温的升高可能导致冰川融水补给型的水体,因为来自冰川融水的水分补给的增加而扩张。
图7

图7
2000—2020年不同气候区的水体面积及水体数量年际动态
Fig. 7
Inter-annual dynamics of freshwater area and the number of freshwater in different climate zones from 2000 to 2020
4.4 水体面积变化对气候变化的响应
水体面积变化对西北地区气候变化响应敏感。西北地区总体上正经历着暖湿化的趋势,这表现在温度和降水量的增加以及干燥指数(潜在蒸散发量与降水量的比值)的降低。本研究为了分析水体面积变化对气候暖湿化的响应,基于CMFD数据集计算了4个主要气候变量(气温、降水、潜在蒸散发和干燥指数)的变化趋势,并统计不同尺度(10 km×10 km,50 km×50 km,100 km×100 km)水体面积相对于气候变量的列联表(图8)。每个列联表均基于2000—2020年水体面积和气候变量变化趋势计算联合概率,在这里仅计算2000—2020年观测到的水体像元(占总西北地区总面积的44.2%)。
图8
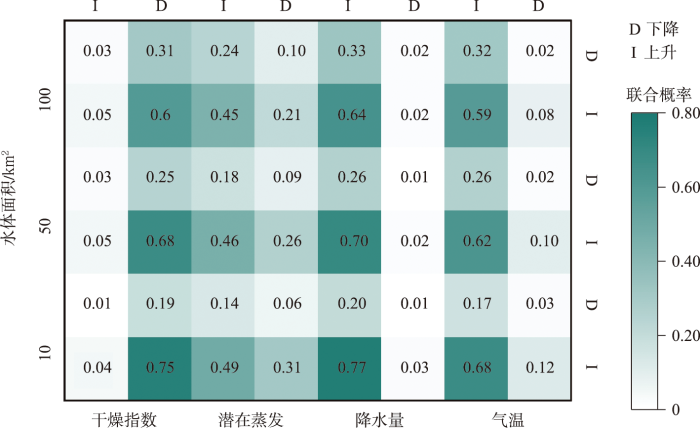
图8
西北地区水体面积与气候变量的列联表
Fig. 8
Contingency table of freshwater area against dominant climate variables in Northwest China
图8表明,气温和降水与水体面积的变化联系紧密。在10 km×10 km尺度上,暖化(气温上升)区域中大约80%(=0.68/0.85)的水体面积呈现增加趋势,同时在降水量增加的地区,约79%(=0.77/0.97)的水体扩张。水体面积和干燥指数(=PET/P)之间的联合分布在很大程度上与水体面积和降水之间的联合分布相当。可以发现,在3个尺度上,气温和降水均为影响西北地区水体面积的重要因素,随着暖湿化进程的持续,该区域水体未来将继续扩张。此外,研究还发现降水量(或干燥指数)与水体面积之间的联合概率高于温度与水体面积之间的联合概率,这表明在水资源本就匮乏的西北地区,相比于变暖趋势,湿化对于水体面积的增大可能发挥着更重要的作用。随着水体范围的扩大和水文连通性的增强,湿润趋势(干旱指数的下降或降水量的增加)可能是90%以上地区的关键驱动因素。
利用Pearson相关分析方法,逐格点计算不同尺度(10 km×10 km,50 km×50 km,100 km×100 km)气温和降水与水体面积间的相关性,进一步在空间上明确西北地区气候暖湿化对水体扩张的驱动作用(图9)。10 km×10 km尺度上能反映西北地区水体变化更多的细节特征及内部空间差异,但由于西北地区水体多为内流河湖,来源主要为降水与冰雪融水,因此局部水体的变化不止受到当地气候条件的影响,特别是对于河流下游及湖泊来说,来水量取决于上游的产水量(包括降水、冰雪融水),因而其上游的气候变化可能更重要。通过计算更大尺度上(50 km×50 km,100 km×100 km)水体面积与气候变量(气温、降水)的相关性,分析水体所在地与其上游气候变化对水体面积的影响。从整体上看,气候变化与水体面积的变化在空间上具有较好的一致性。西北地区整体上水体面积与降水和气温呈正相关,尤其是新疆北部、和田河流域和青海省大部,这些区域气候变化类型表征为暖湿化,降水和气温同时增加是水体扩张的主要驱动力。
图9

图9
西北地区水体面积对降水和气温的空间响应
注:该图基于自然资源部标准地图服务网站下载的审图号为GS(2022)4307号的标准地图制作,底图无修改。
Fig. 9
Spatial response of freshwater area to precipitation and temperature in Northwest China
由于西北地区气候变化空间上的复杂性,水体面积对于年降水量和年均温的响应也体现出一定的空间差异(从10 km×10 km尺度来看)。和田河与塔里木河流域主要位于气候湿润化区域,在该区域内水体面积与年降水和年均温正相关性较高,降水对该流域起到主导作用,因此表现出与降水的正相关,同时和田河作为塔里木河的三大源头之一,其水资源的增加也为塔里木河面积的扩大做出贡献,进一步增大了塔里木河的面积,因此塔里木河的扩张与降水的空间相关性表现的更加明显;青海西部位于青藏高原的水体主要位于暖湿化区域,其水体面积与年降水、年均温的正相关性较高,且气温升高对青海西部起到更为重要的作用,冰雪融水增多,增加了该地区水体补给来源。疏勒河流域水体面积与年均温正相关而与降水的相关性不明显,该地区气候表现出温暖化的特征,由于疏勒河主要为积雪河冰川补给,因此气温的驱动作用强于降水。
从更大尺度上看(50 km×50 km,100 km×100 km),塔里木河上游水体面积的增加与和田河水体面积的增加密不可分,尤其在两河交汇处,降水量与水体面积的增加高度正相关;而在博斯腾湖周围,水体面积与气温负相关,包括其来源开都河以及受博斯腾湖补给的孔雀河所在区域,均展现出其气温的负相关性。东部地区是西北气候温暖化主要的分布区域,这里水体面积与降水和气温的相关性均较弱,一方面是由于这一区域雨量相对充沛,降水并没有表现出明显增加的特征,另一方面是由于人口密度较高,由于抽水灌溉等活动对河流水量的消耗在一定程度上减弱了气温对于水体扩张的驱动作用。而新疆中部的博斯腾湖水体面积变化与降水和气温均表现出显著的负相关,这是由于大量的人类活动改变了水体形态,致使该地区水体面积大幅减少。可见,除气象要素之外的其他因素(如地形、农业和筑坝)也会对西北地区水体面积的变化做出贡献。关于气候变化和人类活动对区域水体面积的影响及定量关系,未来还需要进一步深入研究。
5 讨论
本研究利用JRC数据进行水体面积变化研究,但受限于JRC数据自身算法的不足及验证数据的有限,仍然存在漏分和错分的现象;且原始光学数据受云影响也存在较多的数据缺失,特别是在基于Landsat-5进行水体分类的时段[36-37]。这些数据集本身的限制都会对我们的研究结果准确性产生一定的影响,但目前可用于长时序大尺度分析的水体分布产品仍然十分缺乏,因此综合现有数据的精度和分辨率来看利用JRC数据进行区域性水体的趋势研究仍然是最佳选择。此外, JRC数据的空间分辨率为30 m,对于内陆冰川补给地区,小型水体数量常常显著增加,因此这一空间分辨率对于小型水体的变化研究是不足的,可能会低估西北地区实际增加的水体面积。因此,随着未来更高时空分辨率遥感数据和产品的日渐丰富及不断积累,将有利于我们进一步定量化西北暖湿化背景下水体的变化情况,从而更清晰地认知水体变化对气候变化的响应。
目前对于西北地区水体面积变化的研究,一方面主要基于实测的水文观测数据进行区域尺度的研究,但通常是在流域尺度上进行水循环过程研究;另一方面基于卫星遥感技术监测内陆河湖的水位和面积变化,但也主要集中在西北地区几个大型湖泊且对于其对气候变化的响应认知不够明确[38-39]。本研究首先对西北地区水体变化的时空特征进行了深入分析,结果表明水体总面积从3.48×10⁴ km2显著增加到4.82×10⁴ km2,增加的区域主要位于西北部暖湿化地区,主要分布在新疆和青海,沿和田河、塔里木河和沱沱河等河流沿线区域,这一点与陈亚宁等[40]发现的塔里木河水资源量在高处波动一致,同时Yan等[35]也发现青藏高原东北部及邻近地区(即青海、宁夏和甘肃的部分地区)在2000—2010年67个湖泊的表面积增加,湖区总面积增加了1 867.04 km2,显著扩张。其次本研究探讨了西北地区水体面积变化对气候变化的响应特征,主要考虑气温、降水、潜在蒸发、干燥度等几个因素。然而事实上,除了气候因素,其他环境或认为因素(包括辐射、地形、人类活动等)也影响着西北地区水体面积变化,特别是东南部人口密度较大的区域很难忽略人类活动的影响。未来的研究中将综合考虑多种因素,深入分析西北地区水体面积变化的主要驱动因子及对气候变化的响应机制,动态监测西北地区水体面积变化趋势,为区域水资源管理和生态系统变化评估提供技术支撑。
6 结论
本研究基于高分辨率地表水数据集(JRC Monthly History v1.3),动态监测了2000—2020年西北地区水体面积的季节和年度时空变化情况,并探讨了水体面积与气候变化之间的关系。主要结论如下:
从年内变化特征来看,西北地区水体面积从 5月(2.40×10⁴ km2)快速增加到6月(2.78×10⁴ km2),而后缓慢增加到9月达到峰值(2.96×10⁴ km2)在 10月(2.86×10⁴ km2)开始下降,其中6月的增加可能是由于气温升高,冰雪消融加剧,9月的快速扩张是由于进入雨季降水增多。水体面积季节性差异较大的地区位于青海省西部、和田河、塔里木河沿岸。从年际变化来看,自2000—2020年,西北地区的水体面积从3.48×10⁴ km2增加到了4.82×10⁴ km2,增加区域主要位于暖湿化地区,分布在新疆和青海,沿和田河、塔里木河和沱沱河等河流沿线地区,其中,2000—2010年西北全区水体总面积多年平均约为3.77×10⁴ km2,2011—2020总面积多年平均约为4.46×10⁴ km2,水体面积同比上涨23.55%。
西北地区“暖湿化”趋势明显,全区平均气温以0.49℃/10a的变化率显著上升,降水以22.76 mm/10a的速率显著增加,干燥指数以0.78/10a的速率显著减少。但在总体暖湿的趋势下,西北地区气候变化也存在空间差异,气候暖湿化主要发生在区域内西北部较为干旱的区域(年降水量小于400 mm),而温暖化或暖干化则发生在降水相对充足的东南部。西北地区的水体面积受到气候变化的影响。2000—2020年暖湿化气候区的水体面积由 1.98×10⁴ km2增长为2.91×10⁴ km2,增长速率为466.14 km2/a,区域内的水体面积占比(水体面积/气候变化区面积)增长速率最高,约为0.33/10a。相比于其他气候区,21年暖湿化气候区的水体面积扩张最明显。
基于列联表的结果表明,气温和降水量增加的同时,水体面积也很大概率的增加,其变化与年降水量、年均温相关性显著。其中,从地区分布来看,塔里木河流域降水量对水体面积增长起到了正向主导作用,青海西部气温对水体面积上升的驱动作用强于降水。降水的增加,直接增大了和田河及塔里木河径流,为其面积的扩大做出贡献;年均温的升高导致冰雪融水增多,主要增加了青海西部位于青藏高原的水体补给来源。
在气候变化背景下,西北地区水体面积的增加有助于植被恢复和荒漠化治理,改善生态环境。未来的研究中将综合考虑更多影响因素,充分利用多源遥感数据和地面观测数据,构建模型,定量的探讨水体面积变化的主要影响因素以及对气候变化的响应机制。
参考文献
The freshwater landscape: Lake, wetland, and stream abundance and connectivity at macroscales
[J].
Status quo, historical evolution and causes of eutrophication in lakes in typical lake regions of China
[J].
Flood prediction using machine learning models: Literature review
[J].Floods are among the most destructive natural disasters, which are highly complex to model. The research on the advancement of flood prediction models contributed to risk reduction, policy suggestion, minimization of the loss of human life, and reduction of the property damage associated with floods. To mimic the complex mathematical expressions of physical processes of floods, during the past two decades, machine learning (ML) methods contributed highly in the advancement of prediction systems providing better performance and cost-effective solutions. Due to the vast benefits and potential of ML, its popularity dramatically increased among hydrologists. Researchers through introducing novel ML methods and hybridizing of the existing ones aim at discovering more accurate and efficient prediction models. The main contribution of this paper is to demonstrate the state of the art of ML models in flood prediction and to give insight into the most suitable models. In this paper, the literature where ML models were benchmarked through a qualitative analysis of robustness, accuracy, effectiveness, and speed are particularly investigated to provide an extensive overview on the various ML algorithms used in the field. The performance comparison of ML models presents an in-depth understanding of the different techniques within the framework of a comprehensive evaluation and discussion. As a result, this paper introduces the most promising prediction methods for both long-term and short-term floods. Furthermore, the major trends in improving the quality of the flood prediction models are investigated. Among them, hybridization, data decomposition, algorithm ensemble, and model optimization are reported as the most effective strategies for the improvement of ML methods. This survey can be used as a guideline for hydrologists as well as climate scientists in choosing the proper ML method according to the prediction task.
Google earth engine: Planetary-scale geospatial analysis for everyone
[J].
中国西北地区干旱气象灾害监测预警与减灾技术研究进展及其展望
[J].
DOI:10.11867/j.issn.1001-8166.2015.02.0196
[本文引用: 1]

干旱灾害是制约中国西北地区社会经济发展、农业生产和生态文明建设的重要自然灾害,而且随着气候变暖西北地区极端干旱事件发生频率和强度均呈增加趋势,影响不断加重。 “中国西北干旱气象灾害监测预警及减灾技术研究”成果是在数十个国家级科研项目的支持下,经过过去20年的理论研究和应用技术开发所取得的一系列创新性成果。该成果对西北干旱形成机理及重大干旱事件发生、发展的规律取得了新认识,尤其是发现了形成西北干旱环流模态的4种主要物理途径;研制了西北干旱预测的新指标、干旱监测的新指数及监测农田蒸散的新设备,明显提高了干旱监测准确性和针对性;提出了山地云物理气象学新理论,研发了水源涵养型国家重点生态功能区——祁连山空中云水资源开发利用技术;发现了干旱半干旱区陆面水分输送和循环的新规律,揭示了绿洲自我维持的物理机制;认识了干旱气候变化对农业生态系统影响的新特征,建立了旱作农业对干旱灾害的响应关系;开发了旱区覆膜保墒、集雨补灌、垄沟栽培、适[JP2]宜播期等应对气候变化的减灾技术,为西北实施种植制度、农业布局及结构调整和农业气候资源高效利用提供了科学方案。该成果的完成提升了中国干旱防灾减灾技术水平,培养了中国干旱气象科技队伍,推进了西北地区干旱气象业务服务能力,对西北地区社会经济发展、农业现代化和生态文明建设等方面起到了重要的促进作用。在此基础上,展望了西北地区干旱气象科学研究中迫切需要、有可能突破的主要领域。
Research progress and prospect on the monitoring and early warning and mitigation technology of meteorological drought disaster in northwest China
[J].
DOI:10.11867/j.issn.1001-8166.2015.02.0196
[本文引用: 1]
Drought disaster is an important natural factor to restrict the socioeconomic development, agricultural production and ecological civilization construction in Northwest China.With the global warming, the frequency and intensity of extreme drought events show a significantly increasing trend and the impact of drought increases continually. The results of “the research on monitoring and early warning and mitigation technology of meteorological drought disaster” have been obtained based on the support from dozens of national research projects in the past two decades. These projects have received a series of innovative achievements by long-term theoretical research and applied technology development through the continuous study around the formation mechanism, monitoring and early warning methods of meteorological drought and its impact on agricultural industry, the drought disaster prevention and mitigation technology and other relative scientific issues as well. The major achievements are as follows: New knowledge on the drought formation mechanism and the law of occurrence and development of severe drought events, especially the discovery of four main physical ways of drought circulation modals were obtained in Northwest China. The new drought prediction and monitor indices, and the new equipment of monitoring field evapotranspiration were developed in Northwest China, and these obviously improved drought monitoring accuracy and pertinence. A new meteorological theory of mountain cloud physics was proposed. The exploitation and utilization technology of air cloud water resources were developed over Qilian Mountain, which is the national key ecological function zone with water conservation. The new laws of land surface moisture transport and recycling in arid and semiarid areas, and the physical mechanism of selfsustaining of oasis were revealed. The new characteristics of impact of arid climate change on agro-ecological system were recognized. The response relationship of rain-fed agriculture to drought disaster was set up. The mitigation disaster technologies to cope with climate change in arid area were developed by using coated soil conservation, rainwater harvesting for supplemental irrigation, furrow cultivation, suitable sowing date and so on. These technologies provided a scientific scheme to the implementation of cropping systems, layout and structural adjustment of agriculture and efficient utilization of agricultural climate resources in Northwest China. The above achievements promote the technological level on drought disaster prevention and mitigation, cultivated research teams working on arid meteorological science and raised the service ability of arid meteorology in Northwest China. These results also play an important role in promoting socio-economic development, agricultural modernization and construction of ecological civilization. In addition, the authors covered the main fields which are in urgent need to be studied and possible breakthrough might be made in arid meteorology research in Northwest China in the future.
Progress and prospects of climate change impacts on hydrology in the arid region of northwest China
[J].The arid region of Northwest China, located in the central Asia, responds sensitively to global climate change. Based on the newest research results, this paper analyzes the impacts of climate change on hydrology and the water cycle in the arid region of Northwest China. The analysis results show that: (1) In the northwest arid region, temperature and precipitation experienced "sharply" increasing in the past 50 years. The precipitation trend changed in 1987, and since then has been in a state of high volatility, during the 21st century, the increasing rate of precipitation was diminished. Temperature experienced a "sharply" increase in 1997; however, this sharp increasing trend has turned to an apparent hiatus since the 21st century. The dramatic rise in winter temperatures in the northwest arid region is an important reason for the rise in the average annual temperature, and substantial increases in extreme winter minimum temperature play an important role in the rising average winter temperature; (2) There was a significant turning point in the change of pan evaporation in the northwest arid area in 1993, i.e., in which a significant decline reversed to a significant upward trend. In the 21st century, the negative effects of global warming and increasing levels of evaporation on the ecology of the northwest arid region have been highlighted; (3) Glacier change has a significant impact on hydrology in the northwest arid area, and glacier inflection points have appeared in some rivers. The melting water supply of the Tarim River Basin possesses a large portion of water supplies (about 50%). In the future, the amount of surface water will probably remain at a high state of fluctuation. Copyright © 2015 Elsevier Inc. All rights reserved.
Characteristics of extreme climatic/hydrological events in the arid region of northwestern China
[J].
西北气候由暖干向暖湿转型的信号、影响和前景初步探讨
[J].
Preliminary study on signal, impact and foreground of climatic shift from warm-dry to warm-humid in northwest China
[J].
中国西北气候由暖干向暖湿转型的特征和趋势探讨
[J].
Discussion on the present climate change from warm-dry to warm-wet in northwest China
[J].
Recent and future climate change in northwest China
[J].
Impacts of climate change and irrigation on lakes in arid northwest China
[J].
Effects of changing climate on glacier shrinkage and river flow in the upper Heihe River Basin, China
[J].
Groundwater net discharge rates estimated from lake level change in Badain Jaran Desert, Northwest China
[J].
Shift trend and step changes for runoff time series in the Shiyang River Basin, northwest China
[J].
Responses of streamflow to climate change in the northern slope of Tianshan Mountains in Xinjiang: A case study of the Toutun River Basin
[J].
Modeling surface water-groundwater interaction in arid and semi-arid regions with intensive agriculture
[J].
Variation of runoff and runoff components of the upper Shule River in the northeastern Qinghai-Tibet Plateau under climate change
[J].Quantifying the impact of climate change on hydrologic features is essential for the scientific planning, management and sustainable use of water resources in Northwest China. Based on hydrometeorological data and glacier inventory data, the Spatial Processes in Hydrology (SPHY) model was used to simulate the changes of hydrologic processes in the Upper Shule River (USR) from 1971 to 2020, and variations of runoff and runoff components were quantitatively analyzed using the simulations and observations. The results showed that the glacier area has decreased by 21.8% with a reduction rate of 2.06 km2/a. Significant increasing trends in rainfall runoff, glacier runoff (GR) and baseflow indicate there has been a consistent increase in total runoff due to increasing rainfall and glacier melting. The baseflow has made the largest contribution to total runoff, followed by GR, rainfall runoff and snow runoff, with mean annual contributions of 38%, 28%, 18% and 16%, respectively. The annual contribution of glacier and snow runoff to the total runoff shows a decreasing trend with decreasing glacier area and increasing temperature. Any increase of total runoff in the future will depend on an increase of rainfall, which will exacerbate the impact of drought and flood disasters.
Runoff responses to climate change in arid region of northwestern China during 1960-2010
[J].
The changes of renewable water resources in China during 1956-2010
[J].
Substantial glacier mass loss in the Tien Shan over the past 50 years
[J].Farinotti, Daniel; Duethmann, Doris; Vorogushyn, Sergiy; Guentner, Andreas GFZ German Res Ctr Geosci, D-14473 Potsdam, Germany. Farinotti, Daniel Swiss Fed Inst Forest Snow & Landscape Res WSL, CH-8903 Birmensdorf, Switzerland. Longuevergne, Laurent Univ Rennes, CNRS, UMR Geosci 6118, Natl Ctr Sci Res, FR-35042 Rennes, France. Moholdt, Geir Norwegian Polar Res Inst, Fram Ctr, NO-9296 Tromso, Norway. Moelg, Thomas Friedrich Alexander Univ Erlangen Nurnberg FAU, Inst Geog, Climate Syst Res Grp, D-91058 Erlangen, Germany. Bolch, Tobias Univ Zurich, Dept Geog, CH-8057 Zurich, Switzerland. Bolch, Tobias Tech Univ Dresden, Inst Cartog, D-01062 Dresden, Germany.
High-resolution mapping of global surface water and its long-term changes
[J].
中国八大沙漠区湖泊时空分布数据集(2000—2019)
[J].
Spatial distributions of lakes across the eight largest deserts of China(2000-2019)
[J].
基于多源遥感数据和GEE平台的博斯腾湖面积变化及影响因素分析
[J].
DOI:10.12082/dqxxkx.2021.200361
[本文引用: 1]
作为典型的干旱区内陆湖泊,博斯腾湖的面积变化趋势与当地自然和人文环境的变迁密不可分。本文结合GIS与RS技术,利用Landsat影像和MODIS数据共2289景及JRC GSW水体掩膜产品,基于Google Earth Engine(GEE)平台采用指数法得出2000—2019年博斯腾湖面积年际和年内变化趋势,并采用2019年Sentinel-2影像进行结果对比分析,同时通过2000—2018年焉耆、库尔勒和巴音布鲁克气象站日值数据和人类活动分析其变化原因。得出如下结论:① 本结果中基于海量遥感数据提取面积的结果表明,GEE可以充分应用高时间分辨率遥感数据进行湖泊年际尤其是年内面积变化分析。相比于Landsat-5/7/8影像与MOD09GQ数据,由于Sentinel-2影像的时空分辨率优势,基于其所得的湖岸线可显示出较多细节。② 2000—2013年博斯腾湖面积共减少181.66 km<sup>2</sup>,变化速率为13.98 km/a;2013—2019年,湖泊共增加133.13 km<sup>2</sup>,变化速率为22.19 km<sup>2</sup>/a;③ 博斯腾湖面积一般在每年的3—6月呈上升趋势,且在当年6—9月保持峰值,面积在10—12月减小;④ 博斯腾湖面积年际变化与其流域内焉耆、库尔勒、巴音布鲁克气象站的降水、蒸发及积温因素变化的相关性未达到显著水平,而年内变化与上述气候要素相关性较高。
Area change and cause analysis of Bosten Lake based on multi-source remote sensing data and GEE platform
[J].
中国西北气候干湿变化研究进展
[J].
DOI:10.11821/dlyj020200328
[本文引用: 1]
西北地区对全球气候变化十分敏感,研究分析该地区干湿变化特征,对区域发展至关重要。本文从气象(降水、温度、蒸发)、水文(地表水、土壤湿度、陆地水储量)和植被等角度综述了近50年西北地区干湿变化特征。结果表明:西北整体气温升高,降水增加,呈暖湿化。但考虑陆面因素作用的分析表明该地区呈现东西部分化的格局。考虑蒸发因素的结果显示西部趋向暖湿化,而东部趋向暖干化。地表水资源和土壤湿度也显示西部增加、东部减少的态势。同时,西北西部植被状况正在明显改善。但陆地水储量显示,西北地区整体水资源仍十分匮乏,且处于不断减少的趋势。未来,西北地区气温仍将持续升高,降水、径流和土壤湿度也将会增加,整体向暖湿化转变。
Research progress in dry/wet climate variation in Northwest China
[J].Northwest China responds sensitively to global climate change. Research and analysis of the distribution of dry/wet conditions in this region are essential for regional development. This study provides a review of dry/wet changes in Northwest China over the past 50 years from meteorological perspectives (precipitation, temperature, and evaporation), hydrological perspectives (surface water runoff, soil moisture, and terrestrial water storage), and vegetation. The results showed that the climate is getting warm and wet with the increase of temperature and precipitation. However, the pattern of east-west differentiation is discovered by taking into account the effect of land surface factors. The result considering evaporation indicated that a trend of warm-wet occurred in the west of Northwest China, and a trend of warm-dry occurred in the east. Changes in surface water resources and soil moisture also showed an increase in the west and a decrease in the east. At the same time, the vegetation condition in the west is improving significantly. Moreover, the changes in terrestrial water storage proved that the overall water resources of the study area are still very scarce and in a decreasing trend. In the future, the temperature is expected to rise continuously, precipitation, runoff and soil moisture will also increase, and the region will shift to warmer and wetter conditions.
The first high-resolution meteorological forcing dataset for land process studies over China
[J].The China Meteorological Forcing Dataset (CMFD) is the first high spatial-temporal resolution gridded near-surface meteorological dataset developed specifically for studies of land surface processes in China. The dataset was made through fusion of remote sensing products, reanalysis datasets and in-situ station data. Its record begins in January 1979 and is ongoing (currently up to December 2018) with a temporal resolution of three hours and a spatial resolution of 0.1°. Seven near-surface meteorological elements are provided in the CMFD, including 2-meter air temperature, surface pressure, and specific humidity, 10-meter wind speed, downward shortwave radiation, downward longwave radiation and precipitation rate. Validations against observations measured at independent stations show that the CMFD is of superior quality than the GLDAS (Global Land Data Assimilation System); this is because a larger number of stations are used to generate the CMFD than are utilised in the GLDAS. Due to its continuous temporal coverage and consistent quality, the CMFD is one of the most widely-used climate datasets for China.
Rank correlation methods
[J].
Nonparametric tests against trend
[J].
The theil-Sen estimator with doubly censored data and applications to astronomy
[J].
Spatial patterns of climate change and associated climate hazards in Northwest China
[J].
The characteristics of ground-water resources and their changes under the impacts of human activity in the arid Northwest China—a case study of the Shiyang River Basin
[J].
The Nonlinear trend of runoff and its response to climate change in the Aksu River, Western China
[J].
Climate-induced changes in crop water balance during 1960-2001 in Northwest China
[J].
Analysis of the periods of maximum consecutive wet days in China
[J].
西北地区气候湿化趋势的新特征
[J].
New characteristics about the climate humidification trend in Northwest China
[J].
The response of lake variations to climate change in the past forty years: A case study of the northeastern Tibetan Plateau and adjacent areas, China
[J].
An automated method for extracting rivers and lakes from landsat imagery
[J].
Waterline extraction from Landsat TM data in a tidal flatA case study in Gomso Bay, Korea
[J].
近40年来中国西北内陆5个典型湖泊面积变化遥感分析
[J].
Remote sensing analysis on lake area variations of 5 typical lakes in the Northwest of China over the past 40 years
[J].
Longterm multisource satellite data fusion reveals dynamic expansion of lake water area and storage in a hyperarid basin of China
[J].
西北干旱区气候变化对水文水资源影响研究进展
[J].
DOI:10.11821/dlxb201409005
[本文引用: 1]
西北干旱区是对全球变化响应最敏感地区之一,研究分析全球变暖背景下的西北干旱区水资源问题,对应对和适应未来气候变化带来的影响具有重要意义。本文通过对西北干旱区气候变暖影响下的水资源形成、转化与水循环等关键问题最新研究成果的总结分析,得出如下结论:(1) 西北干旱区温度、降水在过去的50年出现过“突变型”升高,但进入21世纪,温度和降水均处于高位震荡,升高趋势减弱;(2) 西北干旱区冬季温度的大幅升高是拉动年均温度抬升的重要原因,而西伯利亚高压活动和二氧化碳排放是引起冬季升温的重要影响因素;(3) 西北干旱区蒸发潜力在1993年出现了一个明显的转折变化,由显著下降逆转为显著上升的趋势。气候变暖、蒸发水平增大对西北干旱区生态效应的负作用已经凸显;(4) 西北干旱区冰川变化对水资源量及年内分配产生了重要影响,部分河流已经出现冰川消融拐点。在塔里木河流域,冰川融水份额较大 (50%),可能在未来一段时期,河川径流还将处在高位状态波动。全球气候变暖在加大极端气候水文事件发生频率和强度的同时,加剧了西北干旱区内陆河流域的水文波动和水资源的不确定性。
Research progress on the impact of climate change on water resources in the arid region of Northwest China
[J].The arid region of Northwest China is a special natural unit, which responds sensitively to the global climate change. Studies on the impact of climate change on water resources in the arid region of Northwest China have a significant effect on the adaptability of future climate change. Based on the latest research results, this paper analyzes the impacts of climate change on the formation and transformation of water resources and water cycle in the arid region of Northwest China. The results can be shown as follows: (1) The air temperature and precipitation in the arid region of Northwest China had a significant increasing trend in the past 50 years, however, the sharp increasing trend has retarded since the 21st century. (2) The temperature change in winter could be the most important factor for the unusually sharp rise in annual air temperature in this region. Moreover, the Siberian High and carbon dioxide emissions could be the most important reasons for the higher rate of the winter temperature rise. (3) Pan evaporation in the region exhibited an obvious decreasing trend until the early 1990s (1993), however, the downward trend reversed to go upward since 1993. The negative effects of warming and increasing evaporation on ecology have been highlighted in the arid region of Northwest China. (4) The glacier change has exerted great impact on water resources and its annual distribution in the arid region of Northwest China, and many rivers have passed the "Glacier inflexion". In the Tarim River Basin, the proportion of glacier melt water to runoff is high (e.g., as much as 50%) and it is supposed that the runoff may show a great fluctuation in the near future. Global warming not only increases the frequency and intensity of hydrological extremes, but also intensifies the fluctuation and uncertainty of inland rivers.
