林齐根 , 刘燕仪, 刘连友, 王瑛
LIN Qigen, LIU Yanyi, LIU Lianyou, WANG Ying
通讯作者:
收稿日期: 2017-07-21
修回日期: 2017-08-31
网络出版日期: 2017-12-25
版权声明: 2017 《地球信息科学学报》编辑部 《地球信息科学学报》编辑部 所有
基金资助:
作者简介:
作者简介:林齐根(1991-),男,广东汕头人,博士生,研究方向为灾害风险评估模型。E-mail: linqigen@mail.bnu.edu.cn
展开
摘要
Newmark位移模型是研究地震滑坡易发性的经典模型,机器学习方法支持向量机模型也越来越多的应用到滑坡易发性评估研究。本文将Newmark位移模型与支持向量机模型相结合,建立基于物理机理的地震滑坡易发性评估模型并应用于2008年汶川地震重灾区汶川县。从震后遥感影像目视解译出汶川县1900处地震诱发滑坡,并将其随机划分为70%的训练数据集和30%的验证数据集。选择地形起伏度、坡度、地形曲率、与构造断裂带距离、与水系距离、与道路距离6个因子与Newmark位移值共同作为地震滑坡易发性影响因素。利用ROC曲线和模型不确定性等指标对模型结果进行评估,并与二元统计模型频率比和多元统计模型Logistic回归的结果进行对比。结果表明:与频率比和Logistic回归模型相比,支持向量机模型的正确率最高,训练集和验证集ROC曲线下的面积分别为0.876和0.851。将模型应用于绘制汶川县地震滑坡易发性图,结果显示滑坡易发性图与实际的滑坡点位分布一致性较高,有80.4%的滑坡位于极高和高易发区。这说明支持向量机与Newmark位移方法结合建立的地震滑坡易发性评估模型有较高的预测价值,可以为滑坡风险评估和管理提供依据。
关键词:
Abstract
The Newmark displacement model is a common physically based model for earthquake induced landslide susceptibility mapping. The machine learning model is one of the statistical methods and is increasingly applied to landslide susceptibility mapping in recent years. The main purpose of this paper is to combine the Newmark displacement method with machine learning model for developing a mechanism-based earthquake-induced landslide susceptibility model and improving the predictive accuracy. The support vector machine (SVM) method was selected and eight thematic data layers, including landslide inventory, topographic relief, slope, curvature, Newmark displacement value, distance from faults, distance from drainages and distance from roads, were prepared in GIS. A total of 1,900 landslides were subsequently randomly divided into two subsets: a training subset comprising 70% of the landslides and a validation subset containing the remaining 30%. The model is then applied to Wenchuan County, which was one of the most severely affected areas during the May 12, 2008 (Mw 7.9) Wenchuan earthquake in China. The model performance was evaluated using the receiver operation characteristic (ROC) curve and the model estimation uncertainty in comparison with the other two statistical methods: frequency ratio (FR) bivariate statistical model and the logistic regression (LR) multivariate statistical model. The results show that five variables including topographic relief, Newmark displacement value, distance from faults, distance from drainages and distance from roads are finally selected based on a significance level of 0.05 and the multi-collinearity detection. The values of the area under the ROC curve (AUC) demonstrate that the SVM model exhibited the highest accuracy for the training and validation data sets with AUC values of 0.876 and 0.851, respectively, followed by the LR model (AUC values of 0.836 and 0.842 for training and validation, respectively) and FR model (AUC values of 0.844 and 0.808 for training and validation, respectively). For the evaluation of the model prediction uncertainties, the pixels classified as high susceptibility (probability ≥ 0.75) and low susceptibility (probability < 0.25) are more valuable and practical, both of which have high reliability to determine whether the location is stable. The prediction variation is low for pixels classified as high susceptibility and low susceptibility (with an average of the standard deviation less than 0.05), indicating that the SVM and LR models consistently identified these pixels as stable or unstable. Furthermore, these high and low susceptibility pixels account for about 70% of all pixels for the SVM model, which is about 25% higher than that of LR model. It means that the SVM model performs better than the LR model in these high reliability pixels. For the pixels classified as intermediate susceptibility (probability 0.25 ~ 0.75), the standard deviation of the predictive probability of the SVM model is about 0.09, which is larger than that of the LR model. It indicates that the SVM model exhibited larger uncertainty than the LR model in these intermediate susceptibility pixels. However, it is difficult to determine whether these pixels are stable or not. Also, the pixels with intermediate susceptibility only account for about 30% of the total samples for the SVM model. In general, the SVM model combined with the Newmark displacement method outperform the LR model in accuracy and uncertainty evaluation. The proposed method was applied to produce the earthquake-triggered landslide susceptibility map of Wenchuan County. The comparison of landslide susceptibility map and actual landslide distribution showed that the high susceptibility areas can account for about 80.4% of the actual landslides. This indicates that the combination of support vector machine and the Newmark displacement method has a higher predictive value. The proposed method can potentially help risk assessment and effective management of landslides caused by earthquakes.
Keywords:
山区大地震经常诱发大量滑坡,并因此造成严重的人员伤亡和经济损失[1-2]。例如,2008年中国汶川地震诱发大约19万处滑坡[3],这些地震滑坡造成的死亡人口占地震总死亡人口的四分之一到三分之一[4-5]。因此,非常有必要开展地震滑坡易发性评估研究来为减轻地震滑坡灾害风险和灾后重建规划提供支持。
目前,滑坡易发性评估模型可以分为定性和定量模型2类[6-7]。定性模型基于专家经验知识对各滑坡影响因素赋予不同的权重来进行滑坡易发性评估,如加权线性组合[8]和层次分析法[9]。定性方法虽然可以获得较好的滑坡易发性评估结果,但是与专家的主观经验和知识有很大的关系,很难应用和推广到其他研究区[10-11]。
定量方法可以分为统计模型和基于物理机制的模型。统计模型假设在一定区域范围内,导致过去滑坡发生的影响因素也会导致未来滑坡的发生,通过分析滑坡影响因素与过去及现在滑坡分布的关系来评估滑坡易发性[12-17]。统计模型是应用最为广泛的滑坡易发性评估模型,近几年新兴的机器学习模型如支持向量机[18-20]、人工神经网络[21-22]和随机森林[23-24]等模型也被广泛应用于滑坡易发性评估研究中,并取得较好的结果。这其中支持向量机模型能够在训练样本较少的情况下,获得较高分类正确率,同时避免出现模型过拟合,在较小训练样本分类问题研究中有较大的优势[25]。基于物理机理的方法考虑滑坡发生过程的物理规律,据此构建相应的模型对滑坡灾害易发性进行模拟[26]。其中,Newmark位移模型[27]是研究地震诱发滑坡灾害的经典模型,该模型是由Newmark在对地震诱发水库垮坝危险进行物理成因定量分析过程中提出的。其理论基础是当地震发生时,区域斜坡受力产生的加速度超过临界加速度后,斜坡就会逐渐失去稳定,沿破坏面发生滑动,产生永久位移,永久位移值在一定程度上表征了震后滑坡发生的可能性大小。许多学者利用Newmark模型和强震动记录来估计地震诱发滑坡的位移,如Jibson等[28]利用Newmark模型计算1994年加利福尼亚Northridge地震Newmark位移值,分析Newmark位移值与实际滑坡的关系并将其应用于该地区地震滑坡易发性评估制图。但是,强震动记录通常较难获取,因此,一些学者[2,29]对其进行简化,使得Newmark位移模型更易于应用到区域地震滑坡易发性评估,如Capolongo等[30]利用简化的Newmark模型,结合蒙特卡罗随机模拟,对意大利南部的地震滑坡进行了易发性评估;Wang等[31]利用Newmark模型计算了台湾集集地震后的灾区Newmark位移并进行地震滑坡易发性制图。
本文将支持向量机模型和Newmark方法结合,综合2类模型的优势进行区域地震滑坡易发性评估。以2008年汶川地震重灾区汶川县为研究区,选择地形起伏度、坡度、地形曲率、与构造断裂带距离、与水系距离、与道路距离6个因子与Newmark位移值共同作为地震滑坡易发性影响因素,将支持向量机模型与Newmark位移模型相结合建立地震滑坡易发性模型。采用ROC曲线和模型不确定性等指标评估其结果,并与频率比和Logistic回归模型的结果进行对比,探讨建立更有效准确的地震滑坡易发性评估模型。
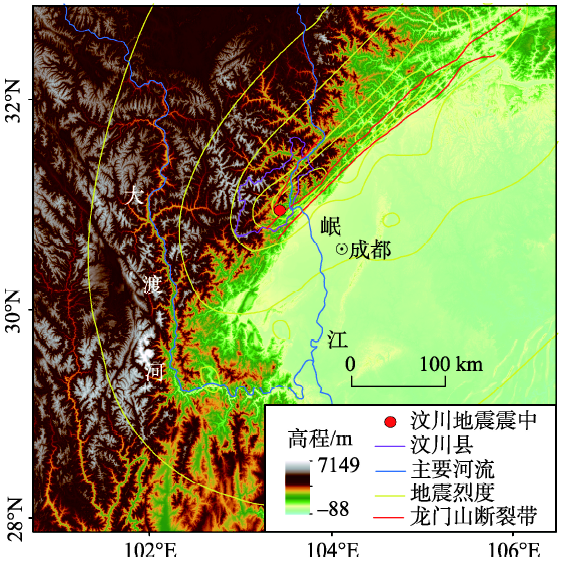
汶川县位于2008年汶川地震震中,是汶川地震极重灾区(图1)。地势北高东南低,海拔高度为787~6204 m。地形陡峭,县内平均坡度为32.1°,最大坡度为84.4°。年平均降水量约1200 mm,雨季经常在7-9月。主要水系岷江由于侵蚀率较高,形成高深峡谷,东北部为活跃断层区龙门山断裂带[32]。汶川县的地层岩性主要包括位于河谷地区的前震旦系、泥盆系、三叠系、志留系、第四纪坡积和残坡积物、凝灰岩、砂岩、灰岩、粉砂岩夹页岩和煤层等,此外还分布有千枚岩夹灰岩、花岗岩;汶川县西部的自然保护区及岷江东部的高山区地层基岩为晋宁期花岗岩、志留系千枚岩夹砂质灰岩、泥盆系灰岩等。汶川县地层岩性变化大,岩体工程地质特性在空间上变化复杂,以第四系松散地层及强风化岩浆岩为代表的软弱土体分布广泛,为汶川县地质灾害的发育提供了基本条件。
本文汶川县地震滑坡编目数据从《汶川地震灾区航天遥感应急调查》图集获得[33]。该图集综合光学(SPOT-5,IKONOS,Quickbird和World-View)和微波(Cosmo-SkyMed和TerraSAR-X)等遥感数据。利用遥感影像的空间,光谱和时间特征进行目视解译,综合实地考察获得汶川县1900处地震诱发滑坡,如图2(a)所示。
支持向量机(Support Vector Machine, SVM)是基于统计学习理论的监督学习方法[34]。支持向量机能够在样本较少的情况下比较好的解决非线性及高维模式识别问题,已经被广泛应用于滑坡易发性评估研究中[18-20]。Yao等[18]对支持向量机模型应用于滑坡易发性评估建模有详细的介绍,其过程总结如下:
给定一些线性可分的数据点xi(i=1, 2,…,n),它们分别属于2个不同的类yi=±1。支持向量机的目标是要在n维的数据空间中找到一个可以基于最大间隔将2类数据分开的超平面(hyper plane),如 式(1)所示。
该式需满足如下条件:
式中:||w||是超平面的范数;b是标量基;(·)是标量基运算。基于拉格朗乘数,成本函数可以表达为:
式中:λi是拉格朗日乘数,可以通过拉格朗日对偶性求解。
对于不可分离的情况,其限制条件可以引入松弛变量ξi[34],如式(4)所示。
此时,式(1)变为:
其中,引入v(0,1]以考虑误分类的情况。此外,Vapnik引入核函数K(xi, xj)以解释非线性决策边界的问题[34]。
支持向量机模型应用于滑坡易发性评估研究中,核函数的选择对模型有较大影响,需要选择合理的核函数,以将线性不可分的数据映射到一个高维特征空间中使之线性可分。线性、多项式、高斯和sigmoid是较为常用的几类核函数。许冲等[19]研究表明高斯核函数的结果最好,因此,本文选择高斯核函数,其表达式如式(6)所示。
在本文中,+1和-1分别表示滑坡和非滑坡。使用高斯核函数,对二分类支持向量机模型进行了训练,然后应用该训练模型绘制滑坡易发性图,所有的分析过程在R语言中实现。
统计模型需要由2个独立样本集分别用于模型训练和验证[35]。因此,将1900个滑坡随机划分为2个子集,分别用于训练和验证模型,如图2(a)所示。其中利用70%的滑坡(1330个滑坡)作为训练样本来建立模型,剩余30%的滑坡(570个滑坡)作为验证样本,用于评估模型预测能力。对于非滑坡样本的选取,参考已有文献的研究[36-37],分别选取与训练集和验证集滑坡数量相同的非滑坡样本。因此,从非滑坡地区随机选取了1330和570个非滑坡,组成训练和验证数据集。
Newmark位移模型是研究地震诱发滑坡灾害的经典模型,本文选择Jibson等[2]建立的Newmark对数回归方程,计算汶川地震后造成的滑坡位移值,如式(7)所示。
式中:Dn为Newmark位移值;Ia为地震强度数据; ac为临界加速度。
地震强度Ia,采用Wilson[38]提出的区域衰减经验公式,如式(8)所示。
式中:Ia为地震强度;M为矩震级;r为震源距;ac为临界加速度。其中ac计算公式如式(9)所示。
式中:Fs为静态安全系数;g为重力加速度;
本文选择地形起伏度、坡度、地形曲率、与构造断裂带距离、与水系距离、与道路距离6个影响因子与Newmark位移模型计算的Newmark位移值(Dn)共同作为地震滑坡易发性影响因素。
岩性类型及各岩性的工程岩组参数从文献[39]和工程岩体分级国家标准获得(图2(b))。基于3.2节的Newmark位移模型可以计算得到研究区Newmark位移值分布图,如图2(c)所示。
地形数据来自SRTM 30 m分辨率的DEM数据。基于30 m分辨率的DEM数据,利用ArcGIS空间分析模块可以分别计算地形起伏度、坡度和地形曲率,如图2(d)-(f)所示。水系网络利用ArcGIS水文分析模块生成,道路网络从星球地图出版社 1:35 000道路图集数字化,利用ArcGIS欧氏距离工具可以分别计算出距水系距离、距道路距离和距构造断裂带距离,如图2(g)-(i)所示。据此,可以得到6个地震滑坡影响因素分布图。
为了评估支持向量机模型和Newmark模型结合的效果,选取二元统计模型频率比和多元统计模型Logistic回归分别都与Newmark模型结合,对比支持向量机模型与另外2类统计模型与Newmark模型结合进行地震滑坡易发性评估的效果。
频率比模型分析滑坡分布与滑坡影响因素之间的关系,各滑坡影响因素类别的频率比根据滑坡在各影响因素类别中的发生概率与不发生概率的比值计算得到。频率比越大,滑坡发生与该类影响因素类别之间的关系越密切。频率比为1是平均值,如果频率比大于1,则与滑坡发生呈正相关,小于1则与滑坡发生呈负相关。将各滑坡影响因素的频率比相加[40],可以计算得到滑坡易发性指数,如式(10)所示。
式中:FR为各影响因素类别的频率比。
Logistic回归模型是研究影响因素与因变量之间关系的常用方法,被广泛应用于滑坡易发性评估研究[41],其表达式如下:
式中:P为因变量,是自变量因子相对于某一事件的发生概率,取值范围为[0, 1];xi(i=1, 2,…, k)是自变量因子,是影响事件发生的因素;k为自变量个数; βi是偏回归系数,反映自变量因子xi对P的影响程度大小。
对于这7个地震滑坡影响因素,首先应用逐步Logistic回归方法,根据显著性水平<0.05选择影响因子。应用方差膨胀因子(VIF)检测影响因素之间的多重共线性。当VIF值大于10时,说明解释变量之间存在显著的多重共线性。基于逐步回归方法选择和VIF检测后的影响因素最终进入三类统计模型中分析。
采用ROC曲线、混淆矩阵和模型不确定性对 3类统计模型分别与Newmark模型结合进行地震滑坡易发性制图的效果进行评估。ROC曲线通过绘制不同易发性阈值处的真实阳性率和假阳性率来计算模型预测的拟合优度。ROC曲线下的面积(AUC)范围为0.5~1,较高的值表示模型预测能力更好。AUC值小于0.7表示预测效果较差,0.7~0.8表示预测效果中等,0.8~0.9表示预测效果较好,0.9以上表示预测效果非常好[42]。
通过训练和验证数据集ROC曲线下的面积来评估3类统计模型分别与Newmark模型结合的表现。对于Logistic回归和支持向量机模型,基于“自助”重采样方法对模型不确定性进行评估[43]。在R语言中进行1000次重采样,每次分别选择了相应的滑坡和非滑坡点,基于1000重采样计算的滑坡发生概率平均值(μ)和标准偏差(σ)来评估模型的稳健性。
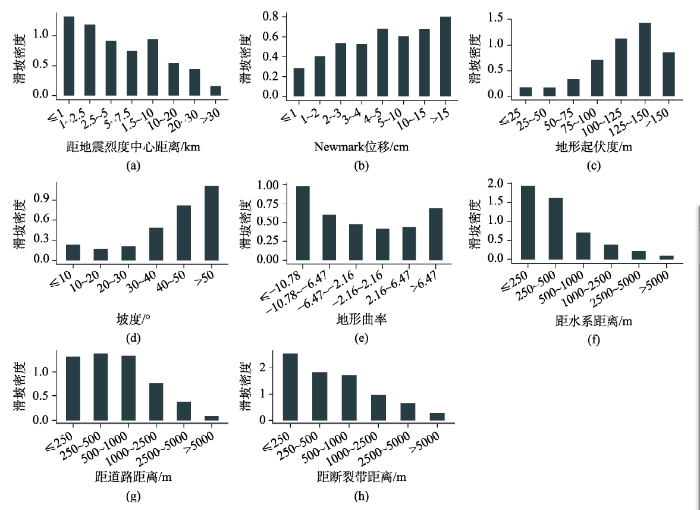
图3为地震滑坡分布与各影响因素的关系。由图3(a)-(h)可看出,随着Newmark位移值,地形起伏度和坡度的增加,滑坡密度也呈增加趋势;随着距地震烈度中心、距道路和距水系距离的增加,滑坡密度呈减小趋势。对于地形曲率因素,凹坡和凸坡区域的滑坡密度大于平坦地区。因为地震烈度因素是地震诱发滑坡之后,根据建筑物破坏的程度、地表变化的状况等方面的宏观考察和描述评定的,即地震滑坡发生的密集程度会对该区域地震烈度评定有影响,因此,仅分析滑坡分布及其关系,未将其作为影响因素引入模型。
图3 滑坡分布与地震烈度、各影响因素的关系
Fig. 3 The relationship among the landslide distribution, the seismic intensity and the influencing factors
表1的结果显示,坡度和地形曲率因素的Sig. 值大于0.05,没有通过显著性检验。分析坡度和地形曲率因素没有通过显著性检验的原因,可能因为研究区范围较大,坡度和地形曲率均为微观地形因子,对地形的描述不如宏观地形因子地形起伏度。Newmark位移、地形起伏度、距断裂带距离、距水系距离和距道路距离5个影响因素通过检验。从VIF值可以看出,这5个影响因素之间没有存在多重共线性。因此,将Newmark位移、地形起伏度、距断裂带距离、距水系距离和距道路距离5个影响因素引入支持向量机、频率比和Logistic回归模型,进行地震滑坡易发性评估建模。
表1 逐步Logistic回归模型和VIF多重共线性检验结果
Tab. 1 Results of stepwise logistic regression model and the VIF detection
| 影响因素 | Coefficients | Std. Error | Sig. | VIF |
|---|---|---|---|---|
| Newmark位移 | 0.091 | 0.040 | 0.023 | 1.246 |
| 地形起伏度 | 1.728 | 0.125 | 0.000 | 1.040 |
| 距断裂带距离 | -0.504 | 0.045 | 0.000 | 1.308 |
| 距水系距离 | -0.469 | 0.043 | 0.000 | 1.311 |
| 距道路距离 | -0.293 | 0.043 | 0.000 | 1.365 |
| 坡度 | 0.011 | 0.237 | 0.962 | 3.820 |
| 地形曲率 | -0.005 | 0.010 | 0.581 | 1.002 |
| 常数 | 2.420 | 0.639 | 0.000 |
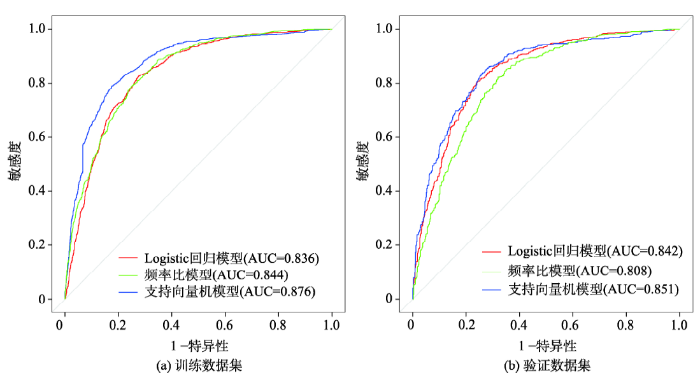
采用ROC曲线来评估模型的训练和验证效果。由图4可看出,与频率比和Logistic回归模型相比,机器学习模型支持向量机与Newmark位移方法结合进行地震滑坡易发性评估的正确率最高,训练集和验证集ROC曲线下的面积分别为0.876和0.851,Logistic回归模型分别为0.836和0.842,频率比模型为0.844和0.808,这说明支持向量机模型与Newmark位移方法能提高地震滑坡易发性模型正确率。
图4 训练模型和验证模型的ROC曲线和AUC值
Fig. 4 ROC curves and the AUC values for training models and validation models
虽然在验证数据集上支持向量机模型ROC曲线下的面积只比Logistic回归模型高0.01,但是从混淆矩阵分类结果看,以0.5为分割值,概率大于等于0.5预测为滑坡,概率小于0.5为非滑坡。验证数据集上支持向量机模型和Logistic回归模型正确分类的滑坡个数分别为460处和434处,多正确判断出16处滑坡(训练数据集上多正确判断出84处滑坡),这对于实际减轻滑坡灾害风险有重要意义。
图5对支持向量机模型和Logistic回归模型不确定性进行评估,图5中x轴为1000次自助重采样预测的滑坡平均发生概率(μ),y轴为预测变率(1000次自助重采样预测滑坡概率标准差σ)。分类为高易发性(概率≥0.75)和低易发性(概率<0.25)的样本更有价值和实际意义,这两类区域都有较高的可靠性直接确定该位置是否发生滑坡。从图5可看出,在高易发性和低易发性这2类区域中,支持向量机模型和Logistic回归模型的预测结果变率都非常小(图5),标准差小于0.05(表2),即2个模型在多次重采样中均一致地将这些样本判断为高易发性或低易发性,结果可靠。并且支持向量机在可靠性较高的高易发性和低易发性中的样本约占70%,比Logistic回归模型高约25%,这说明支持向量机模型在这部分的预测效果更好。对于预测为中等易发性(概率0.25~0.75)的样本,支持向量机模型的预测概率标准差约0.09(表2),比Logistic回归模型预测变率偏大,说明支持向量机模型在这个预测概率范围内的不确定性大于Logistic回归模型的预测。但是对于中等易发性的区域,一方面将其划分为滑坡或非滑坡均有一定的风险,另一方面支持向量机模型分类为中等易发性的样本比例相对较小,仅占总样本约30%(表2)。
表2 模型不确定性评估结果
Tab. 2 Results of model uncertainty evaluation
| 滑坡平均 发生概率 | 支持向量机模型 | Logistic回归模型 | |||||
|---|---|---|---|---|---|---|---|
| 预测标准 差均值 | 样本量 | 占比 /% | 预测标准 差均值 | 样本量 | 占比 /% | ||
| <0.25 | 0.029 | 1318 | 34.7 | 0.013 | 853 | 22.4 | |
| 0.25~0.5 | 0.091 | 469 | 12.3 | 0.019 | 1071 | 28.2 | |
| 0.5~0.75 | 0.090 | 677 | 17.8 | 0.022 | 994 | 26.2 | |
| ≥0.75 | 0.041 | 1336 | 35.2 | 0.015 | 882 | 23.2 | |
因此,从模型预测的精度对比,支持向量机模型结果更好;从模型预测的不确定性方面对比,支持向量机模型的预测更具有选择性,在预测价值大的高和低易发性级别占比大,且预测效果稳定,在中等易发性预测变率偏大,但占比小。而Logistic回归模型在各级别都较稳定,但各级别占比基本一致,预测选择性不如支持向量机模型。总的来说,支持向量机模型与Newmark位移方法结合的整体效果优于Logistic回归模型。
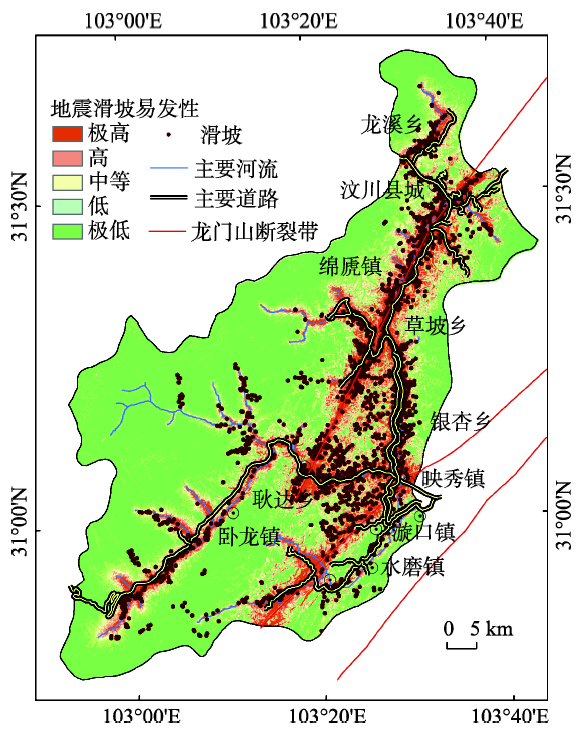
将支持向量机模型与Newmark位移方法结合建立的地震滑坡易发性评估模型应用于汶川县,制作汶川县地震滑坡易发性图。采用自然断点法将滑坡易发性分为5类,包括极低、低、中等、高和极高易发性(图6)。由图6可看出,地震滑坡易发性图与实际的滑坡点位分布一致性较高。各易发性级别的滑坡分布统计结果如表3所示。有80.4%的滑坡位于占地面积仅有23%的极高和高易发区。极低和低易发区占67%的面积,仅有约11%的滑坡。这说明支持向量机与Newmark位移方法结合建立的地震滑坡易发性评估模型有较高的预测价值。
图6 汶川县地震滑坡易发性分布图
Fig. 6 Earthquake-triggered landslide susceptibility map of Wenchuan County
表3 各易发性级别滑坡分布
Tab. 3 Distribution of landslide in each susceptibility level
| 滑坡易 发性 | 面积/ km² | 面积 占比/% | 滑坡 数量 | 滑坡 占比/% | 滑坡密度/ (个/km²) |
|---|---|---|---|---|---|
| 极高 | 548.38 | 13.29 | 1226 | 64.37 | 2.23 |
| 高 | 402.09 | 9.74 | 302 | 15.89 | 0.75 |
| 中等 | 400.03 | 9.69 | 152 | 8.00 | 0.38 |
| 低 | 588.20 | 14.25 | 113 | 5.95 | 0.19 |
| 极低 | 2187.81 | 53.02 | 107 | 5.63 | 0.05 |
本文选择地形起伏度、坡度、地形曲率、与断裂带距离、与水系距离、与道路距离6个因子与Newmark位移值共同作为地震滑坡易发性影响因素,将基于物理机理的Newmark位移模型与机器学习方法支持向量机相结合,建立基于物理机理的地震滑坡易发性评估模型并应用于2008年汶川地震重灾区汶川县,得出以下结论:
(1)支持向量机模型可以与Newamrk位移方法有效结合,将两者结合建立的地震滑坡易发性评估模型正确率高,训练和验证数据集ROC曲线的评价精度分别达到0.876和0.851。将其应用于汶川县进行地震滑坡易发性制图,极高和高易发性区可以解释80%以上的滑坡,说明该模型,具有较大的应用价值。
(2)ROC曲线在训练和验证数据集的评估结果说明,支持向量机模型与Newamrk位移方法结合的效果要优于频率比模型和Logistic回归模型。
(3)在不同滑坡易发性级别上,支持向量机模型与Logistic回归模型的表现不同。支持向量机模型的预测在各级别上的分选性较好,在预测价值较大的高和低易发性级别占比较大,约70%,且预测稳定性较好,而在预测价值较小的中等易发性级别预测变率较大,但占比较低;Logistic回归模型在高、中和低易发性级别上预测变率较小,预测更稳定,但各易发性级别的预测样本比例基本一致,分选性较差。
The authors have declared that no competing interests exist.
| [1] |
Landslides caused by earthquakes [J]. |
| [2] |
Regression models for estimating coseismic landslide displacement [J].https://doi.org/10.1016/j.enggeo.2007.01.013 URL [本文引用: 3] 摘要
Newmark's sliding-block model is widely used to estimate coseismic slope performance. Early efforts to develop simple regression models to estimate Newmark displacement were based on analysis of the small number of strong-motion records then available. The current availability of a much larger set of strong-motion records dictates that these regression equations be updated. Regression equations were generated using data derived from a collection of 2270 strong-motion records from 30 worldwide earthquakes. The regression equations predict Newmark displacement in terms of (1) critical acceleration ratio, (2) critical acceleration ratio and earthquake magnitude, (3) Arias intensity and critical acceleration, and (4) Arias intensity and critical acceleration ratio. These equations are well constrained and fit the data well (71% < R 2 < 88%), but they have standard deviations of about 0.5 log units, such that the range defined by the mean 卤 one standard deviation spans about an order of magnitude. These regression models, therefore, are not recommended for use in site-specific design, but rather for regional-scale seismic landslide hazard mapping or for rapid preliminary screening of sites.
|
| [3] |
Three (nearly) complete inventories of landslides triggered by the May 12, 2008 Wenchuan Mw 7.9 earthquake of China and their spatial distribution statistical analysis [J].https://doi.org/10.1007/s10346-013-0404-6 URL Magsci [本文引用: 1] 摘要
The May 12, 2008 Wenchuan earthquake of China (Mw 7.9 or Ms 8.0) triggered hundreds of thousands of landslides. Mapping such a large number of landslides is a major task, considering the large size of
|
| [4] |
汶川8.0级地震触发崩滑灾害机制及其地质力学模式 [J].
<FONT face=Verdana>汶川8.0级地震由于地震震级高、持续时间长、震区地形地质环境复杂,因而所触发的崩塌、滑坡不仅数量巨大,而且成因机制也极为复杂,具有与通常重力环境下斜坡失稳机制迥异的特征,许多现象非常特殊并超越了人们过去的认识。通过现场调查,发现强震触发崩滑灾害具有以下特殊的动力过程,即独特的震动溃裂现象,特殊的溃滑失稳机制,超强的动力特性和大规模的高速抛射与远程运动,大量山体震裂松动等。为此,定义了若干新的词语,如震裂、溃滑、溃崩、抛射等来描述这些独特的动力过程,并在此基础上,结合具体斜坡结构,提出了对汶川地震触发崩塌、滑坡成因机制的分类体系,这一体系包括五大类、14种类型。重点分析了一些典型类型斜坡失稳的发生过程,地质力学机制及相应的“概念模型”,尤其是与大型滑坡发生最为密切的溃滑型滑坡的发生过程及动力机制,初步较为系统的揭示了汶川8.0级地震触发地质灾害的成因机制、地质模式和动力特征。</FONT>
Mechanism and geo-mechanical modes of landslide hazards triggered by Wenchuan 8.0 Earthquake [J].
<FONT face=Verdana>汶川8.0级地震由于地震震级高、持续时间长、震区地形地质环境复杂,因而所触发的崩塌、滑坡不仅数量巨大,而且成因机制也极为复杂,具有与通常重力环境下斜坡失稳机制迥异的特征,许多现象非常特殊并超越了人们过去的认识。通过现场调查,发现强震触发崩滑灾害具有以下特殊的动力过程,即独特的震动溃裂现象,特殊的溃滑失稳机制,超强的动力特性和大规模的高速抛射与远程运动,大量山体震裂松动等。为此,定义了若干新的词语,如震裂、溃滑、溃崩、抛射等来描述这些独特的动力过程,并在此基础上,结合具体斜坡结构,提出了对汶川地震触发崩塌、滑坡成因机制的分类体系,这一体系包括五大类、14种类型。重点分析了一些典型类型斜坡失稳的发生过程,地质力学机制及相应的“概念模型”,尤其是与大型滑坡发生最为密切的溃滑型滑坡的发生过程及动力机制,初步较为系统的揭示了汶川8.0级地震触发地质灾害的成因机制、地质模式和动力特征。</FONT>
|
| [5] |
Landslide hazards triggered by the 2008 Wenchuan earthquake, Sichuan, China [J].https://doi.org/10.1007/s10346-009-0148-5 URL Magsci [本文引用: 1] 摘要
The 2008 Wenchuan earthquake (Ms=8.0; epicenter located at 31.0°N, 103.4°E), with a focal depth of 19.0 km was triggered by the reactivation of the Longmenshan fault in Wenchuan County, Sichuan Province, China on 12 May 2008. This earthquake directly caused more than 15,000 geohazards in the form of landslides, rockfalls, and debris flows which resulted in about 20,000 deaths. It also caused mo...
|
| [6] |
Landslide risk assessment and management: an overview [J].https://doi.org/10.1016/S0013-7952(01)00093-X URL Magsci [本文引用: 1] 摘要
This article reviews recent advances in landslide risk assessment and management, and discusses the applicability of a variety of approaches to assessing landslide risk. Firstly, a framework for landslide risk assessment and management by which landslide risk can be reduced is proposed. This is followed by a critical review of the current state of research on assessing the probability of landsliding, runout behavior, and vulnerability. Effective management strategies for reducing economic and social losses due to landslides are described. Problems in landslide risk assessment and management are also examined.
|
| [7] |
Recommendations for the quantitative analysis of landslide risk [J].https://doi.org/10.1007/s10064-013-0538-8 URL Magsci [本文引用: 1] 摘要
This paper presents recommended methodologies for the quantitative analysis of landslide hazard, vulnerability and risk at different spatial scales (site-specific, local, regional and national), as well as for the verification and validation of the results. The methodologies described focus on the evaluation of the probabilities of occurrence of different landslide types with certain characteristics. Methods used to determine the spatial distribution of landslide intensity, the characterisation of the elements at risk, the assessment of the potential degree of damage and the quantification of the vulnerability of the elements at risk, and those used to perform the quantitative risk analysis are also described. The paper is intended for use by scientists and practising engineers, geologists and other landslide experts.
|
| [8] |
Landslide susceptibility mapping using GIS-based weighted linear combination, the case in Tsugawa area of Agano River, Niigata Prefecture, Japan [J].https://doi.org/10.1007/s10346-003-0006-9 URL Magsci [本文引用: 1] 摘要
A spatial database of 791 landslides is analyzed using GIS to map landslide susceptibility in Tsugawa area of Agano River. Data from six landslide-controlling parameters namely lithology, slope gradient, aspect, elevation, and plan and profile curvatures are coded and inserted into the GIS. Later, an index-based approach is adopted both to put the various classes of the six parameters in order of their significance to the process of landsliding and weigh the impact of one parameter against another. Applying primary and secondary-level weights, a continuous scale of numerical indices is obtained with which the study area is divided into five classes of landslide susceptibility. Slope gradient and elevation are found to be important to delineate flatlands that will in no way be subjected to slope failure. The area which is at high scale of susceptibility lies on mid-slope mountains where relatively weak rocks such as sandstone, mudstone and tuff are outcropping as one unit.
|
| [9] |
Application of the analytical hierarchy process (AHP) for landslide susceptibility mapping: A case study from the Tinau watershed, west Nepal [J].https://doi.org/10.1016/j.cageo.2012.11.003 URL [本文引用: 1] 摘要
Landslide problems are abundant in the mountainous areas of Nepal due to a unique combination of adverse geological conditions, abundant rainfall and anthropogenic factors, which leads to enormous loss of life and property every year. To control such problems, systematic studies of landslides are necessary, including inventory mapping and risk assessment. This study applies the analytical hierarchy process method in the Tinau watershed, Nepal. A landslide susceptibility map is prepared on the basis of available digital data of topography, geology, land-use and hydrology. The landslide susceptibility map is validated through physical and statistical methods. The results reveal that the predicted susceptibility levels are found to be in good agreement with the past landslide occurrences, and, hence, the map is trustworthy for future land-use planning. (C) 2012 Elsevier Ltd. All rights reserved.
|
| [10] |
Comparison of two landslide susceptibility assessments in the Champagne-Ardenne region (France) [J].https://doi.org/10.1016/j.geomorph.2009.09.042 URL [本文引用: 1] 摘要
With regard to the variables assumed to be important environmental factors controlling landslides, the two models are in agreement. They both indicate that present and future landslides are mainly controlled by slope gradient and lithology. However, the comparison of the two landslide susceptibility maps through (1) an evaluation with the location of mapped ‘old’ landslides and through (2) a temporal validation with spatial data of ‘recent’ (1960–1999; n 02=0248) and ‘very recent’ (2000–2008; n 02=0246) landslides showed a better prediction capacity for the statistical model produced in this study compared to the heuristic model. In total, the statistically-derived landslide susceptibility map succeeded in correctly classifying 81.0% of the ‘old’ and 91.6% of the ‘recent’ and ‘very recent’ landslides. On the susceptibility map derived from the heuristic model, on the other hand, only 54.6% of the ‘old’ and 64.0% of the ‘recent’ and ‘very recent’ landslides were correctly classified as unstable. Hence, the landslide susceptibility map obtained from logistic regression is a better tool for regional landslide susceptibility analysis in the study area of the Montagne de Reims. The accurate classification of zones with very high and high susceptibility allows delineating zones where viticulturists should be informed and where implementation of precaution measures is needed to secure slope stability.
|
| [11] |
Evaluation of environmental parameters in logistic regression models for landslide susceptibility mapping [J].https://doi.org/10.1080/17538947.2011.586443 URL Magsci [本文引用: 1] 摘要
The aim of this study was to determine how well the landslide susceptibility parameters, obtained by data-dependent statistical models, matched with the parameters used in the literature. In order to achieve this goal, 20 different environmental parameters were mapped in a well-studied landslide-prone area, the Asarsuyu catchment in northwest Turkey. A total of 4400 seed cells were generated from 47 different landslides and merged with different attributes of 20 different environmental causative variables into a database. In order to run a series of logistic regression models, different random landslide-free sample sets were produced and combined with seed cells. Different susceptibility maps were created with an average success rate of nearly 80%. The coherence among the models showed spatial correlations greater than 90%. Models converged in the parameter selection peculiarly, in that the same nine of 20 were chosen by different logistic regression models. Among these nine parameters, lithology, geological structure (distance/density), landcover-landuse, and slope angle were common parameters selected by both the regression models and literature. Accuracy assessment of the logistic models was assessed by absolute methods. All models were field checked with the landslides resulting from the 12 November 1999, Kayna li Earthquake (Ms = 7.2).
|
| [12] |
GIS techniques and statistical models in evaluating landslide hazard [J].https://doi.org/10.1002/esp.3290160505 URL [本文引用: 1] 摘要
Abstract Geographical Information Systems (GIS) and numerical cartography may greatly facilitate the development and use of statistical models for the assessment of regional landslide hazard. From a small drainage basin located in Central Italy, relevant geological and geomorphological factors were collected and processed by applying GIS technology. In particular, modules were used which both generate high-fidelity digital terrain models and automatically partition the terrain into main slope-units. The resulting information was then analysed by discriminant analysis which enabled landslide hazard and risk to be evaluated in each slope-unit. Although not lacking drawbacks, the method proved to be a feasible and cost-effective approach to landslide susceptibility assessment and mapping.
|
| [13] |
Use of GIS technology in the prediction and monitoring of landslide hazard [J].https://doi.org/10.1023/A:1008097111310 URL 摘要
Technologies such as Geographical Information Systems (GIS) have raised great expectations as potential means of coping with natural disasters, including landslides. However, several misconceptions on the potential of GIS are widespread. Prominent among these is the belief that a landslide hazard map obtained by systematic data manipulation within a GIS is assumed to be more objective than a comparable hand-made product derived from the same input data and founded on the same conceptual model. Geographical data can now be handled in a GIS environment by users who are not experts in either GIS or natural hazard process fields. The reality of the successful application of GIS within the landslide hazard domain seems to be somewhat less attractive than current optimistic expectations.In spite of recent achievements, the use of GIS in the domain of prevention and mitigation of natural catastrophes remains a pioneering activity. Diffusion of the technology is still hampered by factors such as the difficulty in acquiring appropriate raw data, the intrinsic complexity of predictive models, the lack of efficient graphical user interfaces, the high cost of digitisation, and the persistence of bottlenecks in hardware capabilities.In addition, researchers are investing more in tuning-up hazard models founded upon existing, often unreliable data than in attempting to initiate long-term projects for the acquisition of new data on the causes of catastrophic events. Governmental institutions are frequently involved in risk reduction projects whose design and implementation appear to be governed more by political issues than by technical ones. There is an unfortunate general tendency to search for data which can be collected at low cost rather than attempting to capture the information which most readily explains the causes of a disaster.If the technical, cultural, economic and political reasons for this unhealthy state cannot be adequately tackled, the International Decade for Natural Disaster Reduction will probably come to an end without achieving significant advances in the prediction and control of natural disasters.
|
| [14] |
Landslide hazard evaluation: A review of current techniques and their application in a multi-scale study, Central Italy [J].https://doi.org/10.1016/S0169-555X(99)00078-1 URL 摘要
In recent years, growing population and expansion of settlements and life-lines over hazardous areas have largely increased the impact of natural disasters both in industrialized and developing countries. Third world countries have difficulty meeting the high costs of controlling natural hazards through major engineering works and rational land-use planning. Industrialized societies are increasingly reluctant to invest money in structural measures that can reduce natural risks. Hence, the new issue is to implement warning systems and land utilization regulations aimed at minimizing the loss of lives and property without investing in long-term, costly projects of ground stabilization. Government and research institutions worldwide have long attempted to assess landslide hazard and risks and to portray its spatial distribution in maps. Several different methods for assessing landslide hazard were proposed or implemented. The reliability of these maps and the criteria behind these hazard evaluations are ill-formalized or poorly documented. Geomorphological information remains largely descriptive and subjective. It is, hence, somewhat unsuitable to engineers, policy-makers or developers when planning land resources and mitigating the effects of geological hazards. In the Umbria and Marche Regions of Central Italy, attempts at testing the proficiency and limitations of multivariate statistical techniques and of different methodologies for dividing the territory into suitable areas for landslide hazard assessment have been completed, or are in progress, at various scales. These experiments showed that, despite the operational and conceptual limitations, landslide hazard assessment may indeed constitute a suitable, cost-effective aid to land-use planning. Within this framework, engineering geomorphology may play a renewed role in assessing areas at high landslide hazard, and helping mitigate the associated risk.
|
| [15] |
Occurrence probability assessment of earthquake-triggered landslides with newmark displacement values and logistic regression: The Wenchuan earthquake, China [J].https://doi.org/10.1016/j.geomorph.2016.01.004 URL 摘要
The Newmark displacement model has been used to predict earthquake-triggered landslides. Logistic regression (LR) is also a common landslide hazard assessment method. We combined the Newmark displacement model and LR and applied them to Wenchuan County and Beichuan County in China, which were affected by theMs.8.0 Wenchuan earthquake on May 12th, 2008, to develop a mechanism-based landslide occurrence probability model and improve the predictive accuracy. A total of 1904 landslide sites in Wenchuan County and 3800 random non-landslide sites were selected as the training dataset. We applied the Newmark model and obtained the distribution of permanent displacement (Dn) for a 30脳30m grid. Four factors (Dn, topographic relief, and distances to drainages and roads) were used as independent variables for LR. Then, a combined model was obtained, with anAUC(area under the curve) value of 0.797 for Wenchuan County. A total of 617 landslide sites and non-landslide sites in Beichuan County were used as a validation dataset withAUC=0.753. The proposed method may also be applied to earthquake-induced landslides in other regions.
|
| [16] |
基于DEM的福建省土质滑坡敏感性评价 [J].
Soil landslide susceptibility assessment based on DEM [J]
|
| [17] |
中国地质灾害伤亡事件的空间格局及影响因素 [J].https://doi.org/10.11821/dlxb201705011 URL [本文引用: 1] 摘要
对中国2000-2012年造成人员伤亡的地质灾害事件进行分析,其空间分布格局受地形等自然环境要素的影响,南多北少,主要位于川西山区和云贵高原地区,东南丘陵地区,北方黄土丘陵,以及祁连山脉和天山山脉等地区,但局部地区的分布格局表明其还受到人为因素影响。构建基于二元Logistic回归的中国地质灾害伤亡事件发生概率模型(CELC),定量分析自然、人为因素的影响程度,结果表明GDP增长率是仅次于地形起伏度的第二大影响因素,GDP增长率每增加2.72%,地质灾害伤亡事件发生的概率变为原来的2.706倍。此外还有多年平均降水、植被覆盖度、岩性、土壤类型、断裂带、产业类型和人口密度等因素。将CELC模型应用于中国县域,计算各个县的地质灾害伤亡事件概率,发现尚未发生但概率较高的县有27个,或为贫困县、或为矿产工业县域,或为房产过度开发县,它们是未来中国需要重点防范地质灾害的县域。
Spatial pattern and influencing factors of casualty events caused by landslides [J].https://doi.org/10.11821/dlxb201705011 URL [本文引用: 1] 摘要
对中国2000-2012年造成人员伤亡的地质灾害事件进行分析,其空间分布格局受地形等自然环境要素的影响,南多北少,主要位于川西山区和云贵高原地区,东南丘陵地区,北方黄土丘陵,以及祁连山脉和天山山脉等地区,但局部地区的分布格局表明其还受到人为因素影响。构建基于二元Logistic回归的中国地质灾害伤亡事件发生概率模型(CELC),定量分析自然、人为因素的影响程度,结果表明GDP增长率是仅次于地形起伏度的第二大影响因素,GDP增长率每增加2.72%,地质灾害伤亡事件发生的概率变为原来的2.706倍。此外还有多年平均降水、植被覆盖度、岩性、土壤类型、断裂带、产业类型和人口密度等因素。将CELC模型应用于中国县域,计算各个县的地质灾害伤亡事件概率,发现尚未发生但概率较高的县有27个,或为贫困县、或为矿产工业县域,或为房产过度开发县,它们是未来中国需要重点防范地质灾害的县域。
|
| [18] |
Landslide susceptibility mapping based on support vector machine: A case study on natural slopes of Hong Kong, China [J].https://doi.org/10.1016/j.geomorph.2008.02.011 URL [本文引用: 3] 摘要
The Support Vector Machine (SVM) is an increasingly popular learning procedure based on statistical learning theory, and involves a training phase in which the model is trained by a training dataset of associated input and target output values. The trained model is then used to evaluate a separate set of testing data. There are two main ideas underlying the SVM for discriminant-type problems. The first is an optimum linear separating hyperplane that separates the data patterns. The second is the use of kernel functions to convert the original non-linear data patterns into the format that is linearly separable in a high-dimensional feature space. In this paper, an overview of the SVM, both one-class and two-class SVM methods, is first presented followed by its use in landslide susceptibility mapping. A study area was selected from the natural terrain of Hong Kong, and slope angle, slope aspect, elevation, profile curvature of slope, lithology, vegetation cover and topographic wetness index (TWI) were used as environmental parameters which influence the occurrence of landslides. One-class and two-class SVM models were trained and then used to map landslide susceptibility respectively. The resulting susceptibility maps obtained by the methods were compared to that obtained by the logistic regression (LR) method. It is concluded that two-class SVM possesses better prediction efficiency than logistic regression and one-class SVM. However, one-class SVM, which only requires failed cases, has an advantage over the other two methods as only ailed case information is usually available in landslide susceptibility mapping.
|
| [19] |
GIS-based support vector machine modeling of earthquake-triggered landslide susceptibility in the Jianjiang River watershed, China [J].https://doi.org/10.1016/j.geomorph.2011.12.040 URL [本文引用: 1] 摘要
Support vector machine (SVM) modeling is based on statistical learning theory. It involves a training phase with associated input and target output values. In recent years, the method has become increasingly popular. The main purpose of this study is to evaluate the mapping power of SVM modeling in earthquake triggered landslide-susceptibility mapping for a section of the Jianjiang River watershed using a Geographic Information System (GIS) software. The river was affected by the Wenchuan earthquake of May 12, 2008. Visual interpretation of colored aerial photographs of 1-m resolution and extensive field surveys provided a detailed landslide inventory map containing 3147 landslides related to the 2008 Wenchuan earthquake. Elevation, slope angle, slope aspect, distance from seismogenic faults, distance from drainages, and lithology were used as the controlling parameters. For modeling, three groups of positive and negative training samples were used in concert with four different kernel functions. Positive training samples include the centroids of 500 large landslides, those of all 3147 landslides, and 5000 randomly selected points in landslide polygons. Negative training samples include 500, 3147, and 5000 randomly selected points on slopes that remained stable during the Wenchuan earthquake. The four kernel functions are linear, polynomial, radial basis, and sigmoid. In total, 12 cases of landslide susceptibility were mapped. Comparative analyses of landslide-susceptibility probability and area relation curves show that both the polynomial and radial basis functions suitably classified the input data as either landslide positive or negative though the radial basis function was more successful. The 12 generated landslide-susceptibility maps were compared with known landslide centroid locations and landslide polygons to verify the success rate and predictive accuracy of each model. The 12 results were further validated using area-under-curve analysis. Group 3 with 5000 randomly selected points on the landslide polygons, and 5000 randomly selected points along stable slopes gave the best results with a success rate of 79.20% and predictive accuracy of 79.13% under the radial basis function. Of all the results, the sigmoid kernel function was the least skillful when used in concert with the centroid data of all 3147 landslides as positive training samples, and the negative training samples of 3147 randomly selected points in regions of stable slope (success rate = 54.95%; predictive accuracy = 61.85%). This paper also provides suggestions and reference data for selecting appropriate training samples and kernel function types for earthquake triggered landslide-susceptibility mapping using SVM modeling. Predictive landslide-susceptibility maps could be useful in hazard mitigation by helping planners understand the probability of landslides in different regions.
|
| [20] |
Landslide susceptibility mapping based on rough set theory and support vector machines: A case of the three gorges area, China [J].https://doi.org/10.1016/j.geomorph.2013.08.013 URL [本文引用: 2] 摘要
61We develop a novel hybrid model for landslide susceptibility mapping.61The hybrid model is based on rough set theory and support vector machines.61We propose techniques for evaluating the performance of susceptibility models.61The hybrid model has superior prediction skill and higher reliability.
|
| [21] |
Estimation of rainfall-induced landslides using ANN and fuzzy clustering methods: A case study in Saeen Slope, Azerbaijan province, Iran [J].https://doi.org/10.1016/j.catena.2014.04.009 URL [本文引用: 1] 摘要
As is the case around the world, Azerbaijan province in northwestern Iran experiences numerous landslides that occur following intensive precipitation periods. These landslides damage many aspects of human life as well as the natural environment, and hence it should be evaluated accurately. However, one of the main challenges of landslide studies is the estimation of the periods between potential landslides, which would provide information that is useful for the development of warning systems and/or mitigation measures. The aim of the present study is to propose a novel approach utilizing artificial neural network and fuzzy clustering methods for landslide frequency estimation. This study also investigates the 2005 Saeen, Iran landslide triggered by prolonged heavy rainfall that affected groundwater levels, and introduces a methodology to estimate the date range of the next probable landslide. Based on the interpretation of the triggering factor and failure mechanism, the Saeen landslide was induced by the prolonged rainfall behavior and resultant deep infiltration of water between the years 2002 and 2005. During this period, the maximum rainfall values were observed in April of each year, and then followed by decreased rainfall to a minimum value in June and August. The results of this investigation revealed that the failure probability will likely increase in the next precipitation periods and the saturation rate will be high in August and September of 2017 and 2018, resulting in landslides. In conclusion, this method is only used for the heavy precipitation as the triggering factor to estimate and analyze the next potential landslide. The information derived from this method will establish a time window for future failure, where the other slope-stability factors can be evaluated and then utilized to set up more accurate and reliable networks for further investigations.
|
| [22] |
Artificial neural networks and cluster analysis in landslide susceptibility zonation [J].https://doi.org/10.1109/IJCNN.2006.247036 URL [本文引用: 1] 摘要
A landslide susceptibility analysis is performed by means of Artificial Neural Network (ANN) and Cluster Analysis (CA). This kind of analysis is aimed at using ANNs to model the complex non linear relationships between mass movements and conditioning factors for susceptibility zonation, in order to identify unstable areas. The proposed method adopts CA to improve the selection of training, validation, and test records from data, managed within a Geographic Information System (GIS). In particular, we introduce a domain-specific distance measure in cluster formation. Clustering is used in data pre-processing to select non landslide records and is performed on the whole dataset, excluding the test set landslides. Susceptibility analysis is carried out by means of ANNs on the so-generated data and compared with the common strategy to select random non-landslide samples from pixels without landslides. The proposed method has been applied in the Brembilla Municipality, a landslide-prone area in the Southern Alps, Italy. The results show significant differences between the two sampling methods: the classification of the test set, previously separated and excluded from the training data, is always better when the non-landslide patterns are obtained using the proposed cluster sampling. The case study validates that, by means of a domain-specific distance measure in cluster formation, it is possible to introduce expert knowledge into the black-box modelling method, implemented by ANNs, to improve the predictive capability and the robustness of the models obtained.
|
| [23] |
Comparison of logistic regression and random forests techniques for shallow landslide susceptibility assessment in Giampilieri (NE Sicily, Italy) [J].https://doi.org/10.1016/j.geomorph.2015.06.001 URL [本文引用: 1] 摘要
The aim of this work is to define reliable susceptibility models for shallow landslides using Logistic Regression and Random Forests multivariate statistical techniques. The study area, located in North-East Sicily, was hit on October 1st 2009 by a severe rainstorm (225 mm of cumulative rainfall in 7 h) which caused flash floods and more than 1000 landslides. Several small villages, such as Giampilieri, were hit with 31 fatalities, 6 missing persons and damage to buildings and transportation infrastructures. Landslides, mainly types such as earth and debris translational slides evolving into debris flows, were triggered on steep slopes and involved colluvium and regolith materials which cover the underlying metamorphic bedrock. The work has been carried out with the following steps: i) realization of a detailed event landslide inventory map through field surveys coupled with observation of high resolution aerial colour orthophoto; ii) identification of landslide source areas; iii) data preparation of landslide controlling factors and descriptive statistics based on a bivariate method (Frequency Ratio) to get an initial overview on existing relationships between causative factors and shallow landslide source areas; iv) choice of criteria for the selection and sizing of the mapping unit; v) implementation of 5 multivariate statistical susceptibility models based on Logistic Regression and Random Forests techniques and focused on landslide source areas; vi) evaluation of the influence of sample size and type of sampling on results and performance of the models; vii) evaluation of the predictive capabilities of the models using ROC curve, AUC and contingency tables; viii) comparison of model results and obtained susceptibility maps; and ix) analysis of temporal variation of landslide susceptibility related to input parameter changes. Models based on Logistic Regression and Random Forests have demonstrated excellent predictive capabilities. Land use and wildfire variables were found to have a strong control on the occurrence of very rapid shallow landslides.
|
| [24] |
Landslide susceptibility assessment in Lianhua County (China): A comparison between a random forest data mining technique and bivariate and multivariate statistical models [J].https://doi.org/10.1016/j.geomorph.2016.02.012 URL [本文引用: 1] 摘要
Landslides are an important natural hazard that causes a great amount of damage around the world every year, especially during the rainy season. The Lianhua area is located in the middle of China's southern mountainous area, west of Jiangxi Province, and is known to be an area prone to landslides. The aim of this study was to evaluate and compare landslide susceptibility maps produced using the random forest (RF) data mining technique with those produced by bivariate (evidential belief function and frequency ratio) and multivariate (logistic regression) statistical models for Lianhua County, China. First, a landslide inventory map was prepared using aerial photograph interpretation, satellite images, and extensive field surveys. In total, 163 landslide events were recognized in the study area, with 114 landslides (70%) used for training and 49 landslides (30%) used for validation. Next, the landslide conditioning factors-including the slope angle, altitude, slope aspect, topographic wetness index (TWI), slope-length (LS), plan curvature, profile curvature, distance to rivers, distance to faults, distance to roads, annual precipitation, land use, normalized difference vegetation index (NDVI), and lithology-were derived from the spatial database. Finally, the landslide susceptibility maps of Lianhua County were generated in ArcGIS 10.1 based on the random forest (RF), evidential belief function (EBF), frequency ratio (FR), and logistic regression (LR) approaches and were validated using a receiver operating characteristic (ROC) curve. The ROC plot assessment results showed that for landslide susceptibility maps produced using the EBF, FR, LR, and RF models, the area under the curve (AUC) values were 0.8122, 0.8134, 0.7751, and 0.7172, respectively. Therefore, we can conclude that all four models have an AUC of more than 0.70 and can be used in landslide susceptibility mapping in the study area; meanwhile, the EBF and FR models had the best performance for Lianhua County, China. Thus, the resultant susceptibility maps will be useful for land use planning and hazard mitigation aims.
|
| [25] |
Support vector machines in remote sensing: A review [J].https://doi.org/10.1016/j.isprsjprs.2010.11.001 URL Magsci [本文引用: 1] 摘要
A wide range of methods for analysis of airborne- and satellite-derived imagery continues to be proposed and assessed. In this paper, we review remote sensing implementations of support vector machines (SVMs), a promising machine learning methodology. This review is timely due to the exponentially increasing number of works published in recent years. SVMs are particularly appealing in the remote sensing field due to their ability to generalize well even with limited training samples, a common limitation for remote sensing applications. However, they also suffer from parameter assignment issues that can significantly affect obtained results. A summary of empirical results is provided for various applications of over one hundred published works (as of April, 2010). It is our hope that this survey will provide guidelines for future applications of SVMs and possible areas of algorithm enhancement.
|
| [26] |
Using multiple logistic regression and GIS technology to predict landslide hazard in northeast Kansas, USA [J].https://doi.org/10.1016/S0013-7952(03)00069-3 URL [本文引用: 1] 摘要
Landslides in the hilly terrain along the Kansas and Missouri rivers in northeastern Kansas have caused millions of dollars in property damage during the last decade. To address this problem, a statistical method called multiple logistic regression has been used to create a landslide-hazard map for Atchison, Kansas, and surrounding areas. Data included digitized geology, slopes, and landslides, manipulated using ArcView GIS. Logistic regression relates predictor variables to the occurrence or nonoccurrence of landslides within geographic cells and uses the relationship to produce a map showing the probability of future landslides, given local slopes and geologic units. Results indicated that slope is the most important variable for estimating landslide hazard in the study area. Geologic units consisting mostly of shale, siltstone, and sandstone were most susceptible to landslides. Soil type and aspect ratio were considered but excluded from the final analysis because these variables did not significantly add to the predictive power of the logistic regression. Soil types were highly correlated with the geologic units, and no significant relationships existed between landslides and slope aspect.
|
| [27] |
Effects of earthquakes on dams and embankments [J]. |
| [28] |
A method for producing digital probabilistic seismic landslide hazard maps [J].https://doi.org/10.1016/S0013-7952(00)00039-9 URL [本文引用: 1] 摘要
The 1994 Northridge, California, earthquake is the first earthquake for which we have all of the data sets needed to conduct a rigorous regional analysis of seismic slope instability. These data sets include: (1) a comprehensive inventory of triggered landslides, (2) about 200 strong-motion records of the mainshock, (3) 1:24 000-scale geologic mapping of the region, (4) extensive data on engineering properties of geologic units, and (5) high-resolution digital elevation models of the topography. All of these data sets have been digitized and rasterized at 10 m grid spacing using ARC/INFO GIS software on a UNIX computer. Combining these data sets in a dynamic model based on Newmark's permanent-deformation (sliding-block) analysis yields estimates of coseismic landslide displacement in each grid cell from the Northridge earthquake. The modeled displacements are then compared with the digital inventory of landslides triggered by the Northridge earthquake to construct a probability curve relating predicted displacement to probability of failure. This probability function can be applied to predict and map the spatial variability in failure probability in any ground-shaking conditions of interest. We anticipate that this mapping procedure will be used to construct seismic landslide hazard maps that will assist in emergency preparedness planning and in making rational decisions regarding development and construction in areas susceptible to seismic slope failure.
|
| [29] |
Empirical estimation of the Newmark displacement from the Arias intensity and critical acceleration [J].https://doi.org/10.1016/j.enggeo.2010.12.006 URL [本文引用: 1] 摘要
78 Logarithmic Newmark displacement is proportional to logarithmic Arias intensity log I a. 78 Logarithmic Newmark displacement is also proportional to critical acceleration A c. 78 We add an new term - A clog I a in our empirical formula. 78 We provide a global formula and a local formula for use.
|
| [30] |
Evaluating earthquake-triggered landslide hazard at the basin scale through GIS in the Upper Sele river valley [J].https://doi.org/10.1023/A:1021235029496 URL Magsci [本文引用: 1] 摘要
To evaluate techniques for assessing earthquake-triggeredlandslide hazard in the Southern Apennines (Italy), a GIS-based analysis was used to modelseismically induced slope deformations. Geological, geotechnical, geomorphological and seismologicaldata were integrated into a standard earthquake slope stability model. The model assessed thelandslide potential that existed during the 1980 Irpinian earthquake in the Upper Sele river Valley.The standard Newmark displacement analysis, widely used for predicting the location of shallowunstable slopes, does not take into account errors and/or uncertainties in the input parameters.Therefore, a probabilistic Newmark displacement analysis technique has been used. Probabilistictechniques allow, e.g., an estimation of the probability that a slope will exceed a certain criticalvalue of Newmark displacement. In our probabilistic method, a Monte-Carlo based simulation modelis used in conjunction with a GIS. The random variability of geotechnical data is modelled by probabilitydensity functions (pdfs), while for the seismic input three different regression laws wereconsidered. Input probability distributions are sampled and the resulting values input into empiricalrelations for estimating Newmark displacement. The outcome is a map in which to each siteis related a spatial probability distribution for the expected displacement in response to seismic loading.Results of the experiments show a high grade of uncertainty in the application of the Newmarkanalysis both for the deterministic and probabilistic approach in a complex geological setting suchas the high Sele valley, quite common in the Southern Apennines. They show a strong dependence onthe reliability of the spatial data used in input, so that, when the model is used at basin scale,results are strongly influenced by local environmental condition (e.g., topography, lithology, groundwatercondition) and decrease the model performance.
|
| [31] |
Development of shallow seismic landslide potential map based on Newmark′s displacement: the case study of Chi-Chi earthquake, Taiwan [J].https://doi.org/10.1007/s12665-009-0215-1 URL Magsci [本文引用: 1] 摘要
With the development of the geographic information system (GIS), the analysis of regional slope stability under seismic loading has evolved rapidly in recent years. In many studies, the Newmark’s method is used for the computation of displacements triggered by an earthquake on a single slope, while for regional analysis, the infinite slope theory is frequently used due to its simplicity when large amount of computations are required. In this research, the infinite slope theory was examined considering various seismic conditions, material properties, and slope geometry to verify the suitability of the method when applied to regional analysis and development of potential shallow landslide maps. The landslide cases induced by Chi-Chi earthquake in central Taiwan were used in this study for verification. It was found that the infinite slope theory is valid for regional analysis when used with discretion. Based on the calculated Newmark’s displacement and combining the GIS technique, procedures for the potential map development are established in this study.
|
| [32] |
Active tectonics of the Beichuan and Pengguan faults at the eastern margin of the Tibetan Plateau [J].https://doi.org/10.1029/2006TC001987 URL [本文引用: 1] 摘要
[1] The steep, high-relief eastern margin of the Tibetan Plateau has undergone rapid Cenozoic cooling and denudation yet shows little evidence for large-magnitude shortening or accommodation generation in the foreland basin. We address this paradox by using a variety of geomorphic observations to place constraints on the kinematics and slip rates of several large faults that parallel the plateau margin. The Beichuan and Pengguan faults are active, dominantly dextral-slip structures that can be traced continuously for up to 200 km along the plateau margin. Both faults offset fluvial fill terraces that yield inheritance-corrected, cosmogenic 10Be exposure ages of <15 kyr, indicating latest Pleistocene activity. The Pengguan fault appears to have been active in the Holocene at two sites along strike. Latest Quaternary apparent throw rates on both faults are variable along strike but are typically <1 mm yr0908081. Rates of strike-slip displacement are likely to be several times higher, probably 090804109000910 mm yr0908081 but remain poorly constrained. Late Quaternary folding and dextral strike-slip has also occurred along the western margin of the Sichuan Basin, particularly associated with the present-day mountain front. These observations support models for the formation and maintenance of the eastern plateau margin that do not involve major upper crustal shortening. They also suggest that activity on the margin-parallel faults in eastern Tibet may represent a significant seismic hazard to the densely populated Sichuan Basin.
|
| [33] |
|
| [34] |
The nature of statistical learning theory [M]. |
| [35] |
Validation of spatial prediction models for landslide hazard mapping [J].https://doi.org/10.1023/B:NHAZ.0000007172.62651.2b URL Magsci [本文引用: 1] 摘要
This contribution discusses the problemof providing measures of significance ofprediction results when the predictionswere generated from spatial databases forlandslide hazard mapping. The spatialdatabases usually contain map informationon lithologic units, land-cover units,topographic elevation and derived attributes(slope, aspect, etc.) and the distributionin space and in time of clearly identifiedmass movements. In prediction modelling wetransform the multi-layered databaseinto an aggregation of functional values toobtain an index of propensity of the landto failure. Assuming then that the informationin the database is sufficiently representativeof the typical conditions in which the massmovements originated in space and in time,the problem then, is to confirm the validity ofthe results of some models over otherones, or of particular experiments that seem touse more significant data. A core pointof measuring the significance of a prediction isthat it allows interpreting the results.Without a validation no interpretation is possible,no support of the method or of theinput information can be provided. In particularwith validation, the added value canbe assessed of a prediction either in a fixedtime interval, or in an open-ended time orwithin the confined space of a study area.Validation must be of guidance in datacollection and field practice for landslidehazard mapping.
|
| [36] |
The application of GIS-based logistic regression for landslide susceptibility mapping in the Kakuda-Yahiko Mountains, Central Japan [J].https://doi.org/10.1016/j.geomorph.2004.06.010 URL [本文引用: 1] 摘要
As a first step forward in regional hazard management, multivariate statistical analysis in the form of logistic regression was used to produce a landslide susceptibility map in the Kakuda-Yahiko Mountains of Central Japan. There are different methods to prepare landslide susceptibility maps. The use of logistic regression in this study stemmed not only from the fact that this approach relaxes the strict assumptions required by other multivariate statistical methods, but also to demonstrate that it can be combined with bivariate statistical analyses (BSA) to simplify the interpretation of the model obtained at the end. In susceptibility mapping, the use of logistic regression is to find the best fitting function to describe the relationship between the presence or absence of landslides (dependent variable) and a set of independent parameters such as slope angle and lithology. Here, an inventory map of 87 landslides was used to produce a dependent variable, which takes a value of 0 for the absence and 1 for the presence of slope failures. Lithology, bed rock-slope relationship, lineaments, slope gradient, aspect, elevation and road network were taken as independent parameters. The effect of each parameter on landslide occurrence was assessed from the corresponding coefficient that appears in the logistic regression function. The interpretations of the coefficients showed that road network plays a major role in determining landslide occurrence and distribution. Among the geomorphological parameters, aspect and slope gradient have a more significant contribution than elevation, although field observations showed that the latter is a good estimator of the approximate location of slope cuts. Using a predicted map of probability, the study area was classified into five categories of landslide susceptibility: extremely low, very low, low, medium and high. The medium and high susceptibility zones make up 8.87% of the total study area and involve mid-altitude slopes in the eastern part of Kakuda Mountain and the central and southern parts of Yahiko Mountain.
|
| [37] |
Comparison of bivariate and multivariate statistical approaches in landslide susceptibility mapping at a regional scale [J].https://doi.org/10.1016/j.geomorph.2012.03.036 URL [本文引用: 1] 摘要
Landslide susceptibility assessment was undertaken for the Waikato Region, New Zealand. Landslide inventory data were extracted from a pre-existing database that included few landslides in the region (1.4% of area), and is limited in terms of completeness of record and location uncertainty. This database is in contrast to those normally used for research, which are derived for the research project and are complete and accurate, but is representative of those that may exist within government bodies. This paper applies statistical methods to derive a meaningful predictive map for planning purposes from such a relatively poorly defined database. Susceptibility maps for both logistic regression and weights of evidence were derived and evaluated using success, prediction, and ROC curves. Both statistical methods gave models with fair predictive capacity for validation samples from the original database with areas under ROC curves ( AUC ) of 0.71 to 0.75. An independent set of landslide data compiled from observations made in Google Earth showed lower overall prediction quality, with the logistic regression method giving the best prediction ( AUC = 0.71). For this regional assessment, categorical data proved a major constraint on the application of logistic regression as the area considered has complex geology and geomorphology. As a result, the large number of categories required led to a complex and unwieldy statistical model, whereas division into fewer categories meant that real variability in the area could not be adequately represented. This limited the result to a model with two continuous variables, slope and mean monthly rainfall. The incomplete record in the database proved of little concern for the logistic regression method as the model was able to generalise landslide locations from the known sites well, giving a similar AUC value for the original and independent data; the same was not true for the weights of evidence method which was not successful at predicting landslides outside those in the original data.
|
| [38] |
Relation of Arias intensity to magnitude and distance in California [R]. |
| [39] |
Spatial distribution analysis of landslides triggered by 2008 5.12 Wenchuan Earthquake, China [J].https://doi.org/10.1016/j.enggeo.2010.07.011 URL 摘要
he 2008.5.12 Wenchuan Earthquake(seismic magnitude M_w 7.9 according to the USGS)triggered a great number of landslides.A spatial database of landslides is built by interpreting the remote sensing(RS)data which covers 11 counties severely damaged by the earthquake with area of about 31,686.12 km~2.The geological settings of the study area are detailed mapped including geologic structure and lithology.The digital elevation model(DEM)of the study area with resolution of 30 m 30 m is presented to address the topographic characteristics.Correlations between the occurrence of landslides with geological settings i.e. active faults(the coseismic surface ruptures),geological unit,slope gradient,slope elevation as well as slope aspect are analyzed using spatial modeling in GIS with the aids of field investigations.It can be concluded that the distance to the causative faults and slope gradient are much more important than other factors. Landslides are clustered distributed along the causative faults of F2 and F3,and landslides incidence are dramatically decreasing with the increasing of the distance to the causative faults.The landslides incidence has an obvious increase near the active faults i.e.F1.Landslide concentration(LC,landslides/km~2)has an obvious exponent increase with slope gradient.However,LC has no obvious relationship with geological unit and slope elevation;the difference of LC value in each geological unit(each slope elevation category)maybe have been the result affected by slope gradient for each geological unit(each slope elevation category)and distance of each geological unit(each slope elevation category)to causative fault zone.Isoseismal map reflects the incidence of landslides in some degree,and LC increases dramatically with Intensity increasing, almost all landslides occurred in the region above egree. Statistics result also indicates that in the near field of causative faults,landslides tend to have the initial sliding direction similar to the movement of the causative faults.And preliminary study shows that landslides incidence varies in different slopes with different structure,and consequent slopes and obsequent slopes have a higher landslides incidence than other layered slopes.
|
| [40] |
Landslide hazard mapping at Selangor, Malaysia using frequency ratio and logistic regression models [J].https://doi.org/10.1007/s10346-006-0047-y URL Magsci [本文引用: 1] 摘要
<a name="Abs1"></a>The aim of this study is to evaluate the landslide hazards at Selangor area, Malaysia, using Geographic Information System (GIS) and Remote Sensing. Landslide locations of the study area were identified from aerial photograph interpretation and field survey. Topographical maps, geological data, and satellite images were collected, processed, and constructed into a spatial database in a GIS platform. The factors chosen that influence landslide occurrence were: slope, aspect, curvature, distance from drainage, lithology, distance from lineaments, land cover, vegetation index, and precipitation distribution. Landslide hazardous areas were analyzed and mapped using the landslide-occurrence factors by frequency ratio and logistic regression models. The results of the analysis were verified using the landslide location data and compared with probability model. The comparison results showed that the frequency ratio model (accuracy is 93.04%) is better in prediction than logistic regression (accuracy is 90.34%) model.
|
| [41] |
Landslide susceptibility mapping on a global scale using the method of logistic regression [J].https://doi.org/10.5194/nhess-2016-347 URL [本文引用: 1] 摘要
This paper proposes a statistical model for mapping global landslide susceptibility based on logistic regression. After investigating explanatory factors for landslides in the existing literature, five factors were selected for model landslide susceptibility: relative relief, extreme precipitation, lithology, ground motion and soil moisture. When building the model, 70 % of landslide and nonlandslide points were randomly selected for logistic regression, and the others were used for model validation. To evaluate the accuracy of predictive models, this paper adopts several criteria including a receiver operating characteristic (ROC) curve method. Logistic regression experiments found all five factors to be significant in explaining landslide occurrence on a global scale. During the modeling process, percentage correct in confusion matrix of landslide classification was approximately 80 % and the area under the curve (AUC) was nearly 0.87. During the validation process, the above statistics were about 81 % and 0.88, respectively. Such a result indicates that the model has strong robustness and stable performance. This model found that at a global scale, soil moisture can be dominant in the occurrence of landslides and topographic factor may be secondary.
|
| [42] |
Measuring the accuracy of diagnostic systems [J].URL PMID: 3287615 [本文引用: 1] 摘要
Diagnostic systems of several kinds are used to distinguish between two classes of events, essentially "signals" and "noise". For them, analysis in terms of the "relative operating characteristic" of signal detection theory provides a precise and valid measure of diagnostic accuracy. It is the only measure available that is uninfluenced by decision biases and prior probabilities, and it places the performances of diverse systems on a common, easily interpreted scale. Representative values of this measure are reported here for systems in medical imaging, materials testing, weather forecasting, information retrieval, polygraph lie detection, and aptitude testing. Though the measure itself is sound, the values obtained from tests of diagnostic systems often require qualification because the test data on which they are based are of unsure quality. A common set of problems in testing is faced in all fields. How well these problems are handled, or can be handled in a given field, determines the degree of confidence that can be placed in a measured value of accuracy. Some fields fare much better than others.
|
| [43] |
Optimal landslide susceptibility zonation based on multiple forecasts [J].https://doi.org/10.1016/j.geomorph.2009.06.020 URL [本文引用: 1] 摘要
Environmental and multi-temporal landslide information for an area in Umbria, Italy, was exploited to produce four single and two combined landslide susceptibility zonations. The 78.9km 2 study area was partitioned in 894 slope units, and the single susceptibility zonations were obtained through linear discriminant analysis (LDA), quadratic discriminant analysis (QDA), logistic regression (LR), and by training a neural network (NN). The presence or absence of landslides in the slope units in the period from pre-1941 to 1996 (training set) was used as the dependent variable for the terrain classification. Next, adopting a regression approach, two “optimal” combinations of the four single zonations were prepared. The single and the combined zonations were tested against landslides in the 9-year period from 1997 to 2005 (validation set). Different metrics were used to evaluate the quality of the susceptibility zonations, including degree of model fit, uncertainty in the probability estimates, and model prediction skills. These metrics showed that the degree of model fit was not a good indicator of the model forecasting skills. Zonations obtained through classical multivariate classification techniques (LDA, QDA and LR) produced superior predictions when compared to the NN model, that over fitted the landslide information in the training set. LDA and LR produced less uncertain zonations than QDA and NN. The combined models resulted in a reduced number of errors and in less uncertain predictions; an important result that suggests that the combination of landslide susceptibility zonations can provide “optimal” susceptibility assessments.
|

/
| 〈 |
|
〉 |

