赵娜 , 焦毅蒙
, 焦毅蒙
ZHAO Na, JIAO YiMeng
通讯作者:
收稿日期: 2018-04-10
修回日期: 2018-07-19
网络出版日期: 2018-10-25
版权声明: 2018 《地球信息科学学报》编辑部 《地球信息科学学报》编辑部 所有
基金资助:
作者简介:
作者简介:赵 娜(1986-),女,副研究员,主要从事气候要素模拟及气候变化研究。E-mail: zhaon@lreis.ac.cn
展开
摘要
本研究以黑河流域为例,通过在不同空间尺度上建立降水与影响因素的关系并选择最优尺度以此进行降尺度,建立了基于地理加权回归(GWR)与高精度曲面建模方法(HASM)相结合的跨尺度统计降尺度方法,对TRMM降水数据进行了降尺度模拟。最后,结合站点观测数据采用交叉验证法对降尺度结果进行了验证。结果表明,与传统的降尺度方法相比,考虑最优尺度的降尺度方法在一定程度上提高了降尺度结果的精度,同时表明对跨尺度过程中产生的误差进行修正可进一步提高结果精度。本研究所提出的方法可用于粗分辨率降水数据的降尺度模拟,可为站点稀疏地区或地形复杂地区高分辨率高精度降水数据的获取提供方法上的支持。
关键词:
Abstract
Precipitation data with high accuracy and high spatial resolution are very important for improving our understanding of basin-scale hydrology, agriculture and earth science, and are essential in characterizing the behavior of a catchment. Attaining accurate and high spatial resolution precipitation data is deemed necessary for environmental, meteorological, and hydrological applications. This study proposed a statistical downscaling method based on the geographical weighted regression method (GWR) and high accuracy surface modeling method (HASM) by selecting the optimal downscaling scale and considering the errors produced in the scale-change process. GWR can address the spatially heterogeneous relationships between precipitation and its influence factors, such as digital elevation model (DEM), normalized difference vegetation index (NDVI) and slope, at different spatial resolutions, whereas HASM is used to merge the cross-scale error fields that are produced from the downscaling process and meteorological observations.The method was used to downscale the TRMM precipitation dataset over the Heihe River basin (HRB) from 0.25o to 1 km. Cross-validation method was used to validate the developed method combined with the station observations. Results showed that the proposed downscaling method performed better than the traditional downscaling method, which directly downscaled the TRMM products without considering the optimal downscaling scale. Besides, it was found that residual correction is necessary after the GWR-based downscaling method. The method proposed in this research can be used to downscale precipitation dataset with coarse resolution and could be applied to the areas with data-scare network and complex topography.
Keywords:
降水是描述某地区乃至全球气候系统变化的关键指标,是全球水分和能量循环的核心组成部分。作为流域生态水文过程的关键输入参数,降水分布的准确估算直接影响着流域内水文水资源分析、水资源规划与管理及生态环境治理等。高精度高分辨率的空间化降水信息对认识流域生态系统与水文过程及其相互作用的途径和机理、建立流域生态水文过程模拟模型和水资源决策支持系统、提高流域水-生态-经济耦合系统演变的综合分析与预测能力等方面具有重要的科学意义和应用价值[1,2,3]。如何准确、精细化估算降水空间分布是近年来流域和全球生态水文等研究的关键,备受科研人员关注[4,5,6]。
由于降水时空分布的复杂性,单一方法的高精度、高时空分辨率降水空间分布模拟结果还存在较大的差异和不确定性[7]。目前,国内外研究人员从站点尺度、区域尺度及全球尺度,基于函数插值、物理过程模型模拟、遥感估算等方法对降水空间分布进行了大量的模拟研究。利用气象站点的降水观测值进行空间插值可以获得无站点地区的降水要素值。然而,研究表明只有在观测站点密度比较大的地区,插值方法的精度才比较可靠,而稀疏站点以及地表变化较大区域的降水插值结果成为水文生态模拟中重要的不确定性来源[8]。物理过程模型能够实时模拟降水空间分布,但存在对复杂的气候系统部分简化、参数不易确定等问题[9]。近年来,遥感在降水研究中得到了十分广泛的应用[10,11]。遥感降水在捕捉大范围降水空间分布特征方面具有明显优势,能较好地体现降水空间分布模式,其时空连续性好。但受云层影响、反演算法及设备误差等原因,遥感降水具有很大的不确定性[12,13]。2007年开始,世界气象组织下属的国际降水工作组开展了PEHRPP计划,对各种遥感降水、模式降水产品(如TRMM、CMORPH、PERSIANN、APHRODITE、ERA-Interim 及 CFSR)的精度进行比较,该计划推动了降水数据精度评价的研究[14,15,16]。高分辨率的降水数据对流域生态水文模拟质量具有决定性作用。然而,遥感估算降水及模式产品往往分辨率较低而不能满足精细尺度上生态水文模型的需求。为此研究者们提出和发展了多种降尺度方法,主要包括统计降尺度和动力降尺度。其中,统计降尺度由于简单易操作近年来得到了迅速发展[17,18,19]。但目前研究一般建立在大尺度上成立的统计关系在小尺度上仍然成立这一假设[20,21]。由于降水较强的空间异质性及地形的尺度效应,不同尺度下降水的影响因素复杂多样,高分辨率的降水空间分布信息需要在考虑跨尺度空间异质性的基础上对模式数据或遥感数据进行降尺度模拟[22]。
本研究拟以黑河流域为例,对目前被广泛使用的TRMM 数据采用跨尺度降尺度方法进行降尺度模拟。通过综合考虑黑河流域特点,结合逐步回归法及地理加权回归法,在不同尺度上构建TRMM降水产品与其影响因素的关系,并选择最优尺度以此来降尺度,最后对跨尺度引入的误差采用高精度曲面建模方法(HASM)进行迭代修正。
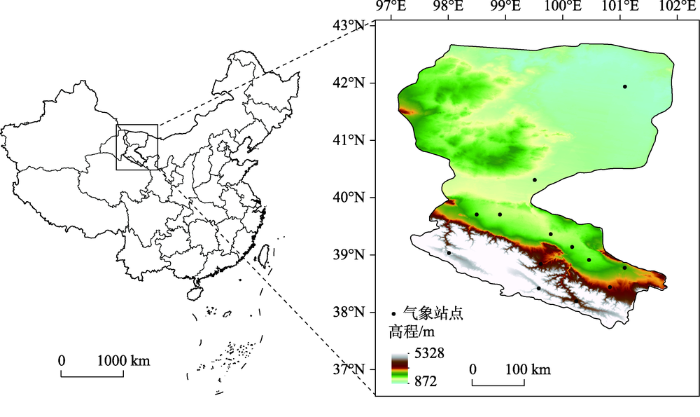
黑河流域是中国第二大内陆河流域,是河西地区最大的内陆河流域,也是西北干旱区最具有代表性的流域。它发源于祁连山区,途径山前绿洲,抵达广阔的荒漠地带,形成了以水为主线的冰川-冻土-森林-草原-绿洲-荒漠等类型丰富的多元自然景观,成为水文、生态、土壤与人类活动相互作用研究的典型理想区域[23]。高分辨率降水空间分布的准确获取将为研究区生态水文社会经济状况研究提供必要的数据支持。黑河流域上游由于受东南季风的影响降水量相对较多,年平均降水超过350 mm,中游为河西走廊绿洲带,地形相对平坦,年平均降水为200 mm左右,下游为阿拉善高原,降水不足50 mm。降水量主要分布在5-9月,夏季降水占全年降水总量的58.29%。而黑河流域只有16个气象观测台站并且分布极不均匀(图1),由于地表信息具有高度空间异质性,难以将站点资料推广到整个黑河流域,因此站点资料在黑河流域生态-水文记成研究中使用范围有限。此外,研究表明黑河流域气象站点代表性不足[24],故基于站点的方法得到的结果可信度差。
图1 研究区域及区域站点分布
Fig. 1 Study area and the distribution of meteorological stations
本研究采用的数据主要包括2013年的TRMM 3B43降水数据、站点降水数据、归一化植被指数(NDVI)数据、高程数据等。TRMM3B43数据来源于NASA (Http://trmm.gsfc.nasa.gov/)[25,26],首先将该数据的降水率根据各月降水天数及时间计算得到逐月降水量值,其空间分辨率为0.25°。站点降水数据[27]来源于国家气象中心经过均一化校正后的逐月降水观测值。NDVI数据采用2013年的MODIS13A3产品(http://www.spot-vegetation.com/)[28],空间分辨率为1km,经最大值合成得到年均最大NDVI。高程数据来源于SRTM数据(http://srtm.csi.cgiar.org/SELECTION/inputCoord.asp)[29],采用AunDEM软件将其从90 m分辨率重采样成1km空间分辨率。其它地形指标如坡度(Slope)、坡向(Aspect)及地形起伏度(Relief)均由DEM数据经过ArcGIS软件生成。
黑河流域降水由南向北呈减少趋势,上游降水由东南向西北递减,降水垂直地带性明显。由于降水受地形、气候、经纬度等因素的影响,使降水与DEM、NDVI等影响因子间的关系存在时空上的不连续与非线性特征。本研究在前人研究基础上[30,31],以NDVI表示区域植被信息,以DEM、坡度、坡向、地形起伏度表示区域地形信息。首先引入影响黑河流域月降水的地理地形因素,主要包括经度(Lon)、纬度(Lat)、高程(DEM)、高程的二次方(DEM2)、坡度(Slope)、坡度的二次方(Slope2)、坡向(Aspect)、坡向的二次方(Aspect2)、地形起伏度(Relief)、地形起伏度的二次方(Relief2)及归一化植被指数(NDVI)和NDVI的二次方等。对逐月降水采用逐步回归的方法筛选降水的主要影响因素,继而采用地理加权(GWR)的方法对逐月降水在1°、0.75°、0.5°、0.25°及0.1°上进行降尺度模拟,并根据不同尺度上GWR模型的最优拟合优度指标R2构建最优GWR降尺度模型,得到降尺度后的逐月降水背景趋势值,并进而得到对应站点残差;同时,结合中尺度天气过程及局地地形交互作用,对站点残差采用高精度曲面建模方法HASM进行迭代修正,最终得到高分辨率降水空间分布场,该方法计算流程如图2所示。
具体来讲,首先构建地理加权回归GWR的计算公式如下:
式中:
式中:
式中:yi为因变量在空间位置i处观测值;
GWR可以看做是通过权重矩阵W对普通最小二乘回归方法的扩展,进而生成空间局部变化的回归系数,从而刻画出空间非平稳趋势。
根据不同尺度下GWR生成的降尺度结果所对应的最优拟合优度值R2,选择最优尺度,并以此最优尺度所对应的GWR权重函数构建方式,将原始TRMM月尺度数据从0.25°降尺度到1 km分辨率网格:
本文假定GWR降尺度后的随机误差为一不规则曲面,可由微分几何学原理结合站点残差构建。最后,对于降尺度过程中引入的误差,采用高精度曲面建模方法(HASM)进行迭代修正。HASM具体表达式可表示为:
式中:
式中:
本研究以黑河流域为例,选择2013年1、4、7、10月对TRMM3B43月尺度降水数据由0.25o降尺度为1 km分辨率。通过利用GWR方法建立不同尺度(1°、0.75°、0.5°、0.25°及0.1°)上降水与影响因素的关系,得到各月份最优降尺度分辨率分别为0.25°、0.1°、0.5°、及0.1°。传统降尺度方法直接对TRMM数据在原始分辨率0.25°上进行降尺度得 1 km分辨率结果,本文比较了所提出的跨尺度降尺度(GWRoptimal-HASM)与传统降尺度(GWR-HASM)结果差异。采用交叉验证法,逐次从站点中剔除一个值,如此循环,直到所有站点值都被剔除一遍后,求解各站点上误差的平均值。误差指标采用平均绝对误差(MAE),均方根误差(RMSE)及偏差百分比(PBIAS)表示。公式如下:
$MAE=\frac{1}{N}\sum\limits_{k=1,…,N} |pre_{i}-pre_{i}^{*}| $(8)
$RMSE=\sqrt{\frac{1}{N}\sum\limits_{k=1,…,N} (pre_{i}-pre_{i}^{*})^{2}}$ (9)
$PBLAS=\frac{\sum\limits_{k=1,…,N}(pre_{i}^{*}-pre_{i})}{\sum\limits_{k=1,…,N} pre_{i}^{*}}\times 100\%$(10)
式中:
由表1可知,1月单独采用GWR进行降尺度后结果精度优于TRMM原始数据。由MAE、RMSE及PBIAS得出经过跨尺度后的降尺度GWRoptimal-HASM方法要好于单独采用GWR方法,且好于传统的GWR-HASM降尺度方法。4月,降尺度后的结果精度比原始TRMM数据有了明显改善。且误差指标表明,GWRoptimal-HASM方法好于单独采用GWR方法及传统的GWR-HASM方法。7月,传统的降尺度方法GWR-HASM结果精度要低于原始TRMM数据,而采用跨尺度后的GWRoptimal-HASM方法模拟精度最高。10月,3种降尺度方法结果精度较TRMM原始数据有了明显改善,但各方法差别较大,精度最高的为GWRoptimal-HASM方法。整体而言,考虑了跨尺度后的GWRoptimal-HASM方法精度优于传统的GWR-HASM方法,也好于单独采用GWR的降尺度方法。
表1 不同降尺度方式及降尺度前后结果误差
Tab. 1 Errors of downscaling methods and the original TRMM data
| 误差 | TRMM | GWR | GWRoptimal-HASM | GWR-HASM | |
|---|---|---|---|---|---|
| 1月 | MAE/mm | 0.9282 | 0.9259 | 0.9271 | 0.9488 |
| RMSE/mm | 1.2213 | 1.1860 | 1.1759 | 1.2285 | |
| PBIAS/% | -0.2071 | -0.3033 | -0.2005 | -0.2602 | |
| 4月 | MAE/mm | 4.6879 | 2.1075 | 2.0107 | 2.7614 |
| RMSE/mm | 7.5588 | 2.6821 | 2.5658 | 4.1456 | |
| PBIAS/% | -2.2401 | -1.0159 | -1.0002 | -1.2880 | |
| 7月 | MAE/mm | 43.5698 | 43.000 | 42.1283 | 44.9397 |
| RMSE/mm | 54.4638 | 53.7348 | 52.5625 | 55.6298 | |
| PBIAS/% | 0.4971 | 0.4967 | 0.4817 | 0.5051 | |
| 10月 | MAE/mm | 4.2226 | 2.7978 | 2.4975 | 3.1629 |
| RMSE/mm | 5.7366 | 3.4299 | 2.8917 | 4.0989 | |
| PBIAS/% | -1.5358 | -0.9615 | -0.8491 | -1.1724 |
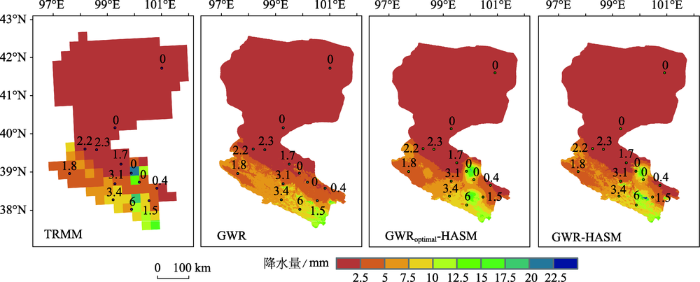
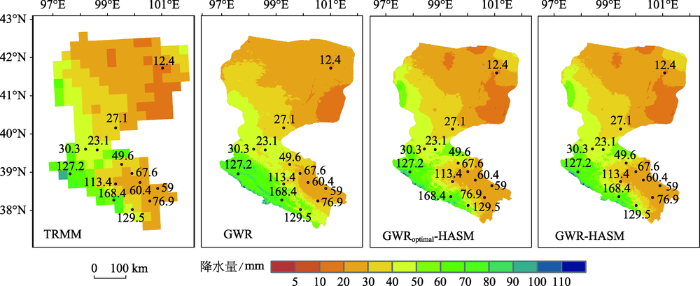
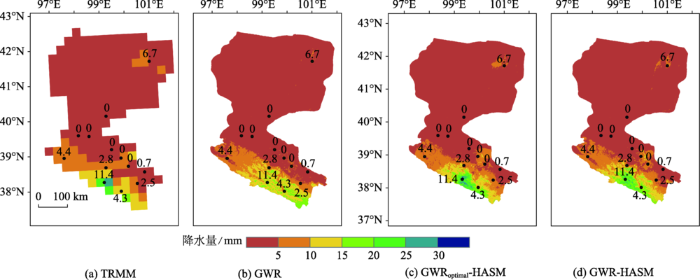
图3-6给出了1、4、7、10月TRMM原始资料及降尺度后的降水空间分布。结合站点实测数据可以看出TRMM数据在个别站点处出现了低估与高估现象。基于GWR的方法在4个月中的结果与对应的TRMM原始数据空间分布差异较大,经过HASM修正后的降尺度降水空间分布模式与TRMM原始资料整体上一致,但GWRoptimal-HASM和GWR-HASM方法在个别地区细节差异明显。例如,1月及4月上游祁连县西北部地区、7月在肃北地区及10月的额济纳旗地区,相比GWR-HASM方法,GWRoptimal-HASM较好地还原了TRMM原始资料在该地区的观测信息。
传统的降尺度方法建立大尺度气候要素(预报因子)和区域气候要素(预报量)之间的统计关系,然而这种关系即使充分考虑了最佳预报因子,也未必在空间尺度上最优。由于地理地形因素对降水的影响具有尺度效应,本研究首先考虑在不同尺度上建立统计关系,并选取最优尺度以此来降尺度,继而对降尺度后引入的误差采用HASM方法进行迭代修正。模拟结果表明,考虑了跨尺度后的降尺度方法优于传统的直接降尺度方法。且研究表明误差修正在降尺度中是不可缺少的一步。本研究提出的方法将为粗分辨率气候数据特别是地形复杂地区的降水降尺度提供方法上的支持。
The authors have declared that no competing interests exist.
| [1] |
Toward a reliable decomposition of predictive uncertainty in hydrological modeling: characterizing rainfall errors using conditional simulation [J]. |
| [2] |
气候变化下水资源脆弱性的适应性管理新认识 [J].
气候变化下的水资源脆弱性和适应性管理研究成为全球和国家应对气候变化和保障水资源安全重点关注的问题,也是中国可持续发展面对的重大战略问题。介绍了水资源脆弱性和适应性管理的国内外最新研究进展;针对国家重大需求和国际科学前沿问题,综述了气候变化下水资源脆弱性和适应性管理存在的问题与挑战。提出了气候变化下水资源脆弱性与适应性管理理论与方法研究以应对气候变化的无悔为准则,与社会经济可持续发展、成本效益分析、利益相关者的多信息源的分析与综合决策相结合为原则,对适应性管理与脆弱性组成的互联互动系统及其风险与不确定性进行分析的新认识。
Revision on water resources vulnerability and adaption measures under climate change [J].
气候变化下的水资源脆弱性和适应性管理研究成为全球和国家应对气候变化和保障水资源安全重点关注的问题,也是中国可持续发展面对的重大战略问题。介绍了水资源脆弱性和适应性管理的国内外最新研究进展;针对国家重大需求和国际科学前沿问题,综述了气候变化下水资源脆弱性和适应性管理存在的问题与挑战。提出了气候变化下水资源脆弱性与适应性管理理论与方法研究以应对气候变化的无悔为准则,与社会经济可持续发展、成本效益分析、利益相关者的多信息源的分析与综合决策相结合为原则,对适应性管理与脆弱性组成的互联互动系统及其风险与不确定性进行分析的新认识。
|
| [3] |
Impacts of satellite-based precipitation datasets on rainfall-runoff modeling of the Western Amazon basin of Peru and Ecuador [J].https://doi.org/10.1016/j.jhydrol.2015.06.064 URL [本文引用: 1] |
| [4] |
Spatial interpolation of large climate data sets using bivariate thin plate smoothing splines [J].https://doi.org/10.1016/j.envsoft.2005.08.005 URL [本文引用: 1] 摘要
Thin plate smoothing splines are widely used to spatially interpolate surface climate, however, their application to large data sets is limited by computational efficiency. Standard analytic calculation of thin plate smoothing splines requires O( n 3) operations, where n is the number of data points, making routine computation infeasible for data sets with more than around 2000 data points. An O( N) iterative procedure for calculating finite element approximations to bivariate minimum generalised cross validation (GCV) thin plate smoothing splines operations was developed, where N is the number of grid points. The key contribution of the method lies in the incorporation of an automatic procedure for optimising smoothness to minimise GCV. The minimum GCV criterion is commonly used to optimise thin plate smoothing spline fits to climate data. The method discretises the bivariate thin plate smoothing spline equations using hierarchical biquadratic B-splines, and uses a nested grid multigrid procedure to solve the system. To optimise smoothness, a double iteration is incorporated, whereby the estimate of the spline solution and the estimate of the optimal smoothing parameter are updated simultaneously. When the method was tested on temperature data from the African and Australian continents, accurate approximations to analytic solutions were obtained.
|
| [5] |
Geo-spatial grid-based transformations of precipitation estimates using spatial interpolation methods [J]. |
| [6] |
A high spatiotemporal gauge-satellite merged precipitation analysis over China [J].https://doi.org/10.1002/2013JD020686 URL [本文引用: 1] 摘要
Using hourly rain gauge data at more than 30,000 automatic weather stations in China, in conjunction with the Climate Precipitation Center Morphing (CMORPH) precipitation product for the 20080900092010 warm seasons (from May through September), we assess the capability of the probability density function090009optimal interpolation (PDF-OI) methods in generating the daily, 0.2500°09000901030900090.2500° and hourly, 0.100°09000901030900090.100° merged precipitation products between gauge observations and the CMORPH product. We find that error correlation, error variances of gauge and satellite data, and matching strategy in the PDF-OI method are dependent on the spatial and temporal resolutions of the used data. Efforts to improve the parameters and matching strategy for the hourly and 0.100°09000901030900090.100° product have been conducted. These improvements are not only suitable to a high-frequency depiction of no-rain events, but accurately describe the error structures of hourly gauge and satellite fields. The successive merged precipitation algorithm or product is called the original PDF-OI (Orig_PDF-OI) and the improved PDF-OI, respectively. The cross-validation results show that the improved method reduces systematic bias and random errors effectively compared with both the CMORPH precipitation and the Orig_PDF-OI. The improved merged precipitation product over China at hourly, 0.100° resolution is generated from 2008 to 2010. Compared with the Orig_PDF-OI, the improved product reduces the underestimation greatly and has smaller bias and root-mean-square error, and higher spatial correlation. The improved product can better capture some varying features of hourly precipitation in heavy weather events.
|
| [7] |
Accuracy of satellite rainfall estimates in the Blue Nile Basin: lowland plain versus highland mountain [J].https://doi.org/10.1002/2013WR014500 URL [本文引用: 1] |
| [8] |
Evaluation of TRMM 3B42 product using a new gauge-based analysis of daily precipitation over China [J].https://doi.org/10.1002/joc.2014.34.issue-8 URL [本文引用: 1] |
| [9] |
Daily precipitation statistics for South America: An intercomparison between NCEP reanalyses and observations [J].https://doi.org/10.1175/2010JHM1303.1 URL [本文引用: 1] |
| [10] |
Effects of resolution of satellite-based rainfall estimates on hydrologic modeling skill at different scales [J].https://doi.org/10.1175/JHM-D-12-0113.1 URL [本文引用: 1] |
| [11] |
Satellites provide the big picture [J].https://doi.org/10.1126/science.aac9238 URL PMID: 26273037 [本文引用: 1] 摘要
Author(s): Famiglietti, JS; Cazenave, A; Eicker, A; Reager, JT; Rodell, M; Velicogna, I
|
| [12] |
高分辨率对地观测的若干前沿科学问题 [J].Several frontier scientific problem about high resolution earth observation [J]. |
| [13] |
Evaluation of several rainfall products used for hydrological applications over West Africa using two high-resolution gauge networks [J].https://doi.org/10.1002/qj.2130 URL [本文引用: 1] |
| [14] |
赣江流域高分辨率卫星降水数据的精度特征与时空变化规律 [J].Spatio-temporal change characteristics and accuracy of high resolution satelliate remote sensing precipitation in Ganjiang river basin [J]. |
| [15] |
Evaluation of the latest satellite-gauge precipitation products and their hydrologic applications over the Huaihe river basin [J].https://doi.org/10.1016/j.jhydrol.2016.02.054 URL [本文引用: 1] |
| [16] |
Assessment of CPM-IMERG and other precipitation products against gauge data under different topographic and climatic conditions in Iran: Preliminary results [J].https://doi.org/10.3390/rs8020135 URL [本文引用: 1] |
| [17] |
Issues associated with statistical downscaling of general circulation model outputs: a discussion [C]. |
| [18] |
A new satellite-based monthly precipitation downscaling algorithm with non-stationary relationship between precipitation and land surface characteristics [J].https://doi.org/10.1016/j.rse.2015.02.024 URL [本文引用: 1] |
| [19] |
Statistical downscaling of precipitation using local regression and high accuracy surface modeling method [J]. |
| [20] |
高精度曲面建模的中国气候降尺度模型 [J].https://doi.org/10.3724/SP.J.1047.2012.00599 URL Magsci [本文引用: 1] 摘要
与站点统计降尺度插值和动力降尺度相比,高精度曲面建模(HASM)降尺度,具有不需大尺度预报因子,直接从GCM结果构建区域上高空间分辨率的未来气候模拟曲面的优势。HASM降尺度将未来气候,分为历史观测拟合的气候基准值和GCM未来气候变化值进行模拟,精度明显高于传统方法,但常系数全局拟合的气候基准值忽略了降水分布的空间非平稳性,导致降水模拟受到较大影响。为增强降水降尺度的气候背景值的描述能力,通过分析全国尺度降水的非线性非平稳性特点,提出耦合空间变系数气候基准值的HASM空间变系数降尺度模型(HASM-SVDM)以改进HASM对非平稳要素的降尺度能力,并以1961-2010年全国气温降水观测数据结合地形特征信息,利用HASM降尺度方法对HadCM3的A1Fi、A2a和B2a 3种情景的1961-1990、2010-2039、2040-2069和2070-2099时段的全国未来气温与降水进行降尺度模拟。分析表明,耦合全局线性模型的HASM常系数降尺度模型适合全国气温的降尺度模拟,而耦合空间变系数拟合的HASM-SVDM增强了空间非平稳背景值的描述能力,模拟的空间分布更能体现降水总体的非均匀分布趋势,适合全国降水的降尺度模拟。
HASM-based climatic downscaling model over China [J].https://doi.org/10.3724/SP.J.1047.2012.00599 URL Magsci [本文引用: 1] 摘要
与站点统计降尺度插值和动力降尺度相比,高精度曲面建模(HASM)降尺度,具有不需大尺度预报因子,直接从GCM结果构建区域上高空间分辨率的未来气候模拟曲面的优势。HASM降尺度将未来气候,分为历史观测拟合的气候基准值和GCM未来气候变化值进行模拟,精度明显高于传统方法,但常系数全局拟合的气候基准值忽略了降水分布的空间非平稳性,导致降水模拟受到较大影响。为增强降水降尺度的气候背景值的描述能力,通过分析全国尺度降水的非线性非平稳性特点,提出耦合空间变系数气候基准值的HASM空间变系数降尺度模型(HASM-SVDM)以改进HASM对非平稳要素的降尺度能力,并以1961-2010年全国气温降水观测数据结合地形特征信息,利用HASM降尺度方法对HadCM3的A1Fi、A2a和B2a 3种情景的1961-1990、2010-2039、2040-2069和2070-2099时段的全国未来气温与降水进行降尺度模拟。分析表明,耦合全局线性模型的HASM常系数降尺度模型适合全国气温的降尺度模拟,而耦合空间变系数拟合的HASM-SVDM增强了空间非平稳背景值的描述能力,模拟的空间分布更能体现降水总体的非均匀分布趋势,适合全国降水的降尺度模拟。
|
| [21] |
2001-2010年石羊河流域上游TRMM降水资料的降尺度研究 [J].https://doi.org/10.11820/dlkxjz.2013.09.012 URL [本文引用: 1] 摘要
在地形比较复杂的石羊河流域上游,基于2001-2010年TRMM3B43降水数据和1 km空间分辨率DEM数据,采用回归方程+残差法的插值方法,对石羊河流域上游10年平均TRMM3B43和2001、2007年两个典型干、湿年份的TRMM3B43数据分别进行降尺度操作,将空间分辨率由原来的0.25°×0.25°提高为1 km×1 km。利用研究区34个雨量站的观测数据作为"真实值",对2001-2010年的TRMM3B43和降尺度结果进行精度检验,结果表明:TRMM3B43降水数据整体上具有一定的可信度,但比地面站点观测的降水量偏小;TRMM3B43经过降尺度之后,数据在空间分辨率和精度方面都有一定程度的提高,其中10年平均TRMM3B43降尺度结果的精度要高于2001年(干旱),而2001年的降尺度结果精度又高于2007年(湿润);就单个雨量站而言,位于西部高海拔区域的站点的降尺度结果精度较高,而位于东部低海拔区域的站点的降尺度结果精度较低。
Spatial downscaling of TRMM precipitation data based on DEM in the upstream of Shiyang river basin during 2001-2010 [J].https://doi.org/10.11820/dlkxjz.2013.09.012 URL [本文引用: 1] 摘要
在地形比较复杂的石羊河流域上游,基于2001-2010年TRMM3B43降水数据和1 km空间分辨率DEM数据,采用回归方程+残差法的插值方法,对石羊河流域上游10年平均TRMM3B43和2001、2007年两个典型干、湿年份的TRMM3B43数据分别进行降尺度操作,将空间分辨率由原来的0.25°×0.25°提高为1 km×1 km。利用研究区34个雨量站的观测数据作为"真实值",对2001-2010年的TRMM3B43和降尺度结果进行精度检验,结果表明:TRMM3B43降水数据整体上具有一定的可信度,但比地面站点观测的降水量偏小;TRMM3B43经过降尺度之后,数据在空间分辨率和精度方面都有一定程度的提高,其中10年平均TRMM3B43降尺度结果的精度要高于2001年(干旱),而2001年的降尺度结果精度又高于2007年(湿润);就单个雨量站而言,位于西部高海拔区域的站点的降尺度结果精度较高,而位于东部低海拔区域的站点的降尺度结果精度较低。
|
| [22] |
Projecting regional change [J].https://doi.org/10.1126/science.aaa0629 URL [本文引用: 1] |
| [23] |
中国西北内陆河水问题及其应对策略——以黑河流域为例 [J].https://doi.org/10.3969/j.issn.1000-0240.2006.03.017 URL Magsci [本文引用: 1] 摘要
中国被联合国列为13个贫水国之一,占国土面积1/3的内陆河地区先天性的水资源不足,再叠加不合理的利用,使得水问题成为西北内陆河流域经济发展和生态保护的关键性问题.以黑河为例论述了流域尺度的水、土、生态、环境及管理问题;提出缓解流域水资源矛盾必须在流域尺度提高水效益的适应对策;讨论了绿洲灌区水资源利用率提高的4个环节,即灌溉水向土壤水转化、土壤水的生物利用、生物水的生产率以及市场需求的产业配置;展示了水源涵养、节水型绿洲建设、生态水利用率提高的部分实例;分析了水资源的社会化管理的阶段、问题与途径,强调流域虚拟水配置战略,指出提高流域水-生态-经济综合效益仍有较大潜力.
Water issue and its countermeasure in the inland river basins of northwest china-a case study in Heihe river basin [J].https://doi.org/10.3969/j.issn.1000-0240.2006.03.017 URL Magsci [本文引用: 1] 摘要
中国被联合国列为13个贫水国之一,占国土面积1/3的内陆河地区先天性的水资源不足,再叠加不合理的利用,使得水问题成为西北内陆河流域经济发展和生态保护的关键性问题.以黑河为例论述了流域尺度的水、土、生态、环境及管理问题;提出缓解流域水资源矛盾必须在流域尺度提高水效益的适应对策;讨论了绿洲灌区水资源利用率提高的4个环节,即灌溉水向土壤水转化、土壤水的生物利用、生物水的生产率以及市场需求的产业配置;展示了水源涵养、节水型绿洲建设、生态水利用率提高的部分实例;分析了水资源的社会化管理的阶段、问题与途径,强调流域虚拟水配置战略,指出提高流域水-生态-经济综合效益仍有较大潜力.
|
| [24] |
GIS支持下黑河流域降水台站的地形代表性 [J].https://doi.org/10.13885/j.issn.0455-2059.2015.02.004 URL [本文引用: 1] 摘要
以黑河流域为研究区,通过定义 降水台站的地形代表性指数,详细分析18个国家气象站及32个水文站在相应泰森多边形区及高程带上的地形代表性.结果表明:降水台站的地形代表性取决于区 域台站数量及其空间分布,尤其是地形的复杂程度;广阔的流域下游地形相对平坦,有限的降水台站具有较好的地形代表性,而在面积较小的中上游地区,除水文站 中的鹦鸽咀、冰沟和鸳鸯池3站高估了地形复杂性外,较密集的台站因局地地形复杂程度低于对应区域的地形平均复杂程度,地形代表性被低估;国家气象站的地形 代表性优于水文站的.该研究可为降水模拟中台站的优选及分布式降水精度的误差分析提供依据.
Terrain representation for the precipitation stations in Heihe river basin based on GIS [J].https://doi.org/10.13885/j.issn.0455-2059.2015.02.004 URL [本文引用: 1] 摘要
以黑河流域为研究区,通过定义 降水台站的地形代表性指数,详细分析18个国家气象站及32个水文站在相应泰森多边形区及高程带上的地形代表性.结果表明:降水台站的地形代表性取决于区 域台站数量及其空间分布,尤其是地形的复杂程度;广阔的流域下游地形相对平坦,有限的降水台站具有较好的地形代表性,而在面积较小的中上游地区,除水文站 中的鹦鸽咀、冰沟和鸳鸯池3站高估了地形复杂性外,较密集的台站因局地地形复杂程度低于对应区域的地形平均复杂程度,地形代表性被低估;国家气象站的地形 代表性优于水文站的.该研究可为降水模拟中台站的优选及分布式降水精度的误差分析提供依据.
|
| [25] |
First results from Version 7 TRMM 3B43 precipitation product in combination with a new downscaling-calibration procedure [J].https://doi.org/10.1016/j.rse.2012.12.002 URL [本文引用: 1] |
| [26] |
Latent heating characteristics of the MJO computed from TRMM Observations [J].https://doi.org/10.1002/2014JD022530 URL [本文引用: 1] 摘要
Abstract The Tropical Rainfall Measurement Mission's (TRMM) Spectral Latent Heating algorithm shows the contributions of different forms of convection to the latent heating profiles of the Madden-Julian Oscillation over the central Indian and West Pacific Oceans. In both oceanic regions, storms containing broad stratiform regions produce increased upper level heating during active Madden-Julian Oscillation (MJO) phases. The largest differences between the central Indian and West Pacific Ocean heating are associated with heating produced by convective elements. Examination of the most extreme forms of convection shows that mesoscale organized convection often produces at least as much latent heat as young vigorous deep convection. Heating from nonextreme (often midlevel-topped) convection is an important component of the MJO heating in both regions in all stages of the MJO. Over the central Indian Ocean the heating profile changes from having a maximum at 265km due to nonextreme convection to a profile during the active stage that has two maxima: one at 365km due to nonextreme convection and 665km owing to numerous mature mesoscale storms with broad stratiform precipitation components. Over the West Pacific, the maxima at 3 and 665km are present in all MJO stages, but the magnitude of the 665km maximum sharply increases in the active MJO stage due to an increase in the number of storms with broad stratiform precipitation areas.
|
| [27] |
1900-2009年中国均一化逐月降水数据集研制 [J].https://doi.org/10.11821/xb201203002 URL [本文引用: 1] 摘要
Based on the collection and processing of the China national-wide monthly station observational precipitation data in 1900-2009,the data series for each station has been tested for their homogeneity with the Standard Normalized Homogeneity Test(SNHT) method and the inhomogeneous parts of the series are adjusted or corrected.Based on the data,the precipitation anomalies during 1900-2009 and the climatology normals during 1971-2000 have been transformed into the grid boxes at 5°×5° and 2°×2° resolutions respectively.And two grid form datasets are constructed by combining the normal and anomalies.After that,the missing values for the 5°×5° grid dataset are interpolated by Empirical Orthogonal Function(EOF) techniques.With the datasets of different resolutions,the precipitation change series during 1900-2009 over Mainland China are built,and the annual and seasonal precipitation trends for the recent 110 years are analyzed.The result indicates that the annual precipitation shows a slight dryer trend during the past 110 years,notwithstanding lack of statistical confidence.It is worth noting that after the interpolation of the missing values,the annual precipitation amounts in the early 1900s become less,which increases the changing trend of the annual precipitation in China for the whole 110 years slightly(from-7.48 mm/100a to-6.48 mm/100a).
Development of homogenized monthly precipitation dataset in Chin during 1900-2009 [J].https://doi.org/10.11821/xb201203002 URL [本文引用: 1] 摘要
Based on the collection and processing of the China national-wide monthly station observational precipitation data in 1900-2009,the data series for each station has been tested for their homogeneity with the Standard Normalized Homogeneity Test(SNHT) method and the inhomogeneous parts of the series are adjusted or corrected.Based on the data,the precipitation anomalies during 1900-2009 and the climatology normals during 1971-2000 have been transformed into the grid boxes at 5°×5° and 2°×2° resolutions respectively.And two grid form datasets are constructed by combining the normal and anomalies.After that,the missing values for the 5°×5° grid dataset are interpolated by Empirical Orthogonal Function(EOF) techniques.With the datasets of different resolutions,the precipitation change series during 1900-2009 over Mainland China are built,and the annual and seasonal precipitation trends for the recent 110 years are analyzed.The result indicates that the annual precipitation shows a slight dryer trend during the past 110 years,notwithstanding lack of statistical confidence.It is worth noting that after the interpolation of the missing values,the annual precipitation amounts in the early 1900s become less,which increases the changing trend of the annual precipitation in China for the whole 110 years slightly(from-7.48 mm/100a to-6.48 mm/100a).
|
| [28] |
McGuire D. Remote sensing of vegetation and land-cover change in Arctic Tundra Ecosystems [J].https://doi.org/10.1016/j.rse.2003.10.018 URL [本文引用: 1] 摘要
The objective of this paper is to review research conducted over the past decade on the application of multi-temporal remote sensing for monitoring changes of Arctic tundra lands. Emphasis is placed on results from the National Science Foundation Land ir ce Interactions (LAII) program and on optical remote sensing techniques. Case studies demonstrate that ground-level sensors on stationary or moving track platforms and wide-swath imaging sensors on polar orbiting satellites are particularly useful for capturing optical remote sensing data at sufficient frequency to study tundra vegetation dynamics and changes for the cloud prone Arctic. Less frequent imaging with high spatial resolution instruments on aircraft and lower orbiting satellites enable more detailed analyses of land cover change and calibration/validation of coarser resolution observations. The strongest signals of ecosystem change detected thus far appear to correspond to expansion of tundra shrubs and changes in the amount and extent of thaw lakes and ponds. Changes in shrub cover and extent have been documented by modern repeat imaging that matches archived historical aerial photography. NOAA Advanced Very High Resolution Radiometer (AVHRR) time series provide a 20-year record for determining changes in greenness that relates to photosynthetic activity, net primary production, and growing season length. The strong contrast between land materials and surface waters enables changes in lake and pond extent to be readily measured and monitored.
|
| [29] |
数字高程模型地形描述精度量化模拟研究 [J].https://doi.org/10.3321/j.issn:1001-1595.2001.04.016 URL [本文引用: 1] 摘要
在首先提出数字高程模型(DEM)地形描述误差(Et)概念的基础上,以我国5个不同地貌类型区为试验样区,采用比较分析的方法,研究DEM地形描述误差的成因、影响因素、量测方法以及误差的数学模拟途径.统计分析的结果证明DEM地形描述误差与DEM空间分辨率及其地面粗糙度之间存在着线性相关关系,回归分析结果显示,DEM地形描述误差Et的均方差RMS值可以表达为DEM水平分辨率(R)与地面垂直曲率(V)的函数:RMS Et=(0.006 3V+0.006 6)R-0.022 V+0.241 5.该结果可用以估算所建立的DEM的地形描述精度,也为确定适宜的DEM分辨率提供了理论依据.
A simulation on the accuracy of DEM terrain representation [J].https://doi.org/10.3321/j.issn:1001-1595.2001.04.016 URL [本文引用: 1] 摘要
在首先提出数字高程模型(DEM)地形描述误差(Et)概念的基础上,以我国5个不同地貌类型区为试验样区,采用比较分析的方法,研究DEM地形描述误差的成因、影响因素、量测方法以及误差的数学模拟途径.统计分析的结果证明DEM地形描述误差与DEM空间分辨率及其地面粗糙度之间存在着线性相关关系,回归分析结果显示,DEM地形描述误差Et的均方差RMS值可以表达为DEM水平分辨率(R)与地面垂直曲率(V)的函数:RMS Et=(0.006 3V+0.006 6)R-0.022 V+0.241 5.该结果可用以估算所建立的DEM的地形描述精度,也为确定适宜的DEM分辨率提供了理论依据.
|
| [30] |
黑河流域降水的研究进展与展望 [J].
<FONT face=Verdana>归纳总结了黑河流域降水方面的已有研究成果,主要集中在流域降水的时空变化规律及降水的影响因子分析两个方面. 在降水变化研究方面,对整个流域降水的时空变化特征与上游祁连山区降水的变化特征分析已有不少工作;在降水影响因子研究方面,对上游祁连山区地形与降水的关系研究在逐步开展;水分条件、气候变化、人类活动与流域降水的关系研究也取得了一些进展. 这些研究使我们对流域的气候特征、降水分布情况及降水的地形影响等方面有了一定的了解. 为更全面、深入地研究黑河流域降水机理奠定了基础,但仍需在以下两个方面展开深入细致地研究: 1)与大尺度环流系统变化有关的水汽来源及输送对黑河流域降水的影响; 2)与地形有关的局地因子对黑河流域降水的影响. </FONT>
Study of the precipitation in the Heihe river basin: Progress and prospect [J].
<FONT face=Verdana>归纳总结了黑河流域降水方面的已有研究成果,主要集中在流域降水的时空变化规律及降水的影响因子分析两个方面. 在降水变化研究方面,对整个流域降水的时空变化特征与上游祁连山区降水的变化特征分析已有不少工作;在降水影响因子研究方面,对上游祁连山区地形与降水的关系研究在逐步开展;水分条件、气候变化、人类活动与流域降水的关系研究也取得了一些进展. 这些研究使我们对流域的气候特征、降水分布情况及降水的地形影响等方面有了一定的了解. 为更全面、深入地研究黑河流域降水机理奠定了基础,但仍需在以下两个方面展开深入细致地研究: 1)与大尺度环流系统变化有关的水汽来源及输送对黑河流域降水的影响; 2)与地形有关的局地因子对黑河流域降水的影响. </FONT>
|
| [31] |
黑河流域气候平均降水的精细化分布及总量计算 [J].
<FONT face=Verdana>利用黑河流域气象观测站降水资料和DEM资料,分析了气候平均年和月降水量与地理地形参数的关系. 结果显示,黑河流域气候平均降水量与测站的海拔、纬度、坡度显著相关,据此建立了降水量与地理地形参数的关系模型;拟合分析表明,年降水量拟合值与实测值的相关系数达0.94,二者在大部分地区分布特征基本一致,拟合值稍大;逐月降水量拟合相对误差在上游和中游都很小. 基于降水量与地理地形参数的关系模型,利用高分辨率DEM资料,扩展得到了黑河流域上中游100m×100m精细化分布的气候平均年降水量和各月降水量. 结果表明,精细化分布的降水量场能够表现出更多与地形和地势有关的细节,这是只利用气象测站资料的分析结果所不能反映的. 在黑河流域气候平均降水量空间精细化分布基础上,按照黑河流域上中游面积5.08×10⁴ km<SUP>2</SUP>计算,其气候平均年降水总量约为150.6×108 m<SUP>3</SUP>,降水主要集中在5-9月.</FONT>
The fine spatial distribution of mean precipitation and the estimation of total precipitation in Heihe river basin [J].
<FONT face=Verdana>利用黑河流域气象观测站降水资料和DEM资料,分析了气候平均年和月降水量与地理地形参数的关系. 结果显示,黑河流域气候平均降水量与测站的海拔、纬度、坡度显著相关,据此建立了降水量与地理地形参数的关系模型;拟合分析表明,年降水量拟合值与实测值的相关系数达0.94,二者在大部分地区分布特征基本一致,拟合值稍大;逐月降水量拟合相对误差在上游和中游都很小. 基于降水量与地理地形参数的关系模型,利用高分辨率DEM资料,扩展得到了黑河流域上中游100m×100m精细化分布的气候平均年降水量和各月降水量. 结果表明,精细化分布的降水量场能够表现出更多与地形和地势有关的细节,这是只利用气象测站资料的分析结果所不能反映的. 在黑河流域气候平均降水量空间精细化分布基础上,按照黑河流域上中游面积5.08×10⁴ km<SUP>2</SUP>计算,其气候平均年降水总量约为150.6×108 m<SUP>3</SUP>,降水主要集中在5-9月.</FONT>
|
| [32] |
地理加权回归基本理论与应用研究 [D].The basic theoretics and application research on geographically weighted regression [D]. |

/
| 〈 |
|
〉 |

