张星星 , 吕宁, 姚凌
ZHANG Xingxing, LV Ning, YAO Ling
通讯作者:
收稿日期: 2017-08-17
修回日期: 2017-10-17
网络出版日期: 2018-03-02
版权声明: 2018 《地球信息科学学报》编辑部 《地球信息科学学报》编辑部 所有
基金资助:
作者简介:
作者简介:张星星(1992-),男,安徽宿松人,硕士生,主要从事地表太阳辐射反演研究。E-mail: zhangxx.15s@igsnrr.ac.cn
展开
摘要
利用2000-2009年中国气象局(CMA)地表太阳辐射台站资料,对欧洲中期天气预报中心(ECMWF)地表太阳下行短波辐射产品进行多时间尺度的计算与分析,检验ECMWF地表辐射产品对于中国地区太阳辐射特征的表现。本文通过聚类分析将中国地区分为8个区域,考虑到ECMWF大气因素对ECMWF地表辐射的影响和大气因子分布的空间异质性,引入地理探测器对ECMWF再分析辐射产品的时空误差进行定量分析,来判明影响ECMWF辐射精度的主要大气因子。结果表明:总体上看,ECMWF地表太阳辐射要高于地面观测数据,月均偏差为18.28W/m2;ECMWF地表太阳辐射表现出季节性差异,夏秋季节明显好于春冬季节,相对偏差较大的数据集中分布在12、1、2和3月,相对偏差较小的数据集中分布在6、7、8和9月;不同区域在冬季和夏季的主导大气影响因子不同,夏季中国西北(1区)、高原(3区)、西南(4区)和四川盆地(5区)地区主导影响因子都是气溶胶,东南(6区)地区的主导影响因子是地表反照率和气溶胶,中东部地区(7区)的主导影响因子是云覆盖率和气溶胶,但是因子解释较小,分别为0.0228和0.0202,东北地区(8区)4个因子均未通过显著性系数检验,因子对相对偏差的变化影响不显著;冬季中国西北(1区)、高原(3区)、中东(7区)、东北(8区)和四川盆地(5区)地区的主导影响因子都是云覆盖率,西南(5区)和东南(6区)地区的辐射主要受到气溶胶的影响。
关键词:
Abstract
Comparison of surface radiation data of ECMWF (European Centre for Medium-Range Weather Forecasts) reanalysis data and data from station observation (China Meteorological Administration) is conducted at different time scales to check whether reanalysis data can reflect the characteristics of surface solar radiation over China. Based on the cluster analysis method, China is divided into 8 regions in order to study the regional differences of the surface radiation products of the ECMWF reanalysis data in China. Taking into account the influence of atmospheric factors on the earth's surface radiation and the spatial stratified heterogeneity of the atmospheric distribution, the geographical detector is used to find the causes of errors in different sites of reanalysis data. Overall, ECMWF is higher than the ground observation station data and the monthly deviation is 18.2835W/m2. ECMWF shows seasonal difference, greater deviation in spring and winter, less deviation in summer and autumn. Large relative deviation of the data mainly distributed in December, January, February and March while minor relative deviation of the data mainly concentrated in July, June, August and September. The dominant atmospheric factors in different regions are different in winter and summer. In summer, from zone 1 to 5 the dominant factors are aerosols and the power of determinant is larger. The dominant factors of the zone 6 are albedo and aerosol. The dominant factors of the zone 7 are cloud cover and aerosol but the power of determinant is small, merely 0.0228 and 0.0202, respectively. Failing significance test indicates that the four factors had no significant effect on the relative deviation in the zone 8. In winter, the dominant factors of zone 4, 6, 8 and zone 1, 3, 5, 7 are aerosol and cloud coverage, respectively.
Keywords:
地表太阳下行短波辐射(Downward Shortwave Radiation,DSR)是生态系统的重要能量来源。目前,获取地表太阳下行短波辐射数据主要有2种方式:① 直接利用太阳辐射观测台站获取短波辐射数据,但是中国太阳辐射观测台站较少且分布不均匀,获取空间连续的、长时间序列的地表太阳辐射观测数据受到了限制;② 利用卫星数据反演得到的地表短波数据,如 The Global Energy and Water Cycle Experiment(GEWEX)地表短波数据集,但是由于反演算法的适用性和传感器的精度等问题,数据的一致性较差[1,2],且卫星数据反演的时间覆盖范围是有限的。相对于卫星遥感数据和地面观测站点数据,再分析资料的优点在于建立了一个较长时间序列全球的有效的数据产品,再分析采用组合模型(地球物理流体动力学模型,包括辐射传输模型等)对大气进行动态一致的全球分析,并结合观测数据等各种数据源来限制动态模型,从而优化了产品的准确性和完整覆盖[3]。再分析作为一种全球通用的数据来源,在大气科学领域应用极为广泛[4,5,6,7,8]。但是,再分析资料的数据来源多种多样,数据的同化方案也不尽相同,同化过程中的错误源(如云和气溶胶)会导致再分析辐射产品的系统误差,了解再分析资料存在的不确定性和偏差是合理使用再分析资料的前提[9]。
目前已有相关研究利用地面站点地表辐射数据和遥感地表辐射产品对再分析地表辐射数据在站点、区域、全球等不同范围进行了多尺度的验证。研究结果表明大多数再分析地表辐射数据相对于地面观测站点数据偏大[10,11,12,13]。Brotzge[14]研究发现,美国国家环境预测中心(NCEP)NCEP-NCAR全球再分析数据相对于2个地面站点观测的地表辐射数据高估了17%~27%。Wang等[10]利用CMAP/Tibet(Coordinated Enhanced Observing Period (CEOP)-Asia-Australia Monsoon Project)提供的西藏地区9个观测站点数据,对6种再分析地表辐射数据(ERA-40、ERA-Interim、NCEP-NCAR、CFSR、 MERRA和GLDAS)的验证发现,再分析日均地表辐射数据比地面观测站点数据略大1.56~5.00 W/m2。Xia等[11]以中国气象局气候数据中心(CDC/CMA)46个一级站点地表辐射数据研究发现,NCEP多年平均地表辐射数据大于地面站点数据40~100 W/m2,NCEP地表辐射数据的代际变化趋势远小于地面观测站点资料0.03%~0.14%,并且定性的分析了NCEP高估的原因是由于NCEP模式低估了云的覆盖率,但是,研究没有考虑气溶胶的影响。此外,较少有研究表明再分析地表辐射产品在季节性变化、空间分布等方面是否具有一致性。Zhang等[15]从季节性变化和空间分布、全球尺度等方面对6种再分析地表辐射产品进行了相关研究,研究表明再分析地表辐射与地面观测站点的全球月均偏差为11.25~49.80 W/m2,并且发现在全球尺度上,云量的低估可能导致再分析地表辐射的高估。
目前大部分研究都是对再分析地表辐射产品误差的分析,并未探究其成因。太阳辐射受到云、气溶胶、地表反照率、水汽含量等因素影响,不同地区的地表太阳辐射存在着很大的时空差异。本文根据ECMWF再分析地表太阳辐射变化的区域分布特征,把中国地区分为8个区域。在此基础上,引入地理探测器对ECMWF再分析辐射产品的时空误差进行分析,并对不同区域的太阳辐射主导大气因子影响进行定量研究。
本文使用2000-2009年的ECMWF再分析资料,其中包括地表太阳下行辐射、水汽含量、总云覆盖率、气溶胶光学厚度、地表反照率数据集,数据下载自ECMWF网站。中国地区的地表辐射地面观测站点数据由CMA提供。气溶胶光学厚度、云覆盖率、水汽含量和地表反照率验证数据集均来自于CERES(云和地球辐射能量系统)。再分析资料、CMA站点和CERES数据源的详细信息见表1。
表1 数据产品详细信息
Tab. 1 Details of the data products
| 数据源 | 数据时期 | 时间 分辨率 | 空间 分辨率 | 引用 |
|---|---|---|---|---|
| ERA-Interim | 1979年-至今 | 3 h | 0.75°×0.75° | 文献[16] |
| CMA | 1957年-至今 | 天 | N/A(站点) | http://cdc.nmic.cn/home.do |
| CERES | 2000年-至今 | 月 | 1°×1° | 文献[17] |
欧洲中期天气预报中心(European Centre for Medium-Range Weather,ECMWF)是国际性天气预报研究和业务机构。其提供的ERA-Interim再分析数据集的水平空间分辨率是0.75°(约80 km),垂正方向从地表面到0.1 hPa高空分为60级,时间分辨率为3 h。辐射计算基于快速辐射传输模型(RRTM)[18]。
中国气象局(China Meteorological Administration, CMA)是中国国家级别的气象行政管理部门。其提供了中国地区(港澳台除外)的122个地面站点数据集,每个数据集包括逐日的太阳总辐射,太阳直接辐射和太阳散射辐射3个物理量。辐射站点分布见图1。
CERES资料来自TRMM,Terra和Aqua 3颗卫星搭载的云、气溶胶和地球辐射能量系统的探测器,它提供了云和气溶胶等大气参数的合理反演[19],得出与地面到大气顶辐射通量相一致的地表和各大气参数的计算。研究证明CERES-EBAF较之其他格网地表辐射产品具有更高的精度。Zhang等[15]研究发现相对于再分析数据,CERES-EBAF地表辐射数据和地面观测站点地表辐射数据更加吻合,并且提供了更精确的云和气溶胶等大气产品信息。本文使用了CERES云、气溶胶等大气产品月均数据集,空间分辨率为1°。
国内的许多学者对CMA地面观测站点辐射资料进行质量检验发现,辐射资料的质量存在一定的问题,影响数据质量的主要因素有:辐射仪器的精度和标定、仪器操作过程中的人为因素以及台站变迁等[20]。在使用辐射资料作为验证数据之前,应该先进行质量检验。原站点数据已经对逐日的地表辐射数据进行了简单的物理质量控制,即总辐射的大小要高于散射辐射和直接辐射之和。在原站点数据的质量控制基础上,根据辐射数据本身的物理意义和辐射数据的统计特征给其设定一个阈值,只有通过物理阈值质量控制测试的地面观测站点数据,才能进行下一步实验。
本文参照Shi等[21]的研究,首先设置上限为每天地球大气顶接收到的辐射日总量G0/(MJ/m2),其计算公式为[22]:
式中:
每天的地球轨道偏心率校正因子
式中:
每天的太阳赤纬角
从物理学的角度来看,很难给太阳总辐射设置一个严格的下限。因为由于散射辐射的存在,太阳总辐射肯定大于零。本文参照Geiger等[26]的研究,设置下限为每天地球大气顶接收到的辐射日总量的3%。由表2物理阈值测试的结果可以看出,夏季的错误发生率明显更低。2000-2009年每天地表辐射观测数据平均错误百分率为1.98%。下文所有的验证分析只使用通过物理阈值质量控制测试的地面观测站点数据。
表2 GSR数据2000-2009年未通过物理阈值测试每月天数分布
Tab. 2 Monthly distribution of number of days for daily data failing the physical threshold test
| 月份 | 总数 | ||||||||||||
|---|---|---|---|---|---|---|---|---|---|---|---|---|---|
| 1 | 2 | 3 | 4 | 5 | 6 | 7 | 8 | 9 | 10 | 11 | 12 | ||
| 超过上限 | 75 | 60 | 216 | 307 | 477 | 330 | 276 | 171 | 123 | 138 | 100 | 55 | 2328 |
| 低于下限 | 695 | 516 | 397 | 305 | 323 | 298 | 201 | 259 | 364 | 436 | 510 | 539 | 4843 |
| 通过测试 | 29 920 | 27 569 | 30 077 | 29 088 | 29 890 | 29 072 | 30 213 | 30 260 | 29 213 | 30 116 | 29 090 | 30 096 | 354 604 |
| 错误百分率/% | 2.5090 | 2.2896 | 1.9974 | 2.0606 | 2.6067 | 2.1145 | 1.5543 | 1.4011 | 1.6397 | 1.8703 | 2.0539 | 1.9355 | 1.9800 |
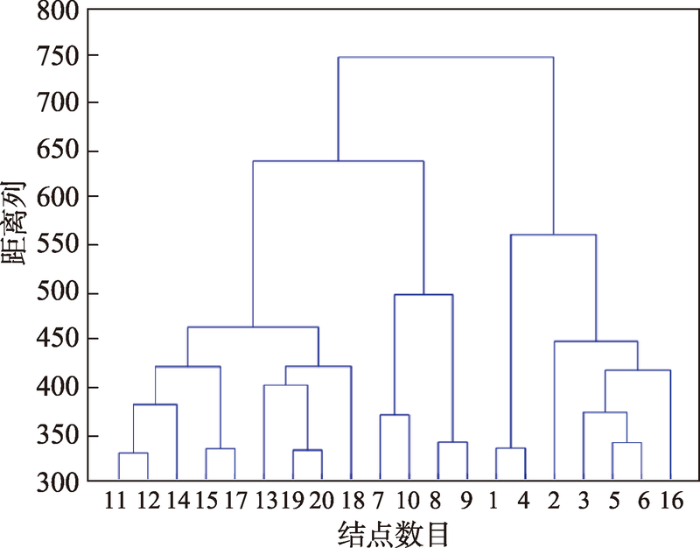
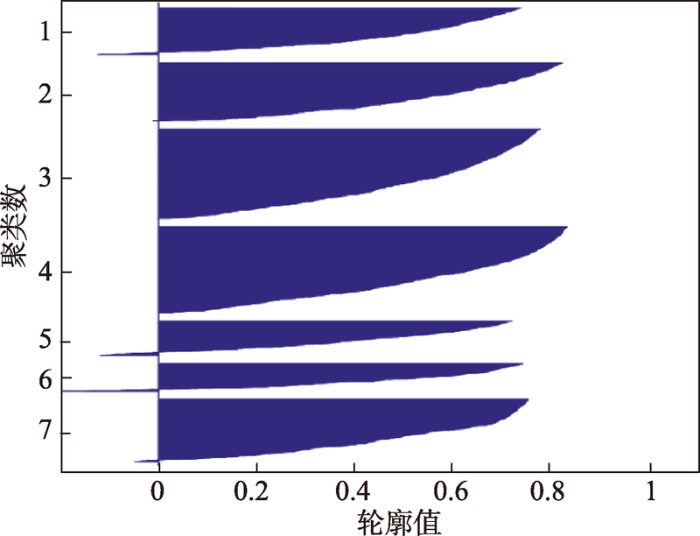
为了考察再分析资料在中国的区域性差异,许多学者采用了不同的分区方法[27,28],如以中国的气候区划分区,以晴空指数为主要依据的辐射分区等。为了考察再分析辐射数据的区域性差异,选用再分析辐射数据来进行辐射分区较为合理,本文使用MATLAB分层聚类的方法,利用2000-2009年的ECMWF再分析月均地表太阳辐射格网数据,首先根据dendrogram函数[29]画出分类族谱图(图2)来确定可能的聚类数目。然后,根据silhouette函数画出分类轮廓图(图3)来评价聚类信息,轮廓图是数据集中每个数据点的一个距离值,这个值是每个样本与同一类别中其它样本的不相似度以及与其他类别中样本的不相似度的一个关系值,其值越大越好。通过分类族谱图和轮廓图的调整,选择最佳聚类分析结果是7类。最后,根据MATLAB的K-means聚类分析方法进行聚类分析来确定不同区划。
聚类分析结果如下,5区和8区为一类,1、2、3、4、6和7区分别为一类,但是考虑到空间分布连续性,把5区和8区分为2个区,确定最终将中国地区分为8类,分别是:西北地区(1区)、高原地区(3区)、 西南地区(4区)、四川盆地地区(5区)、东南地区 (6区)、中东部地区(7区)和东北地区(8区),如图4所示。其中,2区仅有3个站点,站点较少且分布在2区边缘地区,不能均匀覆盖整个区域,不具有区域代表性,故本文不予讨论。
地理探测器刚开始是用于探寻地理空间分区因素对疾病风险影响机理的一种方法[30],能有效的识别多因子与地理现象的作用关系,被逐渐应用到地理科学和人文科学的研究中[31]。地理探测器的因子探测器可以检验单变量的空间分异性,而气溶胶、云层覆盖率、地表反照率、水汽含量等大气因子属于典型的类别变量,并对再分析地表辐射计算有重要影响,故适合采用地理探测器方法来更好地揭示区域大气因子对再分析地表辐射误差的影响。
为了分析中国地区不同区域地表太阳辐射误差变化的主导大气影响因子,本文利用地理探测器对ECMWF的气溶胶、云层覆盖率、地表反照率、水汽含量4个因子进行分析,计算4个因子在不同区域对地表太阳辐射误差的影响。以各区域站点地表辐射相对偏差作为空间分层变量Y,根据地理探测器模型Power of Determinant (PD)值衡量ECMWF大气因子对ECMWF地表太阳辐射相对偏差影响程度。设中国为研究区D,首先采用K-means聚类分析用大气因子X将中国划分为k个子区域,各个子区域的地表辐射站点个数和站点地表太阳辐射相对偏差的方差分别记为Nd1,Nd2,⋯,Ndk和
式中:i=1,2,3,k;Ndi为第i个子区域的站点个数;ND代表在整个中国区域D内所有地面辐射站点个数,
利用ECMWF再分析资料的逐3 h数据集计算得到逐日数据,经过处理得到月均、年平均、多年平均等数据。本文通过对2000-2009年ECMWF再分析地表辐射数据与CMA地面站点数据进行比较,对不同时间尺度再分析数据误差进行分析。
(1)时段变化
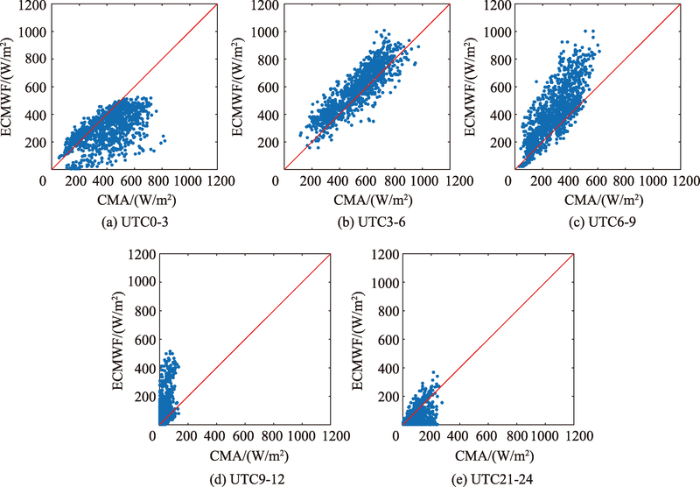
逐3 h再分析资料分UTC0,UTC3,UTC6,UTC9,UTC12,UTC15,UTC18h和UTC21h,对应北京时间分别要加8 h。由图5可知,如果将一天24 h分为8个时段,分别比较各个时段平均地表太阳辐射与地面观测站点数据,我国辐射观测不为零的情况可能出现在UTC0-3、UTC3-6、UTC6-9、UTC9-12和UTC21-24共5个时间段内,其中,UTC12-15、UTC15-18和UTC18-21共3个时间段的辐射偏弱甚至为零。再分析地表辐射与地面站点辐射数据不同时段比较发现,UTC3-6时为一日中辐射较强时刻,且相关性较高,其他时段数据相关性相对较弱。再分析资料能否很好地反应小时间尺度上的变化,也是考察再分析资料适用性的一个标准,以往对再分析资料误差的分析,都是从天、月、年等时间尺度上来考虑,本文从一天8个时段来分析再分析地表辐射的误差,对再分析误差分析研究具有一定参考价值。
图5 2000-2009 年ECMWF-CMA分时段月均地表辐射散点图
Fig. 5 Scatter plots of ECMWF-CMA average monthly surface radiation at different periods from 2000 to 2009
(2)季节性变化
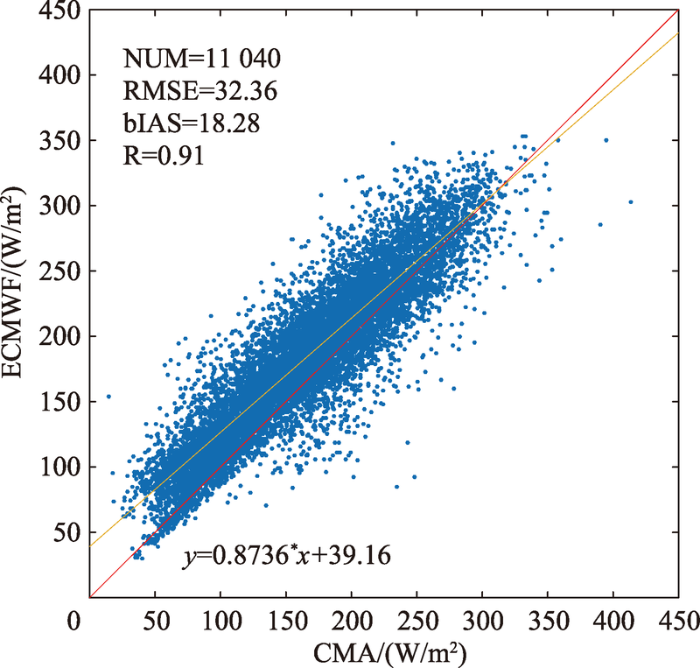
图6为2000-2009年ECMWF再分析数据和96个CMA地面观测站点数据的月均地表辐射散点图。从图6可看到,相关系数R为0.91,均方根误差为 32.36 W/m2,平均偏差为18.28 W/m2,且大多数点都在1:1线上方。实验表明ECMWF再分析地表辐射数据略高于地面观测站点数据,与前人研究结论一致。
图6 2000-2009年CMA-ECMWF月均地表辐射散点图
Fig. 6 Scatter plots of CMA-ECMWF average monthly surface radiation from 2000 to 2009
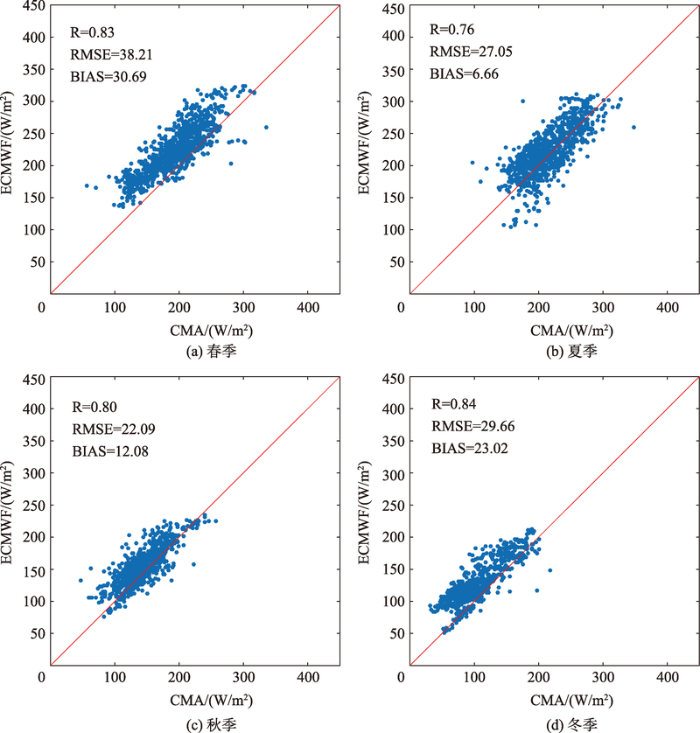
不同季节再分析资料与观测资料之间的差异也不相同,图7展示了2000-2009年的ECMWF再分析数据和CMA地面观测站点数据分季节地表辐射散点图。由图7可见,春夏秋冬4个季节的相关系数分别为0.83、0.76、0.80、0.84。均方根误差分别为38.21、27.05、22.08 和23.02 W/m2;平均偏差分别为30.70、6.66、12.08和23.02 W/m2。结果表明,不同季节ECMWF再分析资料与观测资料之间的差异不同,春冬季节的再分析数据明显高于地面观测站点数据,ECMWF再分析地表辐射数据春冬季节偏差大于夏秋季节。
图7 2000-2009年CMA-ECMWF分季节地表辐射散点图
Fig. 7 Seasonal scatter plots of CMA-ECMWF average monthly surface radiation from 2000 to 2009
(3)年际变化
图8为2000-2009年ECMWF再分析资料和CMA站点资料地表太阳辐射时间序列变化图。图8(a)中,ECMWF再分析资料的地表太阳辐射都要高于CMA站点资料。从图8(a)、(b)可看出,月均地表太阳辐射每年都在7月左右达到峰值,1月左右达到谷值。相对偏差的计算方法如式(6)所示。
式中:RB表示相对偏差,其值为正时表示再分析数据高于地面观测数据,为负时表示再分析数据低于地面观测数据。由图8(d)所有站点月均相对偏差频率分布图可见,相对偏差较小(-5%~10%)在 6-10月分布频率较高,相对偏差较大(15%~35%)在12-4月分布频率较高。这种季节性的差异可能是由于水汽、气溶胶、地表反照率、云覆盖率等大气因素的季节性差异引起的。
图8 2000-2009年CMA-ECMWF地表太阳辐射时间序列图
Fig. 8 Time series of monthly mean (a), anomalies (b) and relative bias to monthly mean(c) and relative bias frequency distribution (d) for CMA-ECMWF average monthly surface radiation from 2000 to 2009.
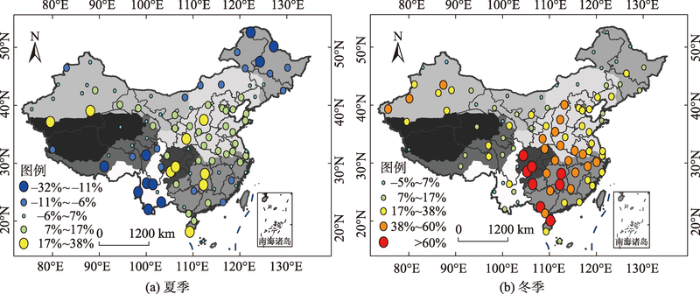
考虑到再分析资料与观测资料之间相对偏差的季节性变化,不同季节起主导影响的大气因子不一样,本文把2000-2009年按照冬季(12、1、2和 3月)和夏季(6、7、8和9月)两部分来进行区域大气影响因子分析。图9(a)、(b)分别表示夏季和冬季ECMWF再分析地表太阳辐射平均相对偏差分布图。从图9可看到,夏季正相对偏差较大站点主要分布在中国东南地区(6区)、中东部地区(7区)和四川盆地地区(5区),负相对偏差较大站点主要分布高原地区(3区)、西南地区(4区)和东北地区(8区);冬季站点相对偏差基本上都为正,在冬季ECMWF地表辐射数据表现出明显的高估,相对偏差较大站点主要分主要分布在中国东南地区(6区)、中东部地区(7区)和四川盆地地区(5区)。
图9 2000-2009年ECMWF-CMA地表太阳辐射平均相对偏差分布图
Fig. 9 Distribution of average relative deviation of ECMWF-CMA surface solar radiation from 2000 to 2009
为了分析中国地区不同分区影响ECMWF再分析地表太阳辐射相对偏差变化的主导大气影响因子,把地表太阳辐射相对偏差作为空间分层变量Y,利用地理探测器对ECMWF的气溶胶、云层覆盖率、地表反照率、水汽含量4个因子进行分析,分别计算得到夏季和冬季4个因子在不同区域的因子解释力大小,因子解释力越大,表示因子对相对偏差变化的影响越显著,如表3所示。
表3 中国各个区域因子解释力
Tab. 3 Power of the determinant of China's regions
| 分区 | 夏季(6、7、8和9月) | 冬季(12、1、2和3月) | |||||||
|---|---|---|---|---|---|---|---|---|---|
| 气溶胶 | 云覆盖率 | 水汽含量 | 地表反照率 | 气溶胶 | 云覆盖率 | 水汽含量 | 地表反照率 | ||
| 1 | 0.3405 | 0.0516(N) | 0.0460 | 0.0302(N) | 0.0196(N) | 0.2085 | 0.0124(N) | 0.0184(N) | |
| 2 | 0.4953 | 0.2546 | 0.2210 | 0.0497(N) | 0.4457 | 0.0587(N) | 0.4952 | 0.1080(N) | |
| 3 | 0.3405 | 0.0202(N) | 0.0432(N) | 0.1789 | 0.0843(N) | 0.2396 | 0.0899 | 0.0477(N) | |
| 4 | 0.3753 | 0.2221 | 0.2507 | 0.5970(N) | 0.4899 | 0.1088 | 0.1173 | 0.0266(N) | |
| 5 | 0.3258 | 0.0426(N) | 0.1047 | 0.1941 | 0.1128 | 0.1174 | 0.0933 | 0.0504(N) | |
| 6 | 0.2278 | 0.0550(N) | 0.0920 | 0.2556 | 0.2074 | 0.0284(N) | 0.0091(N) | 0.0211(N) | |
| 7 | 0.0202 | 0.0228 | 0.0125 | 0.0173 | 0.0626 | 0.1225 | 0.0961 | 0.0072(N) | |
| 8 | 0.0502(N) | 0.0522(N) | 0.0355(N) | 0.0965(N) | 0.1113 | 0.2828 | 0.0058(N) | 0.0304(N) | |
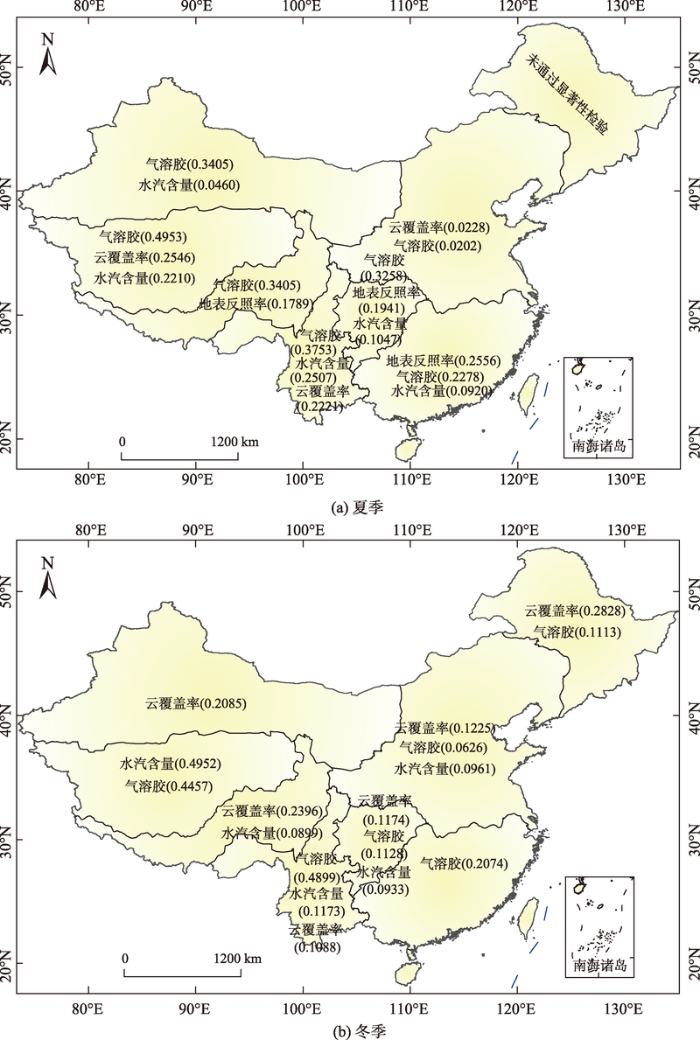
从中国各个区域因子解释力分布图(图10)来看,夏季中国西北地区(1区)、高原地区(3区)、西南地区(4区)和四川盆地地区(5区)的主导影响因子都是气溶胶,且因子解释力较大;东南(6区)地区的主导影响因子是地表反照率和气溶胶;中东部地区(7区)的主导影响因子是云覆盖率和气溶胶,但是因子解释较小,分别为0.0228和0.0202;东北地区(8区)4个因子均未通过显著性系数检验,说明在该区4个因子对相对偏差变化的影响不显著。冬季中国西南地区(4区)、东南地区(6区)的主导影响因子是气溶胶;西北地区(1区)、高原地区(3区)、中东部地区(7区)、东北地区(8区)和四川盆地地区(5区)的主导影响因子是云覆盖率。而在冬季地表反照率都未通过显著性系数检验,说明在冬季地表反照率对相对偏差变化的影响不显著。综合夏季和冬季可以发现,气溶胶和云覆盖率对ECMWF地表太阳辐射相对偏差变化影响更加显著,是2个重要的主导影响因子。
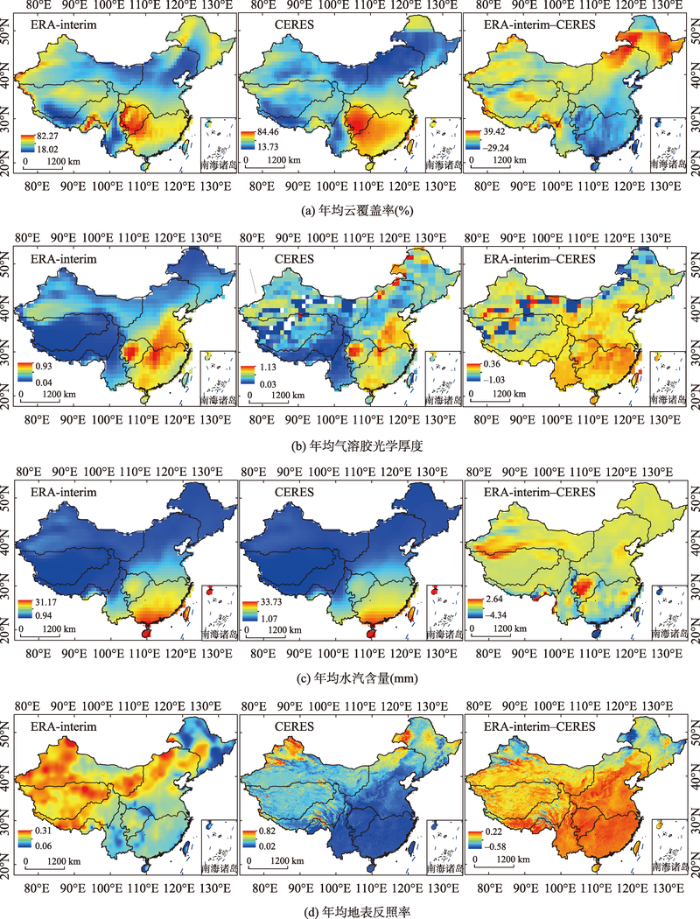
以上得到了各个区域的主导大气影响因子和因子解释力的大小,由于CERES大气参数产品具有相对较高的精度,采用2000-2009年CERES的云覆盖率、气溶胶、水汽含量和地表反照率产品和ERA-interim的大气产品相比较进行验证分析,得到夏季和冬季平均ERA-interim与CERES大气产品区域分布对比图(图11、12),结合中国各个区域因子解释力图(图10),判断各区域ECMWF大气参数的变化是否和主导大气影响因子相符合。
图11 2000-2009夏季平均ERA-interim与CERES大气产品区域分布对比图
Fig. 11 Comparisons of ERA-interim and CERES average atmosphere product in summer on regional scale from 2000 to 2009
夏季,从地表太阳辐射平均相对偏差(图9(a))、区域因子解释力(图10(a))和大气产品区域分布对比图(图11)来看:中国西北(1区)、高原(3区)、西南(4区)、东南(6区)、中东部(7区)和四川盆地地区(5区)都受到气溶胶的影响,气溶胶是西北、高原、西南和四川盆地地区的主导影响因子。其中西北地区ECMWF气溶胶北边被高估南边被低估,站点地表太阳辐射相对偏差也表现出北低南高的现象,西北地区地表辐射的变化主要受到气溶胶的影响;高原地区ECMWF气溶胶被高估,地表太阳辐射相对偏差为负的站点占主要部分,高原地区的辐射低估主要由于气溶胶的高估;西南地区虽然气溶胶是主导影响因子,但是云覆盖率和水汽含量的因子解释力之和大于气溶胶因子解释力,综合影响力更强,ECMWF云覆盖率和水汽含量均被高估,所以西南地区辐射表现出被低估的现象;四川盆地地区ECMWF气溶胶被严重低估,地表太阳辐射相对偏差为正的站点占主要部分,四川盆地辐射高估主要由于气溶胶的低估;东南部地区的辐射变化最主要受到地表反照率的影响;中东部地区主导影响因子是云覆盖率和气溶胶,中国中东部ECMWF云覆盖率西北边略被高估,气溶胶在东南边明显被低估,站点地表太阳辐射相对偏差也表现出西北低东南高的现象,中东部地区辐射变化受到云覆盖率和气溶胶共同影响。
冬季,从地表太阳辐射平均相对偏差(图9(b))、区域因子解释力(图10(b))和大气产品区域分布对比图(图12)来看:中国西北(1区)、高原(3区)、西南(4区)、中东(7区)、东北(8区)和四川盆地地区(5区)都受到云覆盖率的影响,云覆盖率是西北、高原、中东、东北和四川盆地地区的主导影响因子。其中西北、高原和东北地区ECMWF云覆盖率明显被高估,地表太阳辐射相对偏差为负的站点在这些区域占主要部分,西北、高原和东北地区的辐射低估主要由于ECMWF云覆盖率的高估;西南和东南地区主导影响因子是气溶胶,这2个区域ECMWF气溶胶被高估,地表太阳辐射相对偏差较小的站点占主要部分,西南和东南地区的辐射主要受到气溶胶的影响;四川盆地地区主导影响因子是云覆盖率和气溶胶,ECMWF气溶胶和云覆盖率在四川盆地地区明显被低估,水汽含量被高估,气溶胶和云覆盖率解释力之和(0.2302)要远大于水汽含量(0.0933),且四川盆地地区相对偏差为正的站点占主要部分,因此在四川盆地地区冬季由于ECMWF气溶胶和云覆盖率的低估从而导致了地表太阳辐射的高估;中东部地区主导影响因子是云覆盖率,ECMWF云覆盖率在北边明显被高估,且站点相对偏差在中东部地区也表现出北低南高的现象,中东部地区辐射变化主要受到云覆盖率的影响。
图12 2000-2009年冬季平均ERA-interim与CERES大气产品区域分布对比图
Fig. 12 Comparisons of ERA-interim and CERES average atmosphere product in winter on regional scale from 2000 to 2009
本文分析研究ECMWF再分析资料地表太阳下行辐射产品在中国的误差及成因,主要结论如下:
(1)多时间尺度的数据误差评估。ECMWF要高于地面观测数据,月均偏差为18.28 W/m2;再分析地表辐射与地面站点辐射数据不同时段比较发现,UTC3-6时ECMWF相关性较高,其他时段数据相关性相对较弱。ECMWF表现出季节性差异,夏秋季节明显好于春冬季节,相对偏差较大的数据集中分布在12、1、2和3月,相对偏差较小的数据集中分布在6、7、8和9月。
(2)基于地理探测器的再分析辐射产品时空误差分析。为了考察再分析数据的区域性差异,本文通过聚类分析对中国地区进行辐射分区,考虑到ECMWF大气因素对ECMWF地表辐射的影响和大气因子分布的空间异质性,引入地理探测器对ECMWF再分析辐射产品的时空误差进行定量分析,来判明影响ECMWF辐射精度的主要大气因子。
(3)不同区域的主要大气影响因子分析。不同区域在冬季和夏季的主导大气影响因子不同,夏季中国西北(1区)、高原(3区)、西南(4区)和四川盆地(5区)地区主导影响因子都是气溶胶,且因子解释力较大,东南(6区)地区的主导影响因子是地表反照率和气溶胶,中东部地区(7区)的主导影响因子是云覆盖率和气溶胶,东北地区(8区)4个因子对相对偏差的变化影响不显著;冬季中国西北(1区)、高原(3区)、中东(7区)、东北(8区)和四川盆地(5区)地区的主导影响因子都是云覆盖率,西南(5区)和东南(6区)地区的辐射主要受到气溶胶的影响,在冬季地表反照率在各区都未通过显著性系数检验。综合夏季和冬季,中国地区ECMWF地表太阳辐射在夏季主要受气溶胶的影响,冬季主要受云覆盖率的影响。
本文可以进一步提高和完善:① 缺乏质量较高的大气参数数据与ECMWF再分析大气参数数据进行对比验证,使验证结果更具有说服性;② 目前使用的CMA地面站点数仅为96个,为了使站点能均匀覆盖整个研究区域,加强因子解释力的说服性,下一步的研究将新增716个由青藏高原多圈层模拟与数据同化中心提供的地表辐射数据。
致谢:感谢中国气象研究中心提供的中国地面观测站点数据,感谢欧洲中期天气预报中心提供的ERA-Interim资料。感谢国家科技基础条件平台-国家地球系统科学数据共享平台(http://www.geodata.cn)提供数据支撑。
The authors have declared that no competing interests exist.
| [1] |
Surface radiation budgets in support of the GEWEX Continental-Scale International Project (GCIP) and the GEWEX Americas Prediction Project(GAPP), including the North American Land Data Assimilation System(NLDAS) project [J]. |
| [2] |
High resolution surface radiation products for studies of regional energy, hydrologic and ecological processes over Heihe river basin, northwest China [J].https://doi.org/10.1016/j.agrformet.2016.04.007 URL [本文引用: 1] 摘要
This paper presents a framework to obtain high spatial resolution regional surface photosynthetically active radiation (PAR), solar radiation (SSR) and net radiation (NR) products through combining Geostationary Meteorological Satellite (GMS) data, polar-orbiting satellite Moderate Resolution Imaging Spectrometer (MODIS) products and ground meteorological sites observations. Huang et al. (2011) approach was adopted and improved to directly retrieve instantaneous PAR and SSR from GMS data; while for NR the relationship between net radiation and net solar radiation was analyzed and calibrated using ground observations and Normalized Difference Vegetation Index (NDVI). Then these instantaneous estimates with temporal resolution of half hour would be averaged or integrated to acquire hourly and daytime accumulated PAR, SSR and NR. Taking Heihe river basin in northwest China, a typical oasis-desert area, as an example, the methodology was applied to produce year 2012 PAR, SSR and NR products. Ground measurements from Watershed Allied Telemetry Experimental Research (WATER, Li et al. (2009) ) and Heihe Watershed Allied Telemetry Experimental Research (HiWATER, Li et al. (2013) ) were used to perform the accuracy assessments. The results indicate highly reliable products at 1km resolution have been produced over this basin, and are applicable to the researches of the regional surface energy, hydrological and ecological processes.
|
| [3] |
Comparison of ERA40 and NCEP/DOE near-surface data sets with other ISLSCP-II data sets [J].https://doi.org/10.1029/2006JD007174 URL [本文引用: 1] 摘要
[1] The fields of 2-m temperature, relative humidity, precipitation, downward short-wave and long-wave radiation, net radiation, and sensible and latent heat flux from the ERA40 and NCEP/DOE reanalyses are compared with each other and with other independent ISLSCP-II data sets, where available. There are differences in the climatologies of the different data sets, but generally, they show consistent patterns of the major seasonal anomaly fields. The anomaly patterns are coherent, showing warm, dry seasonal biases associated with reduced precipitation and cloudiness, and the converse. This confirms that major changes in the atmospheric circulation patterns, with the associated differences in surface temperature, humidity, precipitation, cloud fields and incoming surface SW and LW radiation fluxes are captured by both reanalyses and the comparison ISLSCP-II data sets.
|
| [4] |
Global atmospheric downward longwave radiation at the surface from ground-based observations, satellite retrievals, and reanalysis [J].https://doi.org/10.1002/rog.20009 URL [本文引用: 1] 摘要
[1] Atmospheric downward longwave radiation at the surface (Ld) varies with increasing CO2 and other greenhouse gases. This study quantifies the uncertainties of current estimates of global Ld at monthly to decadal timescales and its global climatology and trends during the past decades by a synthesis of the existing observations, reanalyses, and satellite products. We find that current Ld observations have a standard deviation error of ~3.5 W m0908082 on a monthly scale. Observations of Ld by different pyrgeometers may differ substantially for lack of a standard reference. The calibration of a pyrgeometer significantly affects its quantification of annual variability. Compared with observations collected at 169 global land sites from 1992 to 2010, the Ld derived from state-of-the-art satellite cloud observations and reanalysis temperature and humidity profiles at a grid scale of ~100° has a bias of 00±9 W m0908082 and a standard deviation of 7 W m0908082, with a nearly zero overall bias. The standard deviations are reduced to 4 W m0908082 over tropical oceans when compared to Ld observations collected by 24 buoy sites from 2002 to 2011. The 0908084 W m0908082 bias of satellite Ld retrievals over tropical oceans is likely because of the overestimation of Ld observations resulting from solar heating of the pyrgeometer. Our best estimate of global means Ld from 2003 to 2010 are 34209000900±0900093 W m0908082 (global), 30709000900±0900093 W m0908082 (land), and 35609000900±0900093 W m0908082 (ocean). Estimates of Ld trends are seriously compromised by the changes in satellite sensors giving changes of water vapor profiles.
|
| [5] |
A two-Year comparison of the surface water and energy budgets between two OASIS sites and NCEP NCAR reanalysis data [J].https://doi.org/10.1175/1525-7541(2004)005<0311:ATCOTS>2.0.CO;2 URL [本文引用: 1] 摘要
Few surface-observation networks exist that provide comprehensive multiyear, multiseason observations of surface energy fluxes and subsurface soil moisture and temperature, combined with near-surface atmospheric data. More such networks are needed to validate, improve, and calibrate current global weather and climate models, including those used as the backbone or background models in global reanalysis. One such measurement system is the Oklahoma Mesonet09“Oklahoma Atmospheric Surface-layer Instrumentation System (OASIS), which provides atmospheric, surface, and soil data in real time. This study compares 2 yr of surface energy and water budget data from two OASIS sites located in two distinct climate zones with NCEP09“NCAR global reanalysis (GR) estimates. The intraseasonal hydrological and thermodynamic cycles are discussed. Results show generally good agreement between most reanalysis values and observations. Incoming and reflected shortwave radiation are largely overestimated by the GR, and incoming longwave radiation is slightly underestimated by the GR when compared to OASIS observations. The GR significantly overestimates latent heat (LE) at the Idabel, Oklahoma (IDAB) site. Furthermore, the GR likely underestimates entrainment of drier air from above the PBL and mixes the turbulent fluxes over too shallow of a layer. Both the reanalysis and observations find a positive water residual for the easternmost site (IDAB) but estimate a negative near-surface water residual for the western site [Boise City, Oklahoma (BOIS)]. Overall, surface fluxes and thermodynamic properties were well analyzed by the reanalysis at capturing the unique features associated with each OASIS site.
|
| [6] |
Evaluation of the Reanalysis Products from GSFC, NCEP, and ECMWF Using Flux Tower Observations [J].https://doi.org/10.1175/JCLI-D-11-00004.1 URL [本文引用: 1] 摘要
Reanalysis products produced at the various centers around the globe are utilized for many different scientific endeavors, including forcing land surface models and creating surface flux estimates. Here, flux tower observations of temperature, wind speed, precipitation, downward shortwave radiation, net surface radiation, and latent and sensible heat fluxes are used to evaluate the performance of various reanalysis products [NCEP-NCAR reanalysis and Climate Forecast System Reanalysis (CFSR) from NCEP; 40-yr European Centre for Medium-Range Weather Forecasts (ECMWF) Re-Analysis (ERA-40) and ECMWF Interim Re-Analysis (ERA-Interim) from ECMWF; and Modern-Era Retrospective Analysis for Research and Applications (MERRA) and Global Land Data Assimilation System (GLDAS) from the Goddard Space Flight Center (GSFC)]. To combine the biases and standard deviation of errors from the separate stations, a ranking system is utilized. It is found that ERA-Interim has the lowest overall bias in 6-hourly air temperature, followed closely by MERRA and GLDAS. The variability in 6-hourly air temperature is again most accurate in ERA-Interim. ERA-40 is found to have the lowest overall bias in latent heat flux, followed closely by CFSR, while ERA-40 also has the lowest 6-hourly sensible heat bias. MERRA has the second lowest and is close to ERA-40. The variability in 6-hourly precipitation is best captured by GLDAS and ERA-Interim, and ERA-40 has the lowest precipitation bias. It is also found that at monthly time scales, the bias term in the reanalysis products are the dominant cause of the mean square errors, while at 6-hourly and daily time scales the dominant contributor to the mean square errors is the correlation term. Also, it is found that the hourly CFSR data have discontinuities present due to the assimilation cycle, while the hourly MERRA data do not contain these jumps.
|
| [7] |
Long-term variability of solar direct and global radiation derived from ISCCP data and comparison with reanalysis data [J].https://doi.org/10.1016/j.solener.2006.03.004 URL [本文引用: 1] 摘要
Annual variations of solar radiation at the Earth’s surface may be strong and could seriously harm the return of investment for solar energy projects. This paper analyzes the long-term variability of broadband surface solar radiation based on 18 years of three-hourly satellite observations from the International Satellite Cloud Climatology Project (ISCCP). Direct normal irradiance (DNI) and global horizontal irradiance (GHI) at the surface are derived through radiative transfer calculations, using different physical input parameters describing the actual composition of the atmosphere. Validation of DNI is performed with two years of high resolution Meteosat-derived irradiance. Monthly averages show an average mean bias deviation of 611.7%. Results for DNI from the 18-year time series indicate strong and significant increases for several regions in the subtropics up to +402W/m 2 per year, with exception of Australia, where a small decrease in DNI of –102W/m 2 per year is observed. Inter-annual variability for DNI is very strong and sometimes exceeds 20%. Comparisons of calculations with and without volcanic aerosol reveal a decrease of up to 16% in annual averages due to volcano eruptions. Changes in GHI are much smaller and less significant. Results show a maximum increase of 0.802W/m 2 per year and an annual variability of less than 4%. Volcano eruptions reduce annual averages of GHI by less than 2.2%. The two reanalysis data sets investigated differ strongly from each other and are far off the validated results derived from satellite data. Trends are weaker and less significant or even of opposite sign.
|
| [8] |
效存德,等.不同再分析气温在东南极中山站-Dome A断面的适用性评价 [J].Assessment of air temperatures from different meteorological reanalyses for the East Antarctic region between Zhoushan and Dome A [J]. |
| [9] |
国外几套再分析资料的对比与分析 [J].https://doi.org/10.3969/j.issn.1671-6345.2010.01.001 URL [本文引用: 1] 摘要
针对目前最主要的3种再分析资料NCEP、ECMWF、JMA,从各家再分析中心所采用的同化方案、所用到的数据、质量控制方法及相关的偏差校正方法方面,进行相关介绍和对比,以便对再分析资料的特点有更为充分的了解,对我国未来再分析工作的发展起到借鉴作用。通过对比发现,各家再分析中心采用的同化方案主要为三维、四维变分方法和最优插值法。各家最主要的差别在于所选用的数据类型不同,以及所采用模式在分辨率上的差异。此外,还从经验出发简要给出了各类再分析资料在不同方面的优缺点,从而为各类再分析资料的选择使用方面提供参考。简单陈述了国内再分析工作的进展,并给出了提高我国再分析工作质量所需要关注和亟待解决的问题。
Comparative analysis of NCEP/NCAR, ECMWF and JMA reanalysis data [J].https://doi.org/10.3969/j.issn.1671-6345.2010.01.001 URL [本文引用: 1] 摘要
针对目前最主要的3种再分析资料NCEP、ECMWF、JMA,从各家再分析中心所采用的同化方案、所用到的数据、质量控制方法及相关的偏差校正方法方面,进行相关介绍和对比,以便对再分析资料的特点有更为充分的了解,对我国未来再分析工作的发展起到借鉴作用。通过对比发现,各家再分析中心采用的同化方案主要为三维、四维变分方法和最优插值法。各家最主要的差别在于所选用的数据类型不同,以及所采用模式在分辨率上的差异。此外,还从经验出发简要给出了各类再分析资料在不同方面的优缺点,从而为各类再分析资料的选择使用方面提供参考。简单陈述了国内再分析工作的进展,并给出了提高我国再分析工作质量所需要关注和亟待解决的问题。
|
| [10] |
Evaluation of multireanalysis products with in situ observations over the Tibetan Plateau [J].https://doi.org/10.1029/2011JD016553 URL [本文引用: 2] 摘要
[1] As the highest plateau in the world, the Tibetan Plateau (TP) strongly affects regional weather and climate as well as global atmospheric circulations. Here six reanalysis products (i.e., MERRA, NCEP/NCAR-1, CFSR, ERA-40, ERA-Interim, and GLDAS) are evaluated using in situ measurements at 63 weather stations over the TP from the Chinese Meteorological Administration (CMA) for 1992 2001 and at nine stations from field campaigns (CAMP/Tibet) for 2002 2004. The measurement variables include daily and monthly precipitation and air temperature at all CMA and CAMP/Tibet stations as well as radiation (downward and upward shortwave and longwave), wind speed, humidity, and surface pressure at CAMP stations. Four statistical quantities (correlation coefficient, ratio of standard deviations, standard deviation of differences, and bias) are computed, and a ranking approach is also utilized to quantify the relative performance of reanalyses with respect to each variable and each statistical quantity. Compared with measurements at the 63 CMA stations, ERA-Interim has the best overall performance in both daily and monthly air temperatures, while MERRA has a high correlation with observations. GLDAS has the best overall performance in both daily and monthly precipitation because it is primarily based on the merged precipitation product from surface measurements and satellite remote sensing, while ERA-40 and MERRA have the highest correlation coefficients for daily and monthly precipitation, respectively. Compared with measurements at the nine CAMP stations, CFSR shows the best overall performance, followed by GLDAS, although the best ranking scores are different for different variables. It is also found that NCEP/NCAR-1 reanalysis shows the worst overall performance compared with both CMA and CAMP data. Since no reanalysis product is superior to others in all variables at both daily and monthly time scales, various reanalysis products should be combined for the study of weather and climate over the TP.
|
| [11] |
Analysis of downwelling surface solar radiation in China from National Centers for Environmental Prediction reanalysis, satellite estimates, and surface observations [J].https://doi.org/10.1029/2005JD006130 URL [本文引用: 2] 摘要
[1] The Antarctic research stations of Dome C and Halley lie at similar latitudes (0908047500°S) and are thus subject to similar diurnal variation of solar radiation at the top of the atmosphere. However, the response of the atmospheric boundary layer to this diurnally varying forcing differs greatly at the two stations. At Dome C during summer there is a strong diurnal cycle in near-surface temperature and wind speed, and a shallow (090804350 m) convective boundary layer is observed to grow in response to diurnal heating. At Halley, diurnal variations in temperature and wind speed are smaller than those at Dome C, and there is no clear diurnal variability in boundary layer depth. Analysis of the summertime surface energy budget for both stations indicates that the main reason for the different diurnal variability at the two stations is the greater partitioning of available energy into latent heat flux at the warmer Halley station. We argue that the diurnally varying convective boundary layer observed at Dome C will not be typical of the whole of the East Antarctic plateau.
|
| [12] |
Decadal variation of surface solar radiation in the Tibetan Plateau from observations, reanalysis and model simulations [J].https://doi.org/10.1007/s00382-012-1383-3 URL [本文引用: 1] 摘要
In this study, the annual and seasonal variations of all-sky and clear-sky surface solar radiation (SSR) in the eastern and central Tibetan Plateau (TP) during the period 1960–2009 are investigated, based on surface observational data, reanalyses and ensemble simulations with the global climate model ECHAM5-HAM. The mean annual all-sky SSR series shows a decreasing trend with a rate of 611.00Wm 612 decade 611 , which is mainly seen in autumn and secondly in summer and winter. A stronger decrease of 612.80Wm 612 decade 611 is found in the mean annual clear-sky SSR series, especially during winter and autumn. Overall, these results confirm a tendency towards a decrease of SSR in the TP during the last five decades. The comparisons with reanalysis show that both NCEP/NCAR and ERA-40 reanalyses do not capture the decadal variations of the all-sky and clear-sky SSR. This is probably due to a missing consideration of aerosols in the reanalysis assimilation model. The SSR simulated with the ECHAM5-HAM global climate model under both all-sky and clear-sky conditions reproduce the decrease seen in the surface observations, especially after 1980. The steadily increasing aerosol optical depth (AOD) at 550nm over the TP in the ECHAM5-HAM results suggests transient aerosol emissions as a plausible cause.
|
| [13] |
Surface water and energy budgets for the mississippi river basin in three NCEP reanalyses [J].https://doi.org/10.1175/JHM-D-14-0056.1 URL [本文引用: 1] |
| [14] |
A two-year comparison of the surface water and energy budgets between two OASIS sites and NCEP NCAR Reanalysis Data [J].https://doi.org/10.1175/1525-7541(2004)005<0311:ATCOTS>2.0.CO;2 URL [本文引用: 1] 摘要
Few surface-observation networks exist that provide comprehensive multiyear, multiseason observations of surface energy fluxes and subsurface soil moisture and temperature, combined with near-surface atmospheric data. More such networks are needed to validate, improve, and calibrate current global weather and climate models, including those used as the backbone or background models in global reanalysis. One such measurement system is the Oklahoma Mesonet09“Oklahoma Atmospheric Surface-layer Instrumentation System (OASIS), which provides atmospheric, surface, and soil data in real time. This study compares 2 yr of surface energy and water budget data from two OASIS sites located in two distinct climate zones with NCEP09“NCAR global reanalysis (GR) estimates. The intraseasonal hydrological and thermodynamic cycles are discussed. Results show generally good agreement between most reanalysis values and observations. Incoming and reflected shortwave radiation are largely overestimated by the GR, and incoming longwave radiation is slightly underestimated by the GR when compared to OASIS observations. The GR significantly overestimates latent heat (LE) at the Idabel, Oklahoma (IDAB) site. Furthermore, the GR likely underestimates entrainment of drier air from above the PBL and mixes the turbulent fluxes over too shallow of a layer. Both the reanalysis and observations find a positive water residual for the easternmost site (IDAB) but estimate a negative near-surface water residual for the western site [Boise City, Oklahoma (BOIS)]. Overall, surface fluxes and thermodynamic properties were well analyzed by the reanalysis at capturing the unique features associated with each OASIS site.
|
| [15] |
Evaluation of the reanalysis surface incident shortwave radiation products from NCEP, ECMWF, GSFC, and JMA using satellite and surface observations [J].https://doi.org/10.3390/rs8030225 URL [本文引用: 2] 摘要
Solar radiation incident at the Earth’s surface (Rs) is an essential component of the total energy exchange between the atmosphere and the surface. Reanalysis data have been widely used, but a comprehensive validation using surface measurements is still highly needed. In this study, we evaluated the Rs estimates from six current representative global reanalyses (NCEP–NCAR, NCEP-DOE; CFSR; ERA-Interim; MERRA; and JRA-55) using surface measurements from different observation networks [GEBA; BSRN; GC-NET; Buoy; and CMA] (674 sites in total) and the Earth’s Radiant Energy System (CERES) EBAF product from 2001 to 2009. The global mean biases between the reanalysis Rs and surface measurements at all sites ranged from 11.25 W/m2 to 49.80 W/m2. Comparing with the CERES-EBAF Rs product, all the reanalyses overestimate Rs, except for ERA-Interim, with the biases ranging from 612.98 W/m2 to 21.97 W/m2 over the globe. It was also found that the biases of cloud fraction (CF) in the reanalyses caused the overestimation of Rs. After removing the averaged bias of CERES-EBAF, weighted by the area of the latitudinal band, a global annual mean Rs values of 184.6 W/m2, 180.0 W/m2, and 182.9 W/m2 were obtained over land, ocean, and the globe, respectively.
|
| [16] |
ERAInterim: New ECMWF reanalysis products from 1989 onwards [J].URL 摘要
react-text: 441 The SFB/TR172 is a DFG funded Collaborative Research Centre to identify, investigate, and evaluate the key processes contributing to Arctic Amplification (http://ac3-tr.de) /react-text react-text: 442 /react-text
|
| [17] |
Surface irradiances consistent with CERES-Derived Top-of-Atmosphere shortwave and longwave irradiances [J].https://doi.org/10.1175/JCLI-D-12-00436.1 URL 摘要
The estimate of surface irradiance on a global scale is possible through radiative transfer calculations using satellite-retrieved surface, cloud, and aerosol properties as input. Computed top-of-atmosphere (TOA) irradiances, however, do not necessarily agree with observation-based values, for example, from the Clouds and the Earth's Radiant Energy System (CERES). This paper presents a method to determine surface irradiances using observational constraints of TOA irradiance from CERES. A Lagrange multiplier procedure is used to objectively adjust inputs based on their uncertainties such that the computed TOA irradiance is consistent with CERES-derived irradiance to within the uncertainty. These input adjustments are then used to determine surface irradiance adjustments. Observations by the Atmospheric Infrared Sounder (AIRS), Cloud-Aerosol Lidar and Infrared Pathfinder Satellite Observations (CALIPSO), CloudSat, and Moderate Resolution Imaging Spectroradiometer (MODIS) that are a part of the NASA A-Train constellation provide the uncertainty estimates. A comparison with surface observations from a number of sites shows that the bias [root-mean-square (RMS) difference] between computed and observed monthly mean irradiances calculated with 10 years of data is 4.7 (13.3) W m(-2) for downward shortwave and -2.5 (7.1) W m(-2) for downward longwave irradiances over ocean and -1.7 (7.8) W m(-2) for downward shortwave and -1.0 (7.6) W m(-2) for downward longwave irradiances over land. The bias and RMS error for the downward longwave and shortwave irradiances over ocean are decreased from those without constraint. Similarly, the bias and RMS error for downward longwave over land improves, although the constraint does not improve downward shortwave over land. This study demonstrates how synergetic use of multiple instruments (CERES, MODIS, CALIPSO, CloudSat, AIRS, and geostationary satellites) improves the accuracy of surface irradiance computations.
|
| [18] |
Radiative transfer for inhomogeneous atmospheres: RRTM, a validated correlated-k model for the longwave [J].https://doi.org/10.1029/97JD00237 URL [本文引用: 1] 摘要
A rapid and accurate radiative transfer model (RRTM) for climate applications has been developed and the results extensively evaluated. The current version of RRTM calculates fluxes and cooling rates for the longwave spectral region (100900093000 cm0908081) for an arbitrary clear atmosphere. The molecular species treated in the model are water vapor, carbon dioxide, ozone, methane, nitrous oxide, and the common halocarbons. The radiative transfer in RRTM is performed using the correlated-k method: the k distributions are attained directly from the LBLRTM line-by-line model, which connects the absorption coefficients used by RRTM to high-resolution radiance validations done with observations. Refined methods have been developed for treating bands containing gases with overlapping absorption, for the determination of values of the Planck function appropriate for use in the correlated-k approach, and for the inclusion of minor absorbing species in a band. The flux and cooling rate results of RRTM are linked to measurement through the use of LBLRTM, which has been substantially validated with observations. Validations of RRTM using LBLRTM have been performed for the midlatitude summer, tropical, midlatitude winter, subarctic winter, and four atmospheres from the Spectral Radiance Experiment campaign. On the basis of these validations the longwave accuracy of RRTM for any atmosphere is as follows: 0.6 W m0908082 (relative to LBLRTM) for net flux in each band at all altitudes, with a total (100900093000 cm0908081) error of less than 1.0 W m0908082 at any altitude; 0.07 K d0908081 for total cooling rate error in the troposphere and lower stratosphere, and 0.75 K d0908081 in the upper stratosphere and above. Other comparisons have been performed on RRTM using LBLRTM to gauge its sensitivity to changes in the abundance of specific species, including the halocarbons and carbon dioxide. The radiative forcing due to doubling the concentration of carbon dioxide is attained with an accuracy of 0.24 W m0908082, an error of less than 5%. The speed of execution of RRTM compares favorably with that of other rapid radiation models, indicating that the model is suitable for use in general circulation models.
|
| [19] |
Clouds and the Earth's Radiant Energy System (CERES):Algorithm overview [J].https://doi.org/10.1109/36.701020 URL [本文引用: 1] 摘要
Clouds and the Earth's Radiant Energy System (CERES) is an investigation to examine the role of cloud/radiation feedback in the Earth's climate system. The CERES broadband scanning radiometers are an improved version of the Earth Radiation Budget Experiment (ERBE) radiometers. The CERES instruments will fly on several National Aeronautics and Space Administration Earth Observing System (EOS) satellites starting in 1998 and extending over at least 15 years. The CERES science investigations will provide data to extend the ERBE climate record of top-of-atmosphere shortwave (SW) and longwave (LW) radiative fluxes. CERES will also combine simultaneous cloud property data derived using EOS narrowband imagers to provide a consistent set of cloud/radiation data, including SW and LW radiative fluxes at the surface and at several selected levels within the atmosphere. CERES data are expected to provide top-of-atmosphere radiative fluxes with a factor of 2 to 3 less error than the ERBE data. Estimates of radiative fluxes at the surface and especially within the atmosphere will be a much greater challenge but should also show significant improvements over current capabilities.
|
| [20] |
Quality control of solar radiation data: Present status and proposed new approaches [J].https://doi.org/10.1016/j.energy.2004.04.031 URL [本文引用: 1] 摘要
During the past few decades, there has been a continual rise in interest in passive and active solar energy uses, not only in the governmental and commercial sectors, but also within the private sector. There is thus a need for taking measurements of solar irradiation and creating local and regional databases of irradiation and synoptic (meteorological) information. However, there is no guarantee of the quality of the data collected, as often due care is not exercised with respect to quality control of the measured dataset.This article reviews the presently available procedures for quality assessment of the solar irradiation data. Furthermore, we propose a set of stringent physical and statistical measures to create a semi-automated procedure that is based on the creation of an envelope in the clearness index iffuse to global irradiance ratio domain. The procedure is very general in nature and may be used with equal effectiveness for any terrestrial dataset.
|
| [21] |
Data quality assessment and the long-term trend of ground solar radiation in China [J].https://doi.org/10.1175/2007JAMC1493.1 URL [本文引用: 1] 摘要
Solar radiation is one of the most important factors affecting climate and the environment. Routine measurements of irradiance are valuable for climate change research because of long time series and areal coverage. In this study, a set of quality assessment (QA) algorithms is used to test the quality of daily solar global, direct, and diffuse radiation measurements taken at 122 observatories in China during 1957-2000. The QA algorithms include a physical threshold test (QA1), a global radiation sunshine duration test (QA2), and a standard deviation test applied to time series of annually averaged solar global radiation (QA3). The results show that the percentages of global, direct, and diffuse solar radiation data that fail to pass QA1 are 3.07%, 0.01%, and 2.52%, respectively; the percentages of global solar radiation data that fail to pass the QA2 and QA3 are 0.77% and 0.49%, respectively. The method implemented by the Global Energy Balance Archive is also applied to check the data quality of solar radiation in China. Of the 84 stations with a time series longer that 20 yr, suspect data at 35 of the sites were found. Based on data that passed the QA tests, trends in ground solar radiation and the effect of the data quality assessment on the trends are analyzed. There is a decrease in ground solar global and direct radiation in China over the years under study. Although the quality assessment process has significant effects on the data from individual stations and/or time periods, it does not affect the long-term trends in the data.
|
| [22] |
Prediction of hourly and daily diffuse fraction using neural network, as compared to linear regression models [J].https://doi.org/10.1016/j.energy.2006.10.010 URL [本文引用: 1] 摘要
For most of the locations all over Egypt the records of diffuse radiation in whatever scale are non-existent. In case that it exists, the quality of these records is not as good as it should be for most purposes and so an estimate of its values is desirable. To achieve such a task, an artificial neural network (ANN) model has been proposed to predict diffuse fraction ( K D) in hourly and daily scale. A comparison between the performances of the ANN model with that of two linear regression models has been reported. An attempt was also done to describe the ANN outputs in terms of first order polynomials relating K D with clearness index ( K T) and sunshine fraction ( S/ S 0). If care is taken in considering the corresponding regional climatic differences, these correlations can be generalized and transferred to other sites. The results hint that the ANN model is more suitable to predict diffuse fraction in hourly and daily scales than the regression models in the plain areas of Egypt.
|
| [23] |
A critical review on the estimation of daily global solar radiation from sunshine duration [J].https://doi.org/10.1016/j.enconman.2005.11.002 URL [本文引用: 1] 摘要
Models such as the Angstr02m–Prescott equation are used to estimate global solar radiation from sunshine duration. In the literature, researchers investigate either the goodness of the model itself or the goodness of the estimation of global solar radiation based on a set of statistical parameters such as R 2 , RMSE, MBE, MABE, MPE and MAPE. If the former is the objective, then the statistical analysis should naturally be based on H / H o 026102 S / S o (the ratio of daily solar radiation to extraterrestrial daily solar radiation vs. the ratio of sunshine duration to day length). If the latter is investigated, then the statistical analysis should be based on H c 026102 H m (calculated daily solar radiation vs. measured daily solar radiation). A literature survey undertaken in the present article showed that these two data sets are apt to be confused, drawing the statistical parameters to be used in assessment of the estimation model from the latter data set or the vice versa set. The statistical parameters are clearly derived from the basics for both of the data sets, and the inconsistencies caused by this confusion and other factors are exposed. A case study of the estimation models and global solar radiation estimation from sunshine duration is presented using five different models (linear, quadratic, cubic, logarithmic and exponential), which are the most common models used in the literature, based on 6 years long measured hourly global solar radiation data.
|
| [24] |
Quality control of global solar radiation using sunshine duration hours [J].https://doi.org/10.1016/j.energy.2008.09.006 URL [本文引用: 1] 摘要
The aim of this study was to develop a new and automatic method for controlling the quality of daily global solar radiation, G d , using sunshine duration hours. The new method has three levels of tests: first, G d is compared against daily extraterrestrial radiation that is received on a horizontal surface (0.03× G od 81 G d < G od ); second, G d should only exceed by a small amount of the daily clear sky irradiation that is observed under highly transparent clear skies ( G d <1.1 G cd ); and third, the method uses a series of persistence checks that utilize the relation between daily global solar radiation and relative sunshine duration hours. The method is capable of identifying systematic and non-systematic errors and its ability has been shown in three different climates including semi-arid, coastal humid and very arid climates.
|
| [25] |
Quality control and estimation of global solar radiation in China [J].https://doi.org/10.1016/j.solener.2010.01.006 URL [本文引用: 1] 摘要
Measurements of surface radiation in China are too sparse to meet demand for scientific research and engineering applications. Moreover, the radiation data often include erroneous and questionable values though preliminary quality-check has been done before the data release. Therefore, quality control of radiation data is often a prerequisite for using these data. In this study, a set of quality-check procedures were implemented to control the quality of the solar radiation measurements at 97 stations in China. A hybrid model for estimating global solar radiation was then evaluated against the controlled data. The results show that the model can estimate the global radiation with accuracy of MBE less than 1.502MJ02m 612 and RMSE less than 2.802MJ02m 612 for daily radiation and RMSE less than 2.002MJ02m 612 for monthly-mean daily radiation at individual stations over most of China except at a few stations where unsatisfactory estimates were possibly caused by severe air pollution or too dense clouds. The MBE averaged over all stations are about 0.702MJ02m 612 and RMSE about 2.002MJ02m 612 for daily radiation and RMSE about 1.302MJ02m 612 for monthly-mean daily radiation. Finally, this model was used to fill data gaps and to expand solar radiation data set using routine meteorological station data in China. This data set would substantially contribute to some radiation-related scientific studies and engineering applications in China.
|
| [26] |
A web service for controlling the quality of measurements of global radiation [J].https://doi.org/10.1016/S0038-092X(02)00121-4 URL [本文引用: 1] 摘要
The control of the quality of irradiation data is often a prerequisite to their further processing. Though data are usually controlled by meteorological offices, the sources are so numerous that the user often faces time-series of measurements containing questionable values. As customers of irradiation data, we established our own procedures to screen time-series of measurements. Since this problem of quality control is of concern to many researchers and engineers and since it is often a lengthy and tedious task, we decided to make this screening procedure available to everyone as a web service. This service is the purpose of this paper. The objective is not to perform a precise and fine control, an objective out of reach without details on the site and instruments, but to perform a likelihood control of the data and to check their plausibility. This is achieved by comparing observations with some expectations based upon the extraterrestrial irradiation and a simulation of the irradiation for clear skies. This service is available to everyone on the Web site www.helioclim.net. It offers a very convenient means to check time-series of irradiation: data are input in a HTML page by a copy and paste procedure and the return is also a HTML page that can be analyzed in detail for the data flagged as suspicious.
|
| [27] |
以晴空指数为主要依据的太阳辐射分区 [J].Solar radiation distribution based on clearness index [J]. |
| [28] |
NCEP再分析资料和中国站点观测资料的分析与比较 [J].https://doi.org/10.3969/j.issn.1006-9585.2004.02.005 URL [本文引用: 1] 摘要
美国国家环境预报中心(NCEP)和国家大气中心(NCAR)的全球再分析资料,在很多气候模拟和预测研究中都被作为区域气候模式的驱动场和初始场资料,并用来检验模拟结果的.作者通过对NCEP的2种再分析资料NCEPI和NCEPⅡ与中国台站观测资料的月平均温度和月降水总量进行相互插值,分析和比较了NCEPⅠ、NCEPⅡ再分析值与中国区域内观测值之间的差异以及2种再分析资料之间的差异.从结果可以看到,NCEP再分析资料的月平均温度较观测值普遍偏低,而月降水总量较观测值则偏高;就季节变化而言,NCEP再分析值在夏季和年平均模拟的较好,冬季较差.同时可以看到,在温度和降水方面NCEPⅡ较NCEPⅠ都有所改进,尤其在中国东部地区,改进较为明显.
An intercomparision between NCEP reanalysis data and observed data over China [J].https://doi.org/10.3969/j.issn.1006-9585.2004.02.005 URL [本文引用: 1] 摘要
美国国家环境预报中心(NCEP)和国家大气中心(NCAR)的全球再分析资料,在很多气候模拟和预测研究中都被作为区域气候模式的驱动场和初始场资料,并用来检验模拟结果的.作者通过对NCEP的2种再分析资料NCEPI和NCEPⅡ与中国台站观测资料的月平均温度和月降水总量进行相互插值,分析和比较了NCEPⅠ、NCEPⅡ再分析值与中国区域内观测值之间的差异以及2种再分析资料之间的差异.从结果可以看到,NCEP再分析资料的月平均温度较观测值普遍偏低,而月降水总量较观测值则偏高;就季节变化而言,NCEP再分析值在夏季和年平均模拟的较好,冬季较差.同时可以看到,在温度和降水方面NCEPⅡ较NCEPⅠ都有所改进,尤其在中国东部地区,改进较为明显.
|
| [29] |
Divisive Analysis (Program DIANA)[M]// Finding Groups in Data: An Introduction to Cluster Analysis . |
| [30] |
Geographical detectors-based health risk assessment and its application in the neural tube defects study of the Heshun region, China [J].https://doi.org/10.1080/13658810802443457 URL [本文引用: 1] 摘要
Physical environment, man‐made pollution, nutrition and their mutual interactions can be major causes of human diseases. These disease determinants have distinct spatial distributions across geographical units, so that their adequate study involves the investigation of the associated geographical strata. We propose four geographical detectors based on spatial variation analysis of the geographical strata to assess the environmental risks of health: the risk detector indicates where the risk areas are; the factor detector identifies factors that are responsible for the risk; the ecological detector discloses relative importance between the factors; and the interaction detector reveals whether the risk factors interact or lead to disease independently. In a real‐world study, the primary physical environment (watershed, lithozone and soil) was found to strongly control the neural tube defects (NTD) occurrences in the Heshun region (China). Basic nutrition (food) was found to be more important than man‐made pollution (chemical fertilizer) in the control of the spatial NTD pattern. Ancient materials released from geological faults and subsequently spread along slopes dramatically increase the NTD risk. These findings constitute valuable input to disease intervention strategies in the region of interest.
|
| [31] |
中国县域城镇化的空间特征与形成机理 [J].https://doi.org/10.11821/xb201208001 URL [本文引用: 1] 摘要
本文综合运用样带、地统计、地理探测器等多种研究方法,分析了1990年以来中国县域城镇化的时空特征及形成机理。研究表明:①中国县域城镇化水平时空动态的差异特征显著,北方边境县域高城镇化和东部沿海县域高城镇化形成的"人字形"空间形态逐渐凸显;以武汉都市圈为中心的两湖地区、成渝地区、关中—天水经济区的县域城镇化水平提升较快,西南地区、青藏高原地区保持较低的城镇化水平;②2000年以来中国县域城镇化水平及其变化速度的区域差异逐渐缩小,陇海兰新线、长江沿线、北方边境、106国道、东部沿海样带县域城镇化差异明显;县域经济发展阶段、固定资产投资、离中心城市距离、二三产业水平、农民人均纯收入、人口密度是影响县域城镇化空间分异的主要因素,同时粮食生产主导定位、非农业人口统计口径、城镇设置标准等因素也影响县域城镇化水平及发展过程。未来城镇化发展应遵循地域差异,凸显主导功能,推进优化与重点发展区的集约型城镇化、耕地与粮食主产区的分流型城镇化、生态与水源保护区的迁移型城镇化,以及园区与城镇近郊区的融入型城镇化,实现城乡土地资源集约利用,促进城镇化进程中人—地—业耦合与协调发展。
The spatial characteristics and formation mechanism of the county urbanization in China [J].https://doi.org/10.11821/xb201208001 URL [本文引用: 1] 摘要
本文综合运用样带、地统计、地理探测器等多种研究方法,分析了1990年以来中国县域城镇化的时空特征及形成机理。研究表明:①中国县域城镇化水平时空动态的差异特征显著,北方边境县域高城镇化和东部沿海县域高城镇化形成的"人字形"空间形态逐渐凸显;以武汉都市圈为中心的两湖地区、成渝地区、关中—天水经济区的县域城镇化水平提升较快,西南地区、青藏高原地区保持较低的城镇化水平;②2000年以来中国县域城镇化水平及其变化速度的区域差异逐渐缩小,陇海兰新线、长江沿线、北方边境、106国道、东部沿海样带县域城镇化差异明显;县域经济发展阶段、固定资产投资、离中心城市距离、二三产业水平、农民人均纯收入、人口密度是影响县域城镇化空间分异的主要因素,同时粮食生产主导定位、非农业人口统计口径、城镇设置标准等因素也影响县域城镇化水平及发展过程。未来城镇化发展应遵循地域差异,凸显主导功能,推进优化与重点发展区的集约型城镇化、耕地与粮食主产区的分流型城镇化、生态与水源保护区的迁移型城镇化,以及园区与城镇近郊区的融入型城镇化,实现城乡土地资源集约利用,促进城镇化进程中人—地—业耦合与协调发展。
|

/
| 〈 |
|
〉 |


