梅强 , 吴琳
, 吴琳
MEI Qiang, WU Lin
通讯作者:
收稿日期: 2017-12-28
修回日期: 2018-03-22
网络出版日期: 2018-05-20
版权声明: 2018 《地球信息科学学报》编辑部 《地球信息科学学报》编辑部 所有
基金资助:
作者简介:
作者简介:梅强(1987-),男,安徽宿州人,助教,主要从事船舶数据处理研究。E-mail: meiqiang@jmu.edu.cn
展开
摘要
随着中国对外开放的深入以及“一带一路”倡议的推进,南海战略地位更加显著。如何科学监管南海船舶,维护国家权益,促进地区之间贸易也成为摆在政府部门面前的难题。在本文中利用南海区域2015年的卫星AIS数据与船舶数据档案资料,通过计算南海水域船舶交通密度分析主要航路,与关键门线船舶流量计算相结合,明确船舶典型空间分布;同时基于4种类型船舶的主要航路的选择,明确南海货物贸易主要流向。研究成果表明:① 船舶空间分布在《世界大洋航路》的推荐航线上,南海的建设开发并未影响船舶的贸易运输;② 贸易运输以跨越南海的长距离运输为主,珠三角作为主要航路的重要端点表明中国在南海贸易的优势地位。
关键词:
Abstract
With the deepening of China's opening to the outside world and the advancement of the Belt and Road Initiative, South China Sea, as an important gateway to China's opening-up and a vital joint for important sea-routes gathering in the world, is embodying prominently strategic position. How to ensure the safety of routes and regulate the vessels sailing in the open water of the south China Sea, safeguard national rights and enhance regional trade is a difficult problem for governmental administrators. In this paper, we excavated the typical spatial distribution of vessels by calculating and visualizing the traffic density of navigation in the South China Sea to analyze the main routes selected by full use of the satellite AIS data of South China sea in 2015 and vessel information database, so the habitual routes could be detected in this region. On the other hand, the statistics on the number of vessels in South China Sea were computed by the statistic line set to find the peak points of the vessel crossing data on the main routes being selected by the most of vessels. Via the above steps, the typical spatial distribution of vessels was defined clearly. Meanwhile, the main flow of trades in South China Sea was determined based on 4 dominant sorts (Bulk, Container, Oil&Chemical and Ro-Ro) of vessels' main routes selected. Research indicated that: (1) The main routes followed the authoritative sailing book《Admiralty Ocean Passage for the World》, which provides sailors with the routes consisting of the waypoints recommended. As a result, the construction and development have little influence on the navigation in this region. Maritime safety administrator can set traffic separation scheme efficiently based on this research; (2) Long-distance shipping is the major mode of transportation. Pearl River Delta being one of the main ends of trade flow indicates the China's dominant position in the South China Sea Trade. This research also attracts more attention to the Beibu Gulf and Hainan Island’s trade potentiality.
Keywords:
作为国家“一带一路”的重要组成板块,同是也是世界航运、贸易、能源、渔业主要通道[1],南海的自然、生态、海洋与经济对全球经济发展、国际政治及社会经济交流影响重大。作为研究的热点地区,一直以来诸多学者针对南海区域从各学科角度展开广泛而深入的研究,包括南沙岛礁及周边港口的可达性评价[2]、海岸带建设用地格局分析[3]、海洋渔业及生态保护[4,5,6]、地球物理[7]等。出于海运资源保护的迫切需求,及船舶触礁、搁浅与非法捕鱼对南海珍贵资源产生的灾难性影响,航路的安全也一直受到相关海事方向学者的关注,但文献主要集中在沿岸港口水道,包括中国珠江三角洲地区[8,9]、新加坡及马六甲海峡[10,11]等,鲜有对南海的开阔水域上船舶空间分布进行整体研究的。由于船舶触礁、搁浅与非法捕鱼会对南海珍贵资源产生灾难性影响,海事部门早有在广东、广西、海南沿海及南海建立船舶定线制的总体规划设想[12],避免类似“桑吉”轮撞船事故在南海的发生,但由于南海航行船舶空间分布相关研究资料的缺乏,给海事部门的定线制规划带来困难。
图1 《世界大洋航路》南海区域主要商船推荐航路
Fig. 1 Main recommended routes for merchant vessels in South China Sea
理论上船员在开阔的大洋水域会参照权威书籍《世界大洋航路》的推荐航路进行航行[13](图1),但就目前的文献提供的资料数据分析来看,随着近些年沿岸国家在南海基础设施的建设,是否会影响船员的实际航行,进而影响航路的走向是无法得到明确答案的;相比之前的相关研究成果选取典型月份分析的做法[14],本文认为选取更长的时间跨度对南海船舶的典型分布进行分析会使论证更加充分;同时,作为世界贸易的主要通道之一,船舶航路的选择中所蕴含的南海的贸易流向同样需要深入研究思考。
通过挖掘海上船舶空间位置数据,构建海上航行特征图是目前跟踪全球船舶行为特征[15,16]、规范船舶秩序的基本手段之一[17]。由于船舶自动识别系统(Automatic Identification System,AIS)能实时获取船舶的位置点、速度、航向等信息,可以很好地反映船舶的货运状态,因此在本文中选取2015年南海区域卫星AIS数据与船舶档案数据(www.hilfeet.com),利用船舶轨迹地理网格分布构建典型吨位区间的船舶交通密度图,并通过关键门线设置对航路上的通过船舶进行统计,明确南海船舶典型空间分布;同时根据不同种类船舶典型空间分布,分析研究南海上货物主要贸易流向。本论文的研究成果可为海事部门集约资源重点执法,保障“海上丝绸之路”运输安全,科学规划管理航路提供理论支持,亦可作为“一带一路”倡议下政府部门优化码头资源,增加贸易航线的参考依据。
南海水域4个航区分别是东沙及周边海域 (19°~24° N之间,113°30′ E以东水域,主体水域20°20′~21°20′ N,包括东沙群岛、中国广东及台湾以南水域);西沙及周边海域(13°~22°N之间, 113°30′E以西水域,主体水域15°42′~17°08′N, 111°10′ ~112°54′ E内);中沙及周边海域(13°~19°N之间,113°30′ E以东水域,主体水域15°24′~16°15′N,113°40′~114°57′E内,包括中沙群岛、黄岩岛及菲律宾以西水域);南沙及周边海域(2°~13°N之间,不包括泰国湾水域,主体水域3°37′~11°55′N, 109°33′~117°50′E内)[14,18]。
通过AIS数据能够实时获得船舶与航次相关的静态信息、动态信息,有助于对航次起到整体监控的作用。但由于甚高频信号传输距离的限制,捕捉类似于南海这样的远洋区域的船舶AIS数据来源只能选用卫星AIS接收装置[19]。本实验AIS数据由中国科学院计算所提供,数据抽取区域选取5°~22° N,106° ~122° E区域,数据时间范围为2015年,数据集共800 991 250条信息,包括船舶的MMSI、经纬度坐标、航速、航向等。根据AIS数据中船用移动识别码(MMSI)、发送的时刻、船舶的位置,结合船舶档案数据库中船舶种类,船旗国等信息,构建船舶
式中:
在本文中从二维的角度对船舶的典型空间分布进行分析:采用细粒度网格交通密度算法完成每个单位时间内经过单位区域内次数的平均值进行计算,构成交通密度图,明确了南海航行船舶的主要航路选择;同时,在航行经过的关键区域设置截面作为门线,计算船舶航迹与门线相交次数,对经过门线的南北向船舶流量进行统计,明确了船舶在主航路上的分布状况。
(1)细粒度网格交通密度算法
如某个月m内栅格i的交通密度如式(2)所示。
式中:
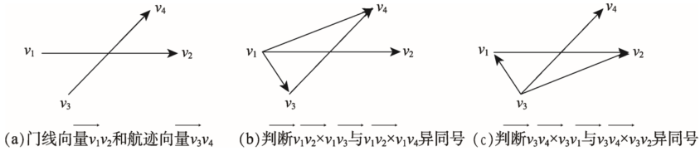
如图2所示,船舶由P1经过P2到达P3,红色的网格为船舶经过的区域。求船舶交通密度即计算单位时间网格单元内船舶通过量的期望值,当船舶轨迹与网格
(2)轨迹与门线判定相交算法
通过设置航道断面,对来往船舶进行统计发掘交通流规律常被学者所采用[22]。在本文中门线判定算法基于船舶在时间上相邻的2个位置点的坐标确定的线段(称为航迹向量)与门线的2个端点的坐标确定的线段(称为门线向量)的相对位置,来判定船舶是否经过门线:判断门线向量
① 向量
② 向量
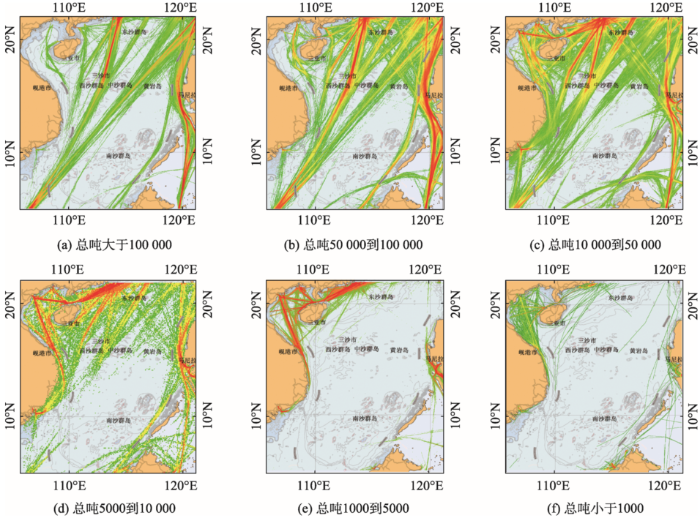
如图4所示,交通密度图中渐变性的颜色反映典型吨位区间船舶空间分布,南海作为全球贸易大通道,总吨大于10 000船舶为贸易运输的主力,该区间船舶包括巴拿马型及以上的干散货船和油船,3000标准箱(TEU)及以上的集装箱船,船长150 m以上的滚装船与液化天然气与液化石油气(LNG&LPG)船舶。通过计算该吨位区间的交通密度,如图4(a)-(c)所示南海贸易主要航路如下:
(1)从台湾海峡或台湾以东经中沙群岛与黄岩岛直接南下到达新加坡的双向航路;
(2)从珠江三角洲经永兴岛、浪花礁到达新加坡的双向航路,也包括在冬季为躲避冷高压而选择永兴岛以西沿越南沿岸到达新加坡的双向航路;
(3)从台湾海峡航行经过东沙群岛以西,在浪花礁与中沙群岛之间,与珠江三角洲前往新加坡的航路交汇,前往新加坡方向的双向航路;
(4)经过台湾海峡或台湾以东经吕宋岛、苏禄海水道到达印尼、澳大利亚的双向航路;
(5)从菲律宾群岛途径巴拉巴克海峡以北前往新加坡方向的双向航路。
从船舶的空间分布来看,主要贸易航路走向与《世界大洋航路》推荐基本相符,证实南海周边的开发并未影响到船舶的运输主航路。巴拉巴克海峡北面、巴拉望水道以西的大片空白区域属于南海中航行复杂,浅滩纵横的区域,船舶空间分布数量稀疏,海图上标记为“Dangerous Ground”即存在大量浅滩与珊瑚礁,船舶交通流异常稀疏符合事实。
非大宗货运运输船舶如吨位5000~10 000的船舶主要包括邮轮、船长100~140 m散货船、集装箱船,油化船、滚装船和LNG&LPG,此类船已具有抗大风浪远海作业的能力,但对于长途大宗运输来说经济性不足,通常不会被选择使用,所以在图4(d)中典型空间分布呈现“外贸兼顾,内贸为主”的特点,南海主航路上的交通密度远小于沿岸区域之间的交通密度;吨位小于5000的船舶,如图4(e)-(f)所示,多以承担港口周边或者短途货物转运的作业为主,此类船舶多分布于沿岸及港口湾区。
图4 典型吨位区间船舶的交通密度图
Fig. 4 Traffic density maps of ships' gt in different intervals
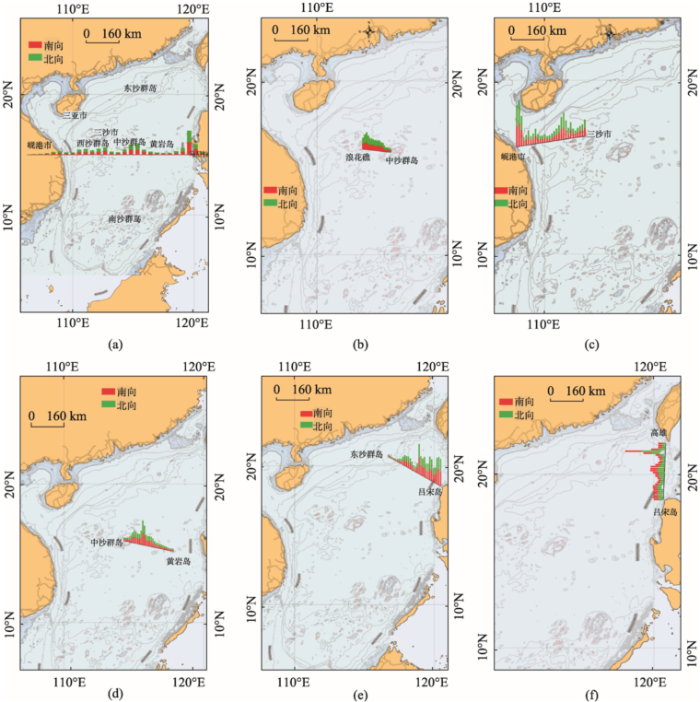
测算船舶在门线的流量,可从横向度量船舶在航路上的空间分布状况。设置的关键门线如下: ① 设置北纬15°纬线作为门线统计整个南海南北向船舶流量分布;② 设置浪花礁至中沙群岛门线统计珠江三角洲及台湾海峡至新加坡间航路船舶流量分布;③ 设置岘港至永兴岛门线统计北部湾、珠江三角洲港口与南海间航路船舶流量分布;④ 设置中沙至黄岩岛门线统计从东北亚进新加坡运输主航路的流量分布;⑤ 设置东沙群岛与吕宋岛北门线,统计从台湾海峡、台湾以东南下的双向航路船舶流量分布;⑥ 设置台湾至吕宋岛北之间门线,统计经过巴士海峡、菲北海峡的船舶流量分布。如图5所示。
(1)如图5(a)所示北纬15°门线上的南北流量分布在2个高峰位置,分别为118.5°~120° E区域与112°~113° E区域,前者贴近吕宋岛为南下澳洲、印尼的主要航路所在;后者为浪花礁以南珠江三角洲和台湾海峡前往新加坡航路汇聚结点;
(2)浪花礁与中沙群岛之间流量高峰位置位于(16.1° N,112.7° E)~(16° N, 113.5° E)范围(图5(b)),并且靠近浪花礁一侧的船舶流量明显较大;
(3)岘港至永兴岛之间存在2个流量高峰位置(图5(c)):(16.2° N, 108.5° E)~(16.2° N, 108.7°E),靠近岘港港区及越南沿岸;(16.5° N, 111° E)~ (16.6° N,111.2° E)区域,为珠江三角洲船舶南下马六甲的冬季航线的穿越范围;
(4)中沙群岛至黄岩岛门线数量高点位于(15.6° N,115.5° E)~(15.5° N,115.9° E)范围内,如图5(d)所示;
(5)东沙群岛与吕宋岛北门线数量高点在(19.5° N,118.8° E)~(18.6° N,120.4° E)的区域,如图5(e)所示;
(6)台湾至吕宋岛北之间门线,覆盖巴士海峡、菲北海峡,如图5(f)所示,门线船舶数量分布均匀,流量高峰靠近台湾以南到巴士海峡,在(21.2° N,120.6° E)~(21.4° N, 120.6° E)区域。
图5 南海船舶通过数量门线统计图
注:绿色柱表示北向穿越数量;红色柱则表示南向穿越数量
Fig. 5 Charts of vessels crossing statistics lines in South China Sea
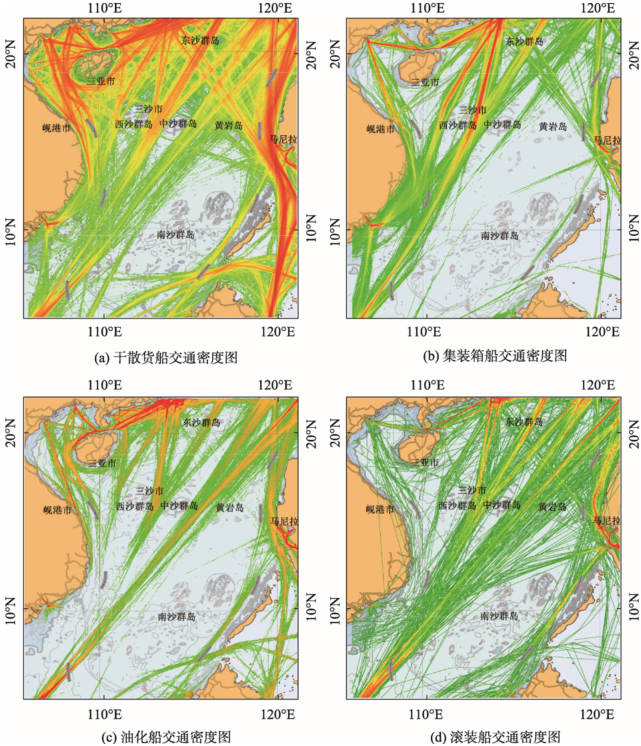
典型船型船舶的航路选择反映了该地区贸易的主要流向,图6中4种类型船舶的空间分布所代表的的贸易流向具有一定相似性,即贸易以跨越整个南海的远洋运输为主,并且中国的珠江三角洲也是这4种货物流向的重要端点。但由于货物类型的不同,流向也存在一定的差异性,其中:
(1)干散货船的空间分布与其他3种类型船舶不同,沿吕宋岛南下苏禄海更加明显,此航路通常被东北亚南下澳洲、印尼的船舶所选择,占南海干散货贸易的主导;
(2)集装箱船的典型分布体现明显的“Hub to Hub”的贸易方式,即马六甲海峡与珠江三角洲地区作为世界重要集装箱枢纽港聚集区域之一,整个南海的集装箱船基本围绕这2个地区之间来回运输;而马尼拉,岘港、胡志明市作为地区的枢纽中心,与这两个地区的贸易交往也频繁于与其他地区;
(3)油化品和滚装汽车运输相对前二者比较特殊,由于货物的进出口港码头设计要求高,港口无法像干散货与集装箱具有广泛地区分布性,以中国为例目前仅列部分港口负责集中进口;通常这2类货物到达进口码头后,再通过陆路或者管道方式转运,所以贸易流向相对固定。从图6(c)-(d)中可以看出,相对前2类船舶,这2类船舶在沿岸的空间分布较稀疏,主要分布在南海运输的主航路上。
本文基于2015年的AIS数据,分析“21世纪海上丝绸之路”重要组成—南海上船舶的典型空间分布与贸易流向,结论如下:
(1)本研究明确了南海商船的典型空间分布,即船舶航行的主要航路与《世界大洋航路》推荐航路保持一致,南海的开发建设并未对航行造成影响。海事部门可以基于此成果制定南海的分道通航制保障船舶安全。
(2)海上贸易运输以跨越南海的长距离运输为主,中国的珠三角地区也成为贸易流向的最重要端点之一,客观的论证了在“海上丝绸之路”倡议下中国在南海贸易中的优势地位。
(3)由于南海管理水域广阔,在目前海上监管力量相对有限的情况下,结合无人机等新兴技术着重对航路重要交汇区域(如浪花礁等)及流量分布高峰区域实现监控能充分发挥效率;海事部门可根据备选位置与南海主航路之间的可达性对搜救基地选址进行充分考虑,防止船舶发生意外而搜救不及时产生更大的人命与生态风险。
(4)不仅是珠江三角洲地区,广西的北部湾港口与海南的沿岸港口也是“21世纪海上丝绸之路”上重要节点,但是从目前分析的货物流向上看这些地区与珠江三角洲相比优势并不明显,这就需要认真调研的原因,争取多开辟航线将港口资源使用达到最大化。
The authors have declared that no competing interests exist.
| [1] |
South China Sea: Its importance for shipping, trade, energy and fisheries [J].https://doi.org/10.1163/24519391-00201003 URL [本文引用: 1] |
| [2] |
南沙岛礁及周边港口可达性评价模型研究 [J].Research on accessibility model of Nansha Islands and surrounding seaports [J]. |
| [3] |
不同海岸地貌背景下的南海周边岸带35年建设用地扩张分析 [J].https://doi.org/10.11821/dlxb201601008 URL [本文引用: 1] 摘要
通过提取1975年与2010年左右南海海岸带建设用地信息,并对南海海岸带区域进行地貌分区,分析了不同类型海岸带35年建设用地扩张空间格局。结果表明:1华南大陆和马来半岛建设用地扩张普遍快,中南半岛扩张程度中等,苏门答腊岛、加里曼丹岛和菲律宾群岛除马尼拉湾外普遍扩张程度慢。2不同海岸地貌因自然资源条件、开发难易程度、腹地大小不同,其建设用地扩张程度差异显著。三角洲平原岸和河口平原岸因水运条件好,腹地广,建设用地扩张普遍显著,台地岸和沙坝—潟湖平原岸因适宜建中小型港口,扩张较为显著,海湾平原岸与山地岸则因平原面积小,开发潜力有限,建设用地扩张普遍不大,平直沙堤平原岸因腹地小,水运不发达而扩张甚微。3不同类型海岸带开发模式各异。三角洲平原岸和河口平原岸建设用地空间形态多样化,山地岸、台地岸、海湾平原岸以团块状或条带状为主,沙坝—潟湖平原岸以团块状与星状为主,平直沙堤平原岸多呈条带状、线状或点状分布。
Construction land expansion in coastal zone around the South China Sea based on different geomorphologic backgrounds in the past 35 years [J].https://doi.org/10.11821/dlxb201601008 URL [本文引用: 1] 摘要
通过提取1975年与2010年左右南海海岸带建设用地信息,并对南海海岸带区域进行地貌分区,分析了不同类型海岸带35年建设用地扩张空间格局。结果表明:1华南大陆和马来半岛建设用地扩张普遍快,中南半岛扩张程度中等,苏门答腊岛、加里曼丹岛和菲律宾群岛除马尼拉湾外普遍扩张程度慢。2不同海岸地貌因自然资源条件、开发难易程度、腹地大小不同,其建设用地扩张程度差异显著。三角洲平原岸和河口平原岸因水运条件好,腹地广,建设用地扩张普遍显著,台地岸和沙坝—潟湖平原岸因适宜建中小型港口,扩张较为显著,海湾平原岸与山地岸则因平原面积小,开发潜力有限,建设用地扩张普遍不大,平直沙堤平原岸因腹地小,水运不发达而扩张甚微。3不同类型海岸带开发模式各异。三角洲平原岸和河口平原岸建设用地空间形态多样化,山地岸、台地岸、海湾平原岸以团块状或条带状为主,沙坝—潟湖平原岸以团块状与星状为主,平直沙堤平原岸多呈条带状、线状或点状分布。
|
| [4] |
中国南海区海洋捕捞渔船现状分析 [J].https://doi.org/10.12024/jsou.20160201650 URL [本文引用: 1] 摘要
根据《中国渔业统计年鉴》数据,结合有关南海区渔业资源和渔业生产状况资料,对1979-2013年南海区(广东、广西、海南)海洋捕捞机动渔船的数量、吨位、主机功率的总规模以及主机功率结构、作业类型结构的变迁和现状进行评价分析。2013年南海区海洋捕捞渔船总计81 647艘,156.6万吨,其中机动渔船78 671艘,382.3万千瓦;机动小型渔船数量最多,超过75%,早期增速快,近十年较为稳定;大型渔船数量极低,增速缓慢,目前仍不足0.6%;中型渔船较为稳定;刺网作业渔船数量最多,拖网渔船次之,各类型渔船均已从增长期进入调控管理期。南海区捕捞渔船目前存在总体规模过大、数量结构上小型渔船偏多、捕捞作业结构不合理的问题。建议进一步压减捕捞渔船总体规模,在结构上重点压减小型渔船,适当保留大型渔船规模,同时应进一步调整捕捞作业结构,压减小型渔船拖网、刺网作业,积极发展钓捕,适当发展围网和深水拖网。
Analysis of current status of Chinese marine fishing fleet of South China Sea area [J].https://doi.org/10.12024/jsou.20160201650 URL [本文引用: 1] 摘要
根据《中国渔业统计年鉴》数据,结合有关南海区渔业资源和渔业生产状况资料,对1979-2013年南海区(广东、广西、海南)海洋捕捞机动渔船的数量、吨位、主机功率的总规模以及主机功率结构、作业类型结构的变迁和现状进行评价分析。2013年南海区海洋捕捞渔船总计81 647艘,156.6万吨,其中机动渔船78 671艘,382.3万千瓦;机动小型渔船数量最多,超过75%,早期增速快,近十年较为稳定;大型渔船数量极低,增速缓慢,目前仍不足0.6%;中型渔船较为稳定;刺网作业渔船数量最多,拖网渔船次之,各类型渔船均已从增长期进入调控管理期。南海区捕捞渔船目前存在总体规模过大、数量结构上小型渔船偏多、捕捞作业结构不合理的问题。建议进一步压减捕捞渔船总体规模,在结构上重点压减小型渔船,适当保留大型渔船规模,同时应进一步调整捕捞作业结构,压减小型渔船拖网、刺网作业,积极发展钓捕,适当发展围网和深水拖网。
|
| [5] |
利用珊瑚的影像密度恢复南海海表温度 [J].https://doi.org/10.3321/j.issn:0375-5444.2000.05.006 URL [本文引用: 1] 摘要
将南海西沙永兴岛(16°50′N,112°20′E)西北的造礁现瑚的岩芯,制成X射线负片。用显微光密度计在X射线负片上获得沿生长轴方向的影密谋值,时间序列为1937 ̄1993年。根据影像密度数据,计算出珊 的各年生长率的代用指标。珊瑚生长率和钙化率的代用指标都与SST呈显著正相关。根据1960 ̄1993年的资料统计,相关分别是0.91和0.85,从而建立了珊瑚生长率温度计和钙化率代用指标温度计。并
Reconstructing of sea surface temperature in South China Sea by using image density of coral X-ray photograph [J].https://doi.org/10.3321/j.issn:0375-5444.2000.05.006 URL [本文引用: 1] 摘要
将南海西沙永兴岛(16°50′N,112°20′E)西北的造礁现瑚的岩芯,制成X射线负片。用显微光密度计在X射线负片上获得沿生长轴方向的影密谋值,时间序列为1937 ̄1993年。根据影像密度数据,计算出珊 的各年生长率的代用指标。珊瑚生长率和钙化率的代用指标都与SST呈显著正相关。根据1960 ̄1993年的资料统计,相关分别是0.91和0.85,从而建立了珊瑚生长率温度计和钙化率代用指标温度计。并
|
| [6] |
Impact of equatorial and continental airflow on primary greenhouse gases in the northern South China Sea [J].https://doi.org/10.1088/1748-9326/10/6/065005 URL [本文引用: 1] 摘要
Four-year ground-level measurements of the two primary greenhouse gases (carbon dioxide (CO) and methane (CH)) were conducted at Dongsha Island (DSI), situated in the northern South China Sea (SCS), from March 2010 to February 2014. Their mean mixing ratios are calculated to be 396.302±025.4 ppm and 1863.602±0250.5 ppb, with an annual growth rate of +2.1902±020.5 ppm yrand +4.7002±024.4 ppb yrfor COand CH, respectively, over the study period. Our results suggest that the Asian continental outflow driven by the winter northeast monsoon could have brought air pollutants into the northern SCS, as denoted by significantly elevated levels of 6.5 ppm for COand 59.6 ppb for CH, which are greater than the marine boundary layer references at Cape Kumukahi (KUM) in the tropical northern Pacific in January. By contrast, the summertime CHat DSI is shown to be lower than that at KUM by 19.7 ppb, whereas COis shown to have no differences (<0.42 ppm in July) during the same period. Positive biases of the Greenhouse Gases Observing Satellite (GOSAT) L4B data against the surface measurements are estimated to be 2.402±023.4 ppm for COand 43.202±0236.8 ppb for CH. The satellite products retrieved from the GOSAT showed the effects of anthropogenic emissions and vegetative sinks on land on a vertical profiling basis. The prevailing southeasterly winds originating from as far south as the equator or Southern Hemisphere pass through the lower troposphere in the northern SCS, forming a tunnel of relatively clean air masses as indicated by the low CHmixing ratios observed on the DSI in summer. (letter)
|
| [7] |
Geodynamics of the South China Sea [J].https://doi.org/10.1016/j.tecto.2016.02.022 URL [本文引用: 1] 摘要
The beginning of seafloor spreading in the South China Sea (SCS) is now established from IODP drilling Leg 349 at 33 Ma. Chron 12 (32 Ma) is the oldest chron identified in the SCS. The nature of the crust of the northeastern part of the SCS located north of chron C12, where chrons 15 to 17 were previously identified, is not oceanic but thinned continental crust intruded by volcanic elongated features emplaced 17-22 Ma ago. Based on magnetic anomalies identifications, the end of the SCS spreading could be either 15.5, 20.5 Ma (Briais et al., 1993; Barckhausen et al., 2014) or something else. However, as post-spreading magmatic activity (~ 13-3.5 Ma) largely masks the spreading fabric in particular near the axis of the east sub-basin, published locations of the axial magnetic anomaly (extinct spreading axis) and spreading rates are not reliable. A contoured map of the extremely dense set of magnetic data shows that a few magnetic lineations belonging to the magnetic seafloor spreading fabric are still preserved and parallel to the N055掳 bathymetric seafloor spreading trends identified on swath-bathymetric maps in the central part of the SCS, suggesting the extinct ridge axis is N055掳 trending with potential N145掳 transform faults. Based on published swath-bathymetric data, oceanic domains with different seafloor spreading lineaments have been delimited (N055掳, N075掳 and N085掳) and provide important constraints used to propose a kinematic sketch of the SCS opening. As a consequence, the Zhongnan faults zone, located between the east and southeast sub-basins, acted as a major fracture zone system during the SCS opening, with horizontal offsets varying from ~ 50 km to ~ 140 km. The flow-line pattern defined from the seafloor spreading lineaments and the few identified FZs have been used to highlight conjugate segments of continental margins...
|
| [8] |
广州港水域船舶航行风险评估 [J].https://doi.org/10.3969/j.issn.1000-4653.2013.04.022 URL [本文引用: 1] 摘要
广州港水域是我国比较繁忙的沿海船舶交通水域之一.为了更好地了解船舶航行的风险特征和风险发展趋势,采用改进型风险评估法(PRA)对港口水域环境进行风险评估,提出基于贝叶斯理论的风险预测和通航流量计算方法,分析船舶航行的风险特征和风险发展趋势.经对广州港水域状况的综合安全评估和通航水域的饱和度分析,可得出不同水域在不同船舶动态和风险种类下的风险程度,并可预测广州港水域船舶航行风险发展趋势.其结论可为安全管理部门制定风险控制方案提供决策支持.
Risk assessment of ship navigation in Guangzhou Harbor [J].https://doi.org/10.3969/j.issn.1000-4653.2013.04.022 URL [本文引用: 1] 摘要
广州港水域是我国比较繁忙的沿海船舶交通水域之一.为了更好地了解船舶航行的风险特征和风险发展趋势,采用改进型风险评估法(PRA)对港口水域环境进行风险评估,提出基于贝叶斯理论的风险预测和通航流量计算方法,分析船舶航行的风险特征和风险发展趋势.经对广州港水域状况的综合安全评估和通航水域的饱和度分析,可得出不同水域在不同船舶动态和风险种类下的风险程度,并可预测广州港水域船舶航行风险发展趋势.其结论可为安全管理部门制定风险控制方案提供决策支持.
|
| [9] |
水上交通宏观态势评估模型 [J].https://doi.org/10.16411/j.cnki.issn1006-7736.2016.01.006 URL [本文引用: 1] 摘要
为实现对目标水域水上交通系统宏观状态和演变趋势的定量描述和分析,深入理解和掌握水上交通系统内在因子的相互作用,根据水上交通系统宏观态势的本征特性,构建水上交通宏观态势评估模型.首先,根据宏观态势特点,分析宏观态势评估指标,构建融合动态密度因子和迫近因子的宏观态势评估模型和区域分布模型.然后,将水域网格化,分析各网格的态势变化,将态势在时间维度拓展,建立水上交通宏观态势预测模型.以深圳港区西部港区为例,以区域AIS信息作为态势感知数据进行水上交通系统宏观态势评估和可视化分析,并将水上交通态势与所选指标因子进行相关性检验分析.结果表明,水上交通宏观态势与所选的指标因子之间具有较好的相关性.该模型可较好地反映该水域宏观交通状态和趋势,可为水上交通系统状态分析和系统安全性研究提供一种度量工具.
Marine traffic macroscopic situation assessment model [J].https://doi.org/10.16411/j.cnki.issn1006-7736.2016.01.006 URL [本文引用: 1] 摘要
为实现对目标水域水上交通系统宏观状态和演变趋势的定量描述和分析,深入理解和掌握水上交通系统内在因子的相互作用,根据水上交通系统宏观态势的本征特性,构建水上交通宏观态势评估模型.首先,根据宏观态势特点,分析宏观态势评估指标,构建融合动态密度因子和迫近因子的宏观态势评估模型和区域分布模型.然后,将水域网格化,分析各网格的态势变化,将态势在时间维度拓展,建立水上交通宏观态势预测模型.以深圳港区西部港区为例,以区域AIS信息作为态势感知数据进行水上交通系统宏观态势评估和可视化分析,并将水上交通态势与所选指标因子进行相关性检验分析.结果表明,水上交通宏观态势与所选的指标因子之间具有较好的相关性.该模型可较好地反映该水域宏观交通状态和趋势,可为水上交通系统状态分析和系统安全性研究提供一种度量工具.
|
| [10] |
Ship collision risk assessment for the Singapore Strait [J].https://doi.org/10.1016/j.aap.2011.05.022 URL PMID: 21819832 [本文引用: 1] 摘要
The Singapore Strait is considered as the bottleneck and chokepoint of the shipping routes connecting the Indian and the Pacific Ocean. Therefore, the ship collision risk assessment is of significant importance for ships passing through the narrow, shallow, and busy waterway. In this paper, three ship collision risk indices are initially proposed to quantitatively assess the ship collision risks in the Strait: index of speed dispersion, degree of acceleration and deceleration, and number of fuzzy ship domain overlaps. These three risk indices for the Singapore Strait are estimated by using the real-time ship locations and sailing speeds provide by Lloyd's MIU automatic identification system (AIS). Based on estimation of these three risk indices, it can be concluded that Legs 4W, 5W, 11E, and 12E are the most risky legs in the Strait. Therefore, the ship collision risk reduction solutions should be prioritized being implemented in these four legs. This study also finds that around 25% of the vessels sail with a speed in excess of the speed limit, which results in higher potentials of ship collision. Analysis indicates that the safety level would be significantly improved if all the vessels follow the passage guidelines.
|
| [11] |
Vessel collision frequency estimation in the Singapore Strait [J].https://doi.org/10.1017/S0373463311000683 URL [本文引用: 1] 摘要
This paper aims to estimate Vessel Collision Frequency in the Singapore Strait. This frequency is obtained as the product of the number of Vessel Conflicts and the causation probability using the real-time vessel movement data from the Lloyd's Marine Intelligence Unit (Lloyd's MIU) database. The results show that the container carriers have the highest Vessel Collision Frequency while Roll-On Roll-Off (RORO) and passenger ships have the lowest frequency. Tankers cause the highest head-on collision frequency. In the Singapore Strait, the most risky overtaking area is between longitudes 103°48′E and 104°12′E. The most risky head-on area is between longitudes 103°50′E and 104°00′E while the majority of crossing collisions occur between longitudes 103°50′E and 104°12′E. The Vessel Collision Frequency is found to be 1·75 per year in the traffic lanes. Currently, westbound traffic in the Strait is more risky than eastbound traffic (the number of westbound collisions in July was 0·0991 while the number of eastbound collisions was 0·0470). Furthermore, the estimated Vessel Collision Frequency during the day is less than that at night. The results of this paper could be beneficial for the Maritime and Port Authority of Singapore to further enhance the navigational safety strategies implemented in the Singapore Strait.
|
| [12] |
TSS scheduled in South China Sea [J]. |
| [13] |
Ocean passages for the World (NP136) [M]. |
| [14] |
中国航海学会,上海海事大学.南海航行研究报告 . [ EB/OL]. .China Institute of Navigation, Shanghai Maritime University. Research Report on Navigation status in the South China Sea [EB/OL]. . |
| [15] |
Completeness and accuracy of a wide-area maritime situational picture based on automatic ship reporting systems [J].https://doi.org/10.1017/S0373463315000582 URL [本文引用: 1] 摘要
Automatic ship reporting systems (AIS 090009 Automatic identification System, LRIT 090009 Long Range Identification and Tracking, VMS 090009 Vessel Monitoring System) today allow global tracking of ships. One way to display the results is in a map of current ship positions over an area of interest, the Maritime Situational Picture (MSP). The MSP is dynamic and must be created by fusing the reporting systems' messages, constructing ship tracks and predicting ship positions to correct for latency especially in the case of AIS received by satellite which forms the bulk of the data. This paper discusses the completeness of the resulting MSP and the accuracy of its positions, quantifying the additional value of the individual data sources.
|
| [16] |
The declining impact of piracy on maritime transport in the Indian Ocean: Statistical analysis of 5-year vessel tracking data [J].https://doi.org/10.1016/j.marpol.2015.04.018 URL [本文引用: 1] 摘要
The analysis of the declining impact of piracy on maritime routes and vessel behaviours in the Indian Ocean is here performed using Long Range Identification and Tracking (LRIT) reports. A 5-year archive of vessel position data covering the period characterized by the highest number of attacks and the subsequent decline provides a unique source for data-driven statistical analysis that highlights changes in routing and sailing speeds. The work, besides demonstrating the value of LRIT data for statistical maritime traffic analysis, can be used to ultimately provide quantitative support to the estimates of the additional fuel consumption due to piracy. In showing the return of the North-揝outh traffic to the shortest path, the results testify to the effectiveness of the efforts put in place against piracy in the Western Indian Ocean.
|
| [17] |
A quantitative approach for delineating principal fairways of ship passages through a strait [J].https://doi.org/10.1016/j.oceaneng.2015.04.077 URL [本文引用: 1] 摘要
61A cross-disciplinary application of ecological methods for maritime engineering.61A rigorous mathematical framework for delineating principal fairways boundaries.61Geo-visualise the effect of seasonal and directional factors for maritime corridors.61Identify the gaps between existing TSSs and cumulative activity patterns for vessel groups.
|
| [18] |
|
| [19] |
|
| [20] |
Mapping global shipping density from AIS Data [J].https://doi.org/10.1017/S0373463316000345 URL [本文引用: 2] 摘要
Mapping global shipping density, including vessel density and traffic density, is important to reveal the distribution of ships and traffic. The Automatic Identification System (AIS) is an automatic reporting system widely installed on ships initially for collision avoidance by reporting their kinematic and identity information continuously. An algorithm was created to account for errors in the data when ship tracks seem to u2018jumpu2019 large distances, an artefact resulting from the use of duplicate identities. The shipping density maps, including the vessel and traffic density maps, as well as AIS receiving frequency maps, were derived based on around 20 billion distinct records during the period from August 2012 to April 2015. Map outputs were created in three different spatial resolutions: 1u00b0 latitude by 1u00b0 longitude, 10 minutes latitude by 10 minutes longitude, and 1 minute latitude by 1 minute longitude. The results show that it takes only 56 hours to process these records to derive the density maps, 1u00b77 hours per month on average, including data retrieval, computation and updating of the database.
|
| [21] |
一种基于海量船舶轨迹数据的细粒度网格海上交通密度计算方法 [J].
在“一路一带”的战略构想下,对于海上贸易的关注逐渐升温。海上运输是海上贸易的承载,掌握细粒度的海上交通密度,对于提取热点航道热点区域、分析全球贸易走势、推断海上交通连通性及相关的异常检测等具备重要的意义。提出了一种面向海量船舶轨迹数据的细粒度网格海上交通密度计算方法,该方法将全球划分为001°*001°的标准化细粒度网格,一方面为了适应细粒度网格对全球船舶真实轨迹数据特点设计了针对性的预处理方案,处理了异常点和停泊点;另外一方面设计并实现了一种面向该网格的利用海量轨迹数据对信息发送数目、信息发送间隔、经过船舶数目、经过船舶时间等多维交通密度特征进行量化计算的方法,具备良好的拓展性。最后采用2014年2个月共计8亿余条数据对该方法的性能、准确性进行了评估验证,证明了该方法的切实可行性。
A fine grained grid-based maritime traffic density algorithm for mass ship trajectory data [J].
在“一路一带”的战略构想下,对于海上贸易的关注逐渐升温。海上运输是海上贸易的承载,掌握细粒度的海上交通密度,对于提取热点航道热点区域、分析全球贸易走势、推断海上交通连通性及相关的异常检测等具备重要的意义。提出了一种面向海量船舶轨迹数据的细粒度网格海上交通密度计算方法,该方法将全球划分为001°*001°的标准化细粒度网格,一方面为了适应细粒度网格对全球船舶真实轨迹数据特点设计了针对性的预处理方案,处理了异常点和停泊点;另外一方面设计并实现了一种面向该网格的利用海量轨迹数据对信息发送数目、信息发送间隔、经过船舶数目、经过船舶时间等多维交通密度特征进行量化计算的方法,具备良好的拓展性。最后采用2014年2个月共计8亿余条数据对该方法的性能、准确性进行了评估验证,证明了该方法的切实可行性。
|
| [22] |
基于AIS的船舶交通流量统计方法研究 [J].Statistical method research of vessel traffic flow based on AIS [J]. |

/
| 〈 |
|
〉 |

