姚尧 , 任书良
, 任书良
YAO Yao, REN Shuliang
通讯作者:
收稿日期: 2018-10-9
修回日期: 2018-11-27
网络出版日期: 2019-02-20
版权声明: 2019 《地球信息科学学报》编辑部 《地球信息科学学报》编辑部 所有
基金资助:
作者简介:
作者简介:姚 尧(1987-),男,广东梅州人,副教授,研究方向为空间大数据和智慧城市。E-mail: yaoy@cug.edu.cn
展开
摘要
随着中国城市化进程的加快,城市人口的大规模集聚带来了住房紧张的问题,房价政策制定的时效性与正确性也时刻吸引着社会的关注,因此在微观尺度下对房价进行精细化制图变得愈发重要。由于数据可获取性和现有模型精度的限制,目前已有研究均较少涉及微观尺度。本研究通过将房价数据和遥感影像相融合,构建了一种基于卷积神经网络(CNN)和随机森林(RF)的遥感影像挖掘模型,以实现在不考虑其他数据的情况下,精确、合理地进行房价的微观尺度制图。本文以武汉市作为研究区,在仅有房价数据和遥感影像的情况下,利用本文所构建的模型成功得到武汉市中心城区5 m精度的精细房价图。此外,还利用其他数据源以及挖掘技术与本文所构模型进行了对比分析。结果显示,本文所构建的模型获得了最高的房价模拟拟合优度(R2=0.805),相比传统方法中的最高拟合优度(R2=0.653)其精度提升了23.28%,其制图结果可为政府部门规划决策及武汉市经济分布研究提供基础支撑。
关键词:
Abstract
China's rapid urbanization has caused a large number of migrants to move to the city, which has also led to housing shortages. Rapid access to fine-scale house price distribution data plays a very important role in urban housing management, government decision-making, and urban economic model analysis. The availability of data and limitations of existing models make only a few studies involving the mapping of house price distribution at the microscale. By combining house price data with remote sensing images, this study builds a remote sensing image features mining model based on Convolutional Neural Network (CNN) and Random Forest (RF). The proposed CNN-based model in this paper can be applied for accurate and reasonable microscopic mapping of house prices without introducing auxiliary geospatial variables. Only using the house prices data and remote sensing images, we successfully carry out the house prices mapping with the precision of 5 meters in the downtown area of Wuhan city. By comparison with the results generated by the other three traditional mining techniques (including A: using spatial datasets extracted from auxiliary geographic dataset only, B: using original features extracted from high-resolution remote sensing images only, C: using original features extracted from high-resolution remote sensing images and auxiliary geographic dataset), the results show that the proposed CNN-based model has the highest house price simulation accuracy (R2=0.805), at least 23.28% higher than the fitting accuracies of the traditional methods (A: R2=0.592, B: R2=0.0.434, C: R2=0.653). Moreover, based on the fine-scale house price map, this study further analyzes the spatial heterogeneity distribution of housing prices in the downtown area of Wuhan city. By comparing the partial and overall similarity of the simulated house price distribution map calculated via the perceptual hash algorithm, the results also demonstrate that the house prices distribution of Wuhan city has remarkable fractal characteristics. The micro-scale house price data obtained in this study can provide a basis for microeconomics and fractal research in the urban economics. Meanwhile, this study also provides a brand-new research method for micro-scale economic analysis and resource optimization of large cities in China.
Keywords:
近年来,房价已经成为关乎经济和民生的首要因素。已有研究表明,房价的波动不仅影响区域经济的发展,还与人们的消费水平和健康状况息息相关[1,2]。而中国房价矛盾突出问题多集中在北京、上海、深圳等特大城市。近2年来,房地产开发市场十分活跃,各项指标均呈现较快增长[3],对于遏制房价快速上涨的调控政策也相继颁布[4]。在此形势下,城市房价的精细化制图更加发挥着重要的作用,为相关政府部门和房地产市场提供了极具参考价值的房价信息。例如,通过参考微观尺度房价图,充分考虑房价分布的细空间异质性,采取更加细化的区域房价调节手段以确定合理的住宅补贴水平[5]。
以往对于房价的空间研究多集中在宏观尺度上,如Rondinelli和Veronese[6]使用人口普查数据和由房地产开发商提供的住宅租赁价格数据来估算租赁价格的变化。同时,也有研究认为房价的空间自相关性和异质性需要进一步考量,因此Osland[7]对地理加权回归等模型进行改进并引进了空间计量经 济学模型。已有研究表明,遥感影像特征所挖掘的语义信息可作为制图的有效数据,如Duque等[8]提出基于高分辨率(VHSR)图像的纹理和结构特征模型,来获得更为合理的城市内部贫民窟指数地图,结果表明基于高分遥感影像获得的城市居民居住条件同城市居民的生计密切相关,可作为制图有效数据。
在上述研究中,由于数据精度不够精细,且预测模型多采用常规的统计学或简单机器学习模型,难从复杂的地理空间对象中充分挖掘隐藏的语义信息,故导致房价的制图结果分辨率不高,无法体现微观尺度下房价分布的空间异质性和分形性特征,从而较难提供有效的、精细化的指导[9]。
针对以往的研究的不足和对房价复杂空间异质性、分形性的考虑[10],本研究将建立一个基于卷积神经网络(CNN)的遥感影像挖掘模型来充分挖掘其空间特征信息,以得到精准、细粒度的武汉市房价分布图。本文首先应用多尺度随机抽样模型,从高分辨率遥感影像和现有房价信息中构建相关空间数据集;然后,本文利用卷积神经网络(CNN)来进行空间数据的特征挖掘;之后将获取所得的特征放入随机森林(RF)拟合模型之中来进行房价分布的拟合;最后,本文以武汉市作为研究区域,基于所提出的CNN模型,结合武汉市中心城区高分辨率遥感影像和武汉市住宅均价数据,精细化拟合以获取武汉市高分辨率房价分布图。通过与多种基于不同空间数据集及挖掘模型的房价制图方法进行对比,对比结果都证明了本研究所提出方法的优势和准确性。
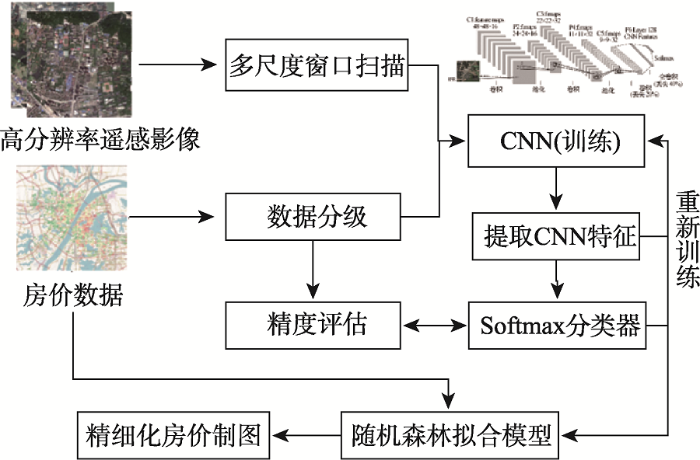
本文所设计的研究流程图如图1所示,通过多尺度窗口滑动特征采样-卷积神经网络挖掘遥感影像特征-随机森林进行房价拟合3个步骤来获得房价分布图:① 通过数据预处理和多尺度滑动窗口采样,构建了城市住房价格影响因子的数据集并训练了一个轻量级卷积神经网络(CNN),根据softmax层计算出的误差进行反向迭代传播,得到最优模型;② 去除预训练CNN模型的softmax层,并将其输出的高维特征向量作为训练特征,建立具有原始房价数据的RF拟合模型;③ 基于拟合模型,计算具有一定窗口大小的每个像元的住房价格,并以精细的规模获得最终的住房价格结果。
图1 通过CNN挖掘遥感影像数据集来模拟住房价格的流程
Fig. 1 Flow for simulating housing prices by mining remote-sensing image datasets via CNN
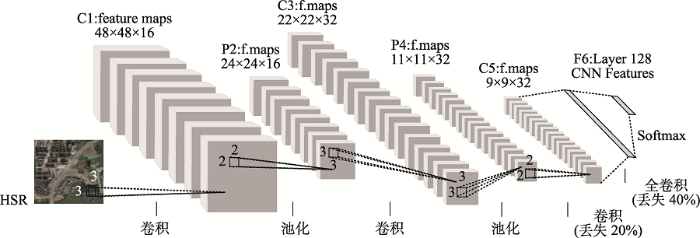
本研究设计的卷积神经网络(CNN)结构如图2所示。已有研究表明,UMCNN具有从挖掘对象中获取良好社会信息的巨大潜力,其框架中的浅层卷积神经网络已经应用在模拟城市扩张、城市精细尺度制图等方面,满足空间数据挖掘方面的需要[11,12]。同时,考虑到计算机CPU的计算能力并且为了避免出现过拟合现象,本文将训练模型设计为深度较浅、具有较少卷积层的网络结构[13,14]。此外,在具体的网络结构参数上,本文通过手动调参来确定较好的卷积神经网络结构,参数的设置和选取引用了He等[11]]以及Yao等[12利用UMCNN所开展的城市计算的工作时,对UMCNN模型所做的参数调整和选取。
图2 用于进行数据挖掘特征提取的CNN计算框架
Fig. 2 The computational framework of proposed CNN used to feature extraction
如图2所示,本文最终确定的CNN结构共计 7层,包括3层卷积层,2层最大池层,1层完全连接层和1层softmax层[15]。其中,在卷积层和完全连接层中使用的激活函数是整流线性单元,这是一种线性激活函数,拥有更好的拟合效果以及更快的训练速度。本文还在第三卷积层和最终完全连接层间设置40%的丢弃率,这会随机禁用某些神经元的权重,从而有效防止模型过度拟合[16]。已有的研究表明,与较大的卷积核相比,较小的卷积核参数更少,训练效果更好,训练速度也更快[17]。因此,在卷积核的设置上,本文选择大小为3×3×3像元的卷积核。之后,将训练好的卷积神经网络去掉softmax层,形成一个具有高维CNN特征的数据集生成器,并利用其构建拟合模型。在拟合模型的选取上,采用随机森林(RF)作为最终的拟合模型。以往研究指出,随机森林在解决多维特征拟合所带来的多重共线性问题时有很好的效果[18],因此被广泛应用于多维特征的分类和回归问题[19]。
此外,为了对抗多尺度效应,解决地面目标的尺度差异问题。本文还应用了多尺度随机土地斑块采样的策略,以房屋样本数据点为中心设置了宽度为w的采样窗口。在每个窗口随机抽样w/s样本,并保证s小于w,逐步增加直到和w相等。通过多尺度随机斑块采样,可以扩大CNN训练数据的数量,有助于避免过拟合问题,进一步提高CNN模型的分类准确性[13]。
本研究将通过多尺度随机斑块采样得到的样本数据集,按照80%和20%进行划分并分别用于CNN模型的训练以及用于验证与误差的传播。为了检验最终的房价分布模拟精度,将预处理后的原始房价数据集随机分为60%的训练集和40%的测试集,用于训练和验证本文所设计的遥感影像特征挖掘模型拟合部分的精度。在随机森林对房价分布进行精细化拟合时,通过装袋方法从原始数据集中随机提取样本生成新的数据集。在随机特征选择的过程中,每个训练子数据集构建单个决策树,在生长过程中决策树不被修剪,可以获得袋外(OOB)的估计错误报告。以往研究已经指出,OOB估计的拟合误差被证明要优于交叉验证方法[20]。同时,为了确保结果的可靠性,本研究将采用Bagging方法在训练数据集中随机划分出部分数据作为OOB数据,通过20次随机训练和预测,得到其预测的平均精度。
本文采用若干精度评价指标,将模拟的房价结果和真实结果进行对比来定量评估本文提出的模型最终房价制图的准确性。这些精度评价指标包括:皮尔森相关系数(Pearson R),拟合优度(Standard R2),均方根误差(RMSE),平均绝对误差(MAE)。
式中:
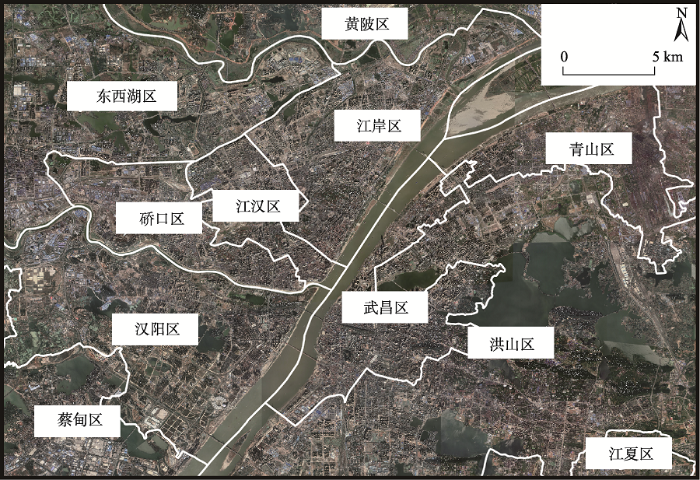
武汉市是中国中部地区的中心城市,2017年生产总值为13 410.34亿元,人均生产总值为123 831元人民币,其发达的经济基础和便利的交通位置使得住宅价格稳定提升。如图3所示,本文的研究区域为武汉市内中心城区,共涉及主城区6个行政区划(江岸区、江汉区、汉阳区、武昌区、洪山区、青山区),远城区4个行政区划(东西湖区、蔡甸区、江夏区、黄陂区),总面积约为9147 km2。主城区和远城区的划分参考自武汉市最新颁布的买房落户政策,不同的政策要求下使得各行政区域的人口流动格局和经济结构发生变化[21],这也使不同行政区之间的空间异质性更加复杂[22,23,24]。
图3 研究区域(武汉市)注:背景数据是Google Earth提供的湖北省武汉市遥感图像,空间分辨率为5 m。
Fig. 3 Study area (Wuhan city)
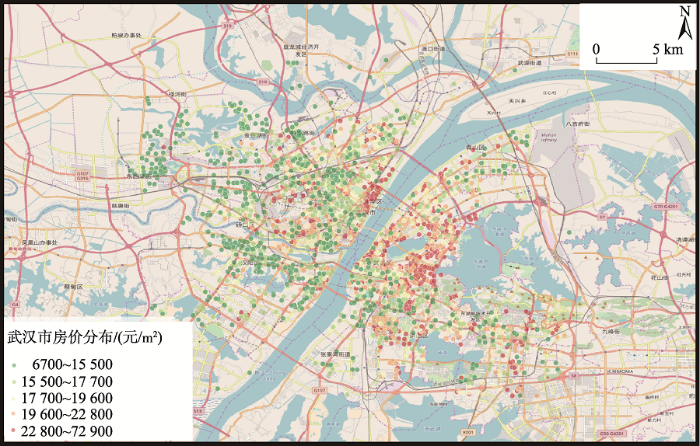
本文从中国最大的在线住宅市场网站Fang.com获取了研究区域内带有编号、经度、维度、价格/平方米等信息的房价数据。预处理,共获得3016组有效数据(图4)。
图4 中国最大的在线住宅市场网站Fang.com收录的房价数据
Fig. 4 The acquired housing price data from Fang.com, China's biggest online housing market website
由于采集的房价数据是连续数值,本文通过对它们进行标准偏差等级划分来进行离散化[25]。设研究区每平方米住房价格的平均值和标准差分别为
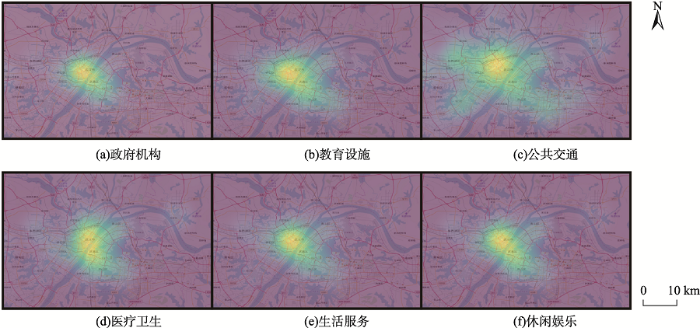
表1 辅助地理空间数据选择表
Tab. 1 Selection table of auxiliary geospatial data
| 参数类别 | 二级分类 |
|---|---|
| 区位特征 | 政府机构 |
| 教育资源 | 幼儿园、小学、初中 |
| 高中、大学 | |
| 交通便捷 | 地铁站 |
| 公交站 | |
| 医疗资源 | 大型医院 |
| 小型门诊 | |
| 便民服务 | 超市 |
| 商场 | |
| 美食 | |
| 公园 | |
| 生活服务 | |
| 银行 | |
| 休闲娱乐 | 休闲广场 |
| 宾馆 | |
| 娱乐场所 | |
| 游乐园 | |
| 道路密度 | 快速路 |
| 主干路 | |
| 次干路 | |
| 支路 |
图5 POI辅助地理空间数据集空间分布密度
Fig. 5 The spatial distribution density of Baidu POIs and the auxiliary geospatial datasets
为对比证明本文设计的房价制图模型在进行精细房价制图时的可靠性和优越性,本研究一共进行了4组不同的对比方法和实验。如表2(见第174页)所示,A组为仅使用辅助地理数据特征,B组为仅使用遥感图像原始特征,C组为使用辅助地理数据和遥感图像原始特征组合,D组为使用组合数据并且通过CNN挖掘遥感影像特征。经过实验,各类别的估测结果和误差分布如表3(见第174页)所示。
表2 基于不同空间数据挖掘模型的空间房价分布精细制图方法
Tab. 2 The methods of mapping fine-scale housing prices via different mining model
| 实验编号 | 实验描述 | 实验标签 |
|---|---|---|
| A | 仅使用辅助空间数据集 | RF(SD) |
| B | 仅使用遥感影像原始特征 | RF(HSR) |
| C | 使用辅助空间数据集和遥感 影像原始特征 | RF(HSR&SD) |
| D | 通过CNN从遥感影像中提特征 | CNN(HSR) |
表3 不同房价分布制图方法得到的结果精度对比结果
Tab. 3 The accuracy assessment results of different mapping fine-scale housing prices methods
| 精度评价指标 | 实验编号 | |||
|---|---|---|---|---|
| A | B | C | D | |
| Pearson R | 0.775 | 0.655 | 0.809 | 0.818 |
| Standard R2 | 0.592 | 0.434 | 0.653 | 0.805 |
| RMSE | 3915.534 | 4650.235 | 3614.826 | 3462.558 |
| MAE | 2884.581 | 2594.251 | 2535.015 | 2168.949 |
通过对比4组实验(A组、B组、C组、D组),实验D均方根误差(RMSE)、平均绝对误差(MAE)均为最小,表明实验D所模拟的预测房价与真实房价之间误差最小,结果最为准确。实验D中拟合模型获得了最高的拟合优度(R2=0.805),相比3种传统方法(A: R2=0.592;B: R2=0.434;C: R2=0.653)其精度提升了至少23.28%。这表明当采用CNN进行遥感影像高级语义特征提取时(D组),比仅使用单一类型的输入数据(A组、B组)的拟合模型或通过多源数据简单地应用特征组合(C组)取得的精度更高。这表明仅仅使用遥感影像的原始纹理和结构特征或辅助地理数据并不能实现高精度的模拟预测,在对数据的挖掘过程中会丢失部分特征信息。相比之下,CNN则更适合于对遥感影像高级语义和背景信息的挖掘与提取[13,17,26]。
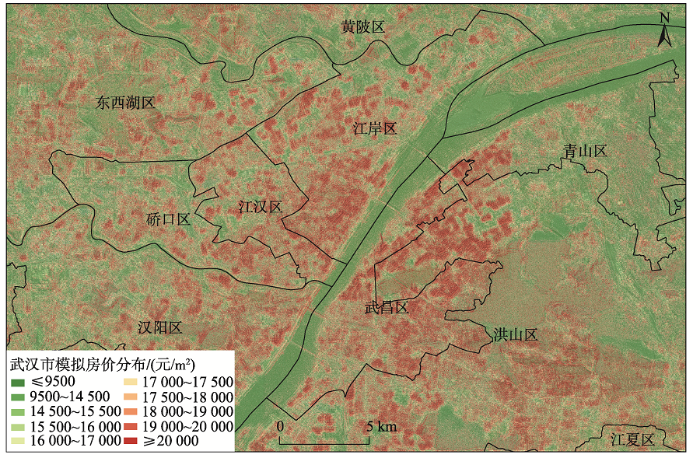
武汉市主要城区房价的 Moran's I指数的计算结果为0.109,z得分为126.054,p得分为0。武汉市主城区的房价已经通过了空间自相关检验且 Moran's I指数为正值,表明武汉市主城区的聚类分布特征已经非常明显,存在高值聚类、低值聚类的房价分布特点[27]。从图6可看出,高房价区域(
表4 武汉中心区域不同地区房价的平均值、标准差和总体准确度
Tab. 4 Average values, standard deviations, and overall accuracies of housing prices in different districts in Wuhan central area
| 区域类别 | 区域 | 真实/(元/m2) | 预测/(元/m2) | 准确度/% | ||
|---|---|---|---|---|---|---|
| 平均值 | 标准差 | 平均值 | 标准差 | |||
| 主城区 | 江汉区 | 19 577.900 | 4612.090 | 19 261.333 | 3913.542 | 98.38 |
| 江岸区 | 20 845.530 | 7071.716 | 20 337.013 | 5188.628 | 97.56 | |
| 洪山区 | 20 384.442 | 4577.304 | 19 654.007 | 3639.945 | 96.42 | |
| 武昌区 | 22 129.308 | 6297.948 | 20 964.847 | 3467.340 | 94.74 | |
| 汉阳区 | 16 674.734 | 3868.972 | 17 708.541 | 3544.656 | 93.80 | |
| 青山区 | 15 822.054 | 4327.896 | 16 813.957 | 3255.780 | 93.73 | |
| 远城区 | 江夏区 | 18 222.980 | 4833.506 | 18 423.225 | 3861.028 | 98.90 |
| 蔡甸区 | 15 347.774 | 4090.231 | 17 043.074 | 2801.621 | 88.95 | |
| 东西湖区 | 14 127.650 | 3076.744 | 16 367.463 | 2822.753 | 84.15 | |
| 黄陂区 | 12 825.273 | 2654.790 | 16 298.700 | 2303.813 | 72.92 | |
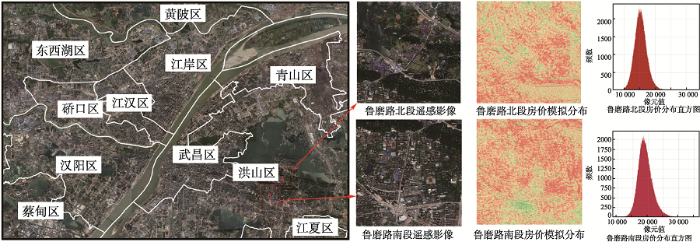
由模拟房价分布与真实房价分布的对比(图7,见第175页)可看出,模拟房价直方图与真实房价直方图具有较高的相似性,图像特征和形状相近,这表明利用CNN模拟的武汉市房价总体是精准的。另外,由图8可看出,洪山区鲁磨路南区域周边房价在15 000~22 000元/
图7 模拟房价和真实房价对比直方图
Fig. 7 Contrast histogram of simulated house prices and real house prices
图8 CNN房价模拟图细节
Fig. 8 Some details of the spatial distribution of housing prices simulated via CNN
此外,已有研究表明,武汉市城市空间结构在不断发展的过程中呈现出分形学特征[28]。为了进一步验证该结论,本文利用感知哈希算法[29],计算得到光谷附近区域模拟房价分布图(图8)与武汉市整体模拟房价分布图(图6)的相似度为0.828。并且,通过局部细节观察可知,鲁磨路南起光谷广场向北延伸。而光谷广场作为大型商业中心,其附近区域房价呈现由中心向四周下降的特点,并呈现出商业区、高新产业区、商住混合区房价较高,风景保护区、市郊区房价较低的分布规律,这与武汉市整体房价分布规律保持高度一致。因此,光谷区域的房价分布可以作为武汉市房价分布的自相似分形,并且也验证了武汉市房价分布有一定的分形学特征[30]。
综上所述,本文所提出的精细化制图方法不仅可以较高精度地模拟武汉市中心城区微观尺度下的房价分布,而且可以较好地显示出房价分布的空间异质性和城市分形特征。
中国大城市的房价过高现象[31],是目前中国城市经济发展面临的最紧迫的问题之一,最近越来越受到学术界的关注。然而,之前对于房价的研究主要集中于房价定价的驱动因素[32],或房价变化和经济波动之间的相关性的大尺度研究[33,34,35,36]。由于缺乏有效的数据和模型,在精细化刻画城市房价空间异质性分布的研究尚存空缺。
本研究通过卷积神经网络(CNN)实现对遥感影像高级语义特征的挖掘提取并利用随机森林(RF)进行拟合,以获得高精度的微观尺度房价分布图。通过在武汉市中心城区进行实验,并与其他不同的特征挖掘和模型相比,本文所提出的模型精度为最高,比传统方法提升至少23.28%。本研究得到的精细化的房价分布制图,除尺度更加精细,总体准确度更高外,还可以较好地显示出房价分布的空间异质性以及分形特征。在挖掘模型的训练中,数据是影响制图精度的重要因素之一[37],而本研究采用的CNN房价制图模型,对数据要求较低,数据组织和获取较容易,只需要高分辨率遥感影像和基础房价数据即可。此外,由于房价的分布可以在一定程度上代表居民的经济状况[38],所以此模型还可以对许多城市经济进行评估,为未来经济学和城市分形研究提供基础数据。例如,人类活动模式识别和城市土地价格分类以及城镇体系结构提取等。
然而,本研究所提出的模型没有将时间因素考虑在内。在现实的城市规划和建设中,往往存在基础配套设施建设和住房规划不同步的问题,而配套设施和住房价格又相互影响[39,40]。这就造成了在对遥感影像挖掘过程中,难免会因为此问题造成部分区域精度不高的问题。另外,如何确定并调整深度学习的参数,包括层数和卷积核大小,仍然是机器学习领域一个引人深思的问题[17,41]。本文所采用的模型主要依赖于对已有研究较好模型参数的参 考[11,12],今后也将对此开展进一步的研究,力求得到更高精度的模型和更细致的模拟房价分布图。
下一步将从3个方面开展研究工作:① 提高城市空间变异映射中CNN模型的可解释性;② 考虑将时间语义量化,并将其输入CNN模型,以实现更加精确的房价绘制和分析;③ 提高模型的学习能力,以便在更广泛的范围内(如国家和全球范围)绘制住房价格。
The authors have declared that no competing interests exist.
| [1] |
Effects of house prices on health: New evidence from Australia [J].https://doi.org/10.1016/j.socscimed.2017.09.008 URL PMID: 28961481 [本文引用: 1] 摘要
Recent house price variation has strongly affected households’ housing wealth and debt, yet the non-economic consequences of these changes in housing wealth are still poorly understood. Using a sample of 19,000 individuals from the Household, Income and Labour Dynamics in Australia Survey (HILDA) for 2001–2015, we examine the relationship between house price fluctuations and individual health by exploiting large exogenous changes in house prices in Australia. We find that an increase in local house prices is associated with a positive effect on the physical health of outright owners and a negative effect on the physical and mental health of renters. Improvements in physical health for outright owners can be partially attributed to health-related investments and behaviours such as a reduction in weight, an increase in physical exercise and an increase in time allocated to home production. These findings support the presence of a health-wealth gradient through the wealth mechanism distinct from the effects of local area amenities and macroeconomic conditions. Our findings highlight some of the often-overlooked social impacts – both positive and negative – of fluctuations in the housing market.
|
| [2] |
|
| [3] |
Urbanization, inequality and property prices: Equilibrium pricing and transaction in the Chinese housing market [J].https://doi.org/10.1016/j.chieco.2016.04.005 URL [本文引用: 1] 摘要
61Three striking empirical facts characterizes China's housing market.61A search model with endogenous setup cost is solved.61Through urbanization, evolution from pooled- to elitist-matching equilibrium drives up property price.61China's high growth in income and high inequality result in elitist-matching equilibrium.61Redistributive tax may decrease housing prices and increase social welfare.
|
| [4] |
|
| [5] |
Drastic measures for curbing housing price rising [J].
Land grant, high tax rate and bank loans fuel the rising of the housing prices in China and so if the rising trend of the housing prices is to becurbed, drastic measures should be taken. In the first place the illusion of every one owns his own home should be eradicated to change fundamentally theconsuming patterns of properties. Secondly, land and property business should be separated. In the third place, government should be the landlord to thehousing provided to civil servants, teachers and military, so as to stabilize the housing prices and rents in China.
|
| [6] |
Housing rent dynamics in Italy [J].https://doi.org/10.2139/ssrn.1698607 URL [本文引用: 1] 摘要
In this paper we focus on tenant rents in Italy and compare results from several methods for the rent dynamic estimation. We first document the sources of data available and then introduce quality-adjusted techniques, which enable us to separate the price variation due to qualitative changes in housing attributes from pure price changes. Finally, we compare these measures with unconditional and matched-type price indices derived from microdata. Over the period 1998-2006, we estimate a cumulative rent increase ranging between 40 and 80%. The upper bound refers to the average dynamic for a subset of flats entering the market in a given period. The hedonic approach suggests a substantially lower overall growth in tenant rent, around 40% for the same period.
|
| [7] |
An application of spatial econometrics in relation to hedonic house price modeling [J]. |
| [8] |
Measuring intra-urban poverty using land cover and texture metrics derived from remote sensing data [J].https://doi.org/10.1016/j.landurbplan.2014.11.009 URL [本文引用: 1] 摘要
This paper contributes empirical evidence about the usefulness of remote sensing imagery to quantify the degree of poverty at the intra-urban scale. This concept is based on two premises: first, that the physical appearance of an urban settlement is a reflection of the society; and second, that the people who reside in urban areas with similar physical housing conditions have similar social and demographic characteristics. We use a very high spatial resolution (VHR) image from one of the most socioeconomically divergent cities in the world, Medellin (Colombia), to extract information on land cover composition using per-pixel classification and on urban texture and structure using an automated tool for texture and structure feature extraction at object level. We evaluate the potential of these descriptors to explain a measure of poverty known as the Slum Index. We found that these variables explain up to 59% of the variability in the Slum Index. Similar approaches could be used to lower the cost of socioeconomic surveys by developing an econometric model from a sample and applying that model to the rest of the city and to perform intercensal or intersurvey estimates of intra-urban Slum Index maps.
|
| [9] |
An SVM ensemble approach combining spectral, structural, and semantic features for the classification of high-resolution remotely sensed imagery [J].https://doi.org/10.1109/TGRS.2012.2202912 URL [本文引用: 1] 摘要
In recent years, the resolution of remotely sensed imagery has become increasingly high in both the spectral and spatial domains, which simultaneously provides more plentiful spectral and spatial information. Accordingly, the accurate interpretation of high-resolution imagery depends on effective integration of the spectral, structural and semantic features contained in the images. In this paper, we propose a new multifeature model, aiming to construct a support vector machine (SVM) ensemble combining multiple spectral and spatial features at both pixel and object levels. The features employed in this study include a gray-level co-occurrence matrix, differential morphological profiles, and an urban complexity index. Subsequently, three algorithms are proposed to integrate the multifeature SVMs: certainty voting, probabilistic fusion, and an object-based semantic approach, respectively. The proposed algorithms are compared with other multifeature SVM methods including the vector stacking, feature selection, and composite kernels. Experiments are conducted on the hyperspectral digital imagery collection experiment DC Mall data set and two WorldView-2 data sets. It is found that the multifeature model with semantic-based postprocessing provides more accurate classification results (an accuracy improvement of 1-4% for the three experimental data sets) compared to the voting and probabilistic models.
|
| [10] |
CNN Features off-the-shelf: An astounding baseline for recognition [C]. |
| [11] |
Mining transition rules of cellular automata for simulating urban expansion by using the deep learning techniques [J].https://doi.org/10.1080/13658816.2017.1368523 URL [本文引用: 2] 摘要
Abstract In this article, we present the GeoCorpora corpus building framework and software tools as well as a geo-annotated Twitter corpus built with these tools to foster research and development in the areas of microblog/Twitter geoparsing and geographic information retrieval. The developed framework employs crowdsourcing and geovisual analytics to support the construction of large corpora of text in which the mentioned location entities are identified and geolocated to toponyms in existing geographical gazetteers. We describe how the approach has been applied to build a corpus of geo-annotated tweets that will be made freely available to the research community alongside this article to support the evaluation, comparison and training of geoparsers. Additionally, we report lessons learned related to corpus construction for geoparsing as well as insights about the notions of place and natural spatial language that we derive from application of the framework to building this corpus.
|
| [12] |
Mapping fine-scale urban housing prices by fusing remotely sensed imagery and social media data [J].https://doi.org/10.1111/tgis.2018.22.issue-2 URL [本文引用: 3] |
| [13] |
Large patch convolutional neural networks for the scene classification of high spatial resolution imagery [J].https://doi.org/10.1117/1.JRS.10.025006 URL [本文引用: 3] |
| [14] |
Cross-view gait identification with embedded learning [C]. |
| [15] |
Jeju Island, Korea: ImageNet classification with deep convolutional neural networks [C]. |
| [16] |
Improving neural networks by preventing co-adaptation of feature detectors [J]. |
| [17] |
Very deep convolutional networks for large-scale image recognition .
Abstract: In this work we investigate the effect of the convolutional network depth on its accuracy in the large-scale image recognition setting. Our main contribution is a thorough evaluation of networks of increasing depth using an architecture with very small (3x3) convolution filters, which shows that a significant improvement on the prior-art configurations can be achieved by pushing the depth to 16-19 weight layers. These findings were the basis of our ImageNet Challenge 2014 submission, where our team secured the first and the second places in the localisation and classification tracks respectively. We also show that our representations generalise well to other datasets, where they achieve state-of-the-art results. We have made our two best-performing ConvNet models publicly available to facilitate further research on the use of deep visual representations in computer vision.
|
| [18] |
Random forests [J].https://doi.org/10.1023/A:1010933404324 URL [本文引用: 1] |
| [19] |
基于特征空间优化的随机森林算法在GF-2影像湿地分类中的研究 [J].
由于季节性的植被动态和水文波动,湿地遥感影像分类常常比较困难。本文采用优化特征空间的随机森林算法(Random Forest)对吉林省白城市通榆县东部地区预处理后的GF-2影像进行湿地分类研究,具体分为2步:(1)对研究区遥感影像进行多尺度分割和对象特征的提取。针对一些学者获取最佳分割尺度时仍受主观因素影响较大的情况,本文通过改进全局最优分割方法来获得最佳分割尺度。(2)在最优分割的基础上,基于特征重要性对随机森林分类算法的特征空间进行优化,以得到最佳的随机森林分类结果,并与相同条件下(同数据、同分割尺度、同训练样本,同特征空间)的K-NN、SVM、CART 3种算法以及未优化特征空间的RF算法的分类结果进行了比较。结果表明,基于优化特征空间的RF算法的分类结果总精度和Kappa系数分别为93.038%和0.9177,而K-NN、SVM和CART 3种分类算法的分类结果的总精度分别为83.357%、78.068%、77.136%,未优化特征空间的RF算法分类结果总精度为90.937%。相较于K-NN、SVM、CART 3种分类算法,RF算法在GF-2湿地影像数据中具有更好的分类性能,同时优化特征空间的RF算法精度有所提高,在湿地资源管理中可以发挥非常重要的作用。
The random forest classification of wetland from gf-2 imagery based on the optimized feature space [J].
由于季节性的植被动态和水文波动,湿地遥感影像分类常常比较困难。本文采用优化特征空间的随机森林算法(Random Forest)对吉林省白城市通榆县东部地区预处理后的GF-2影像进行湿地分类研究,具体分为2步:(1)对研究区遥感影像进行多尺度分割和对象特征的提取。针对一些学者获取最佳分割尺度时仍受主观因素影响较大的情况,本文通过改进全局最优分割方法来获得最佳分割尺度。(2)在最优分割的基础上,基于特征重要性对随机森林分类算法的特征空间进行优化,以得到最佳的随机森林分类结果,并与相同条件下(同数据、同分割尺度、同训练样本,同特征空间)的K-NN、SVM、CART 3种算法以及未优化特征空间的RF算法的分类结果进行了比较。结果表明,基于优化特征空间的RF算法的分类结果总精度和Kappa系数分别为93.038%和0.9177,而K-NN、SVM和CART 3种分类算法的分类结果的总精度分别为83.357%、78.068%、77.136%,未优化特征空间的RF算法分类结果总精度为90.937%。相较于K-NN、SVM、CART 3种分类算法,RF算法在GF-2湿地影像数据中具有更好的分类性能,同时优化特征空间的RF算法精度有所提高,在湿地资源管理中可以发挥非常重要的作用。
|
| [20] |
Analysis of a Random Forests Model [J].https://doi.org/10.1109/TASE.2012.2183739 URL [本文引用: 1] 摘要
Summary: Random forests are a scheme proposed by Leo Breiman in the 2000’s for building a predictor ensemble with a set of decision trees that grow in randomly selected subspaces of data. Despite growing interest and practical use, there has been little exploration of the statistical properties of random forests, and little is known about the mathematical forces driving the algorithm. In this paper, we offer an in-depth analysis of a random forests model suggested by {\it L. Breiman} [see, e.g., Ann. Stat. 32, No. 1, 16311 (2004; Zbl 1105.62308)], which is very close to the original algorithm. We show in particular that the procedure is consistent and adapts to sparsity, in the sense that its rate of convergence depends only on the number of strong features and not on how many noise variables are present.
|
| [21] |
中部典型特大城市人口密度空间分布格局——以武汉为例 [J].https://doi.org/10.15957/j.cnki.jjdl.2015.09.005 URL [本文引用: 1] 摘要
为弥补既有研究存在的数据平均化基于单一空间类型、对山水资源富集城市针对性不强等不足,以武汉为例,基于城镇居住用地、乡镇街行政辖区、规划地域层次及格网单元的多重叠加,利用GIS及SPSS识别市域及主城区人口密度分布特征。研究发现:市域乡镇街人口密度梯度差异大,"核心—边缘—外围"结构突出,"圈层层级式"格局显著;主城区人口高度密集,密度分布呈"复合多中心";"两江口"是三环内人口主中心,其4km范围内单中心结构突出,符合幂函数模型;4km外具备4个人口副中心,主副中心在西北、东北和东南形成三条人口密集轴带。分析认为:我国(特)大城市市域人口密度格局多遵循"核心—边缘"及"圈层分布"规律;主城区存在高密度主中心,人口分布普遍经历从"单核心"向"单核—多核复合化"的渐进过渡,不能单纯用"非单即多"定义主城区人口格局,城市人口密度模型因时、因地而异。
Spatial distribution of population density of typical megacities in central China: A case study of Wuhan [J].https://doi.org/10.15957/j.cnki.jjdl.2015.09.005 URL [本文引用: 1] 摘要
为弥补既有研究存在的数据平均化基于单一空间类型、对山水资源富集城市针对性不强等不足,以武汉为例,基于城镇居住用地、乡镇街行政辖区、规划地域层次及格网单元的多重叠加,利用GIS及SPSS识别市域及主城区人口密度分布特征。研究发现:市域乡镇街人口密度梯度差异大,"核心—边缘—外围"结构突出,"圈层层级式"格局显著;主城区人口高度密集,密度分布呈"复合多中心";"两江口"是三环内人口主中心,其4km范围内单中心结构突出,符合幂函数模型;4km外具备4个人口副中心,主副中心在西北、东北和东南形成三条人口密集轴带。分析认为:我国(特)大城市市域人口密度格局多遵循"核心—边缘"及"圈层分布"规律;主城区存在高密度主中心,人口分布普遍经历从"单核心"向"单核—多核复合化"的渐进过渡,不能单纯用"非单即多"定义主城区人口格局,城市人口密度模型因时、因地而异。
|
| [22] |
土地资源空间异质性与经济发展水平的关系研究——以武汉城市圈为例 [J].https://doi.org/10.11849/zrzyxb.2015.05.002 URL [本文引用: 1] 摘要
从土地资源属性出发,采用主成分分析法综合测度武汉城市圈土地资源空间异质性,利用Tobit模型对土地资源空间异质性与经济发展水平的关系进行分析。研究表明:城市圈土地资源空间异质性是土地质量、结构、数量和禀赋等特征异质的综合反映,其中土地质量和结构异质是主因;城市圈土地资源空间异质性指数区间为[0.015,0.737],可分为高异质区、中高异质区、一般异质区、中低异质区、低异质区5个梯度区;城市圈土地资源空间异质性呈现出"中心高、边缘低"的分布特征,各异质梯度区内研究单元数量和面积差异明显;城市化水平和人均GDP对土地资源空间异质性具有显著的正向影响,第三产业比重具有显著的负向影响,提高第三产业比重能够降低城市圈土地资源异质性。
Study on relationship between spatial heterogeneity of land resources and economic development: A case study of Wuhan urban agglomeration [J].https://doi.org/10.11849/zrzyxb.2015.05.002 URL [本文引用: 1] 摘要
从土地资源属性出发,采用主成分分析法综合测度武汉城市圈土地资源空间异质性,利用Tobit模型对土地资源空间异质性与经济发展水平的关系进行分析。研究表明:城市圈土地资源空间异质性是土地质量、结构、数量和禀赋等特征异质的综合反映,其中土地质量和结构异质是主因;城市圈土地资源空间异质性指数区间为[0.015,0.737],可分为高异质区、中高异质区、一般异质区、中低异质区、低异质区5个梯度区;城市圈土地资源空间异质性呈现出"中心高、边缘低"的分布特征,各异质梯度区内研究单元数量和面积差异明显;城市化水平和人均GDP对土地资源空间异质性具有显著的正向影响,第三产业比重具有显著的负向影响,提高第三产业比重能够降低城市圈土地资源异质性。
|
| [23] |
空间异质性与区域房地产价格波动的差异——基于地理加权回归的实证研究 [J].
本文从空间计量经济学理论出发,基于2003~2007年我国各省、市、自治区数据,采用地理加权回归模型(GWR)分析我国房价波动的成因,并从区域差异的角度分析了各地区房价波动的空间异质性。实证结果表明:人均可支配收入和土地交易价格对全国的房价影响较为显著;东部地区居民人均可支配收入的提高成为推动房价上涨的一个重要因素,而经济发展相对较慢的中、西部地区的房价更多地依赖于当地经济水平的提高,并且一般物价水平的上升也成为推动中西部地区房价上升的一个重要因素。
Spatial heterogeneity and the difference of regional fluctuation in housing price: Based on the geographically weighted regression [J].
本文从空间计量经济学理论出发,基于2003~2007年我国各省、市、自治区数据,采用地理加权回归模型(GWR)分析我国房价波动的成因,并从区域差异的角度分析了各地区房价波动的空间异质性。实证结果表明:人均可支配收入和土地交易价格对全国的房价影响较为显著;东部地区居民人均可支配收入的提高成为推动房价上涨的一个重要因素,而经济发展相对较慢的中、西部地区的房价更多地依赖于当地经济水平的提高,并且一般物价水平的上升也成为推动中西部地区房价上升的一个重要因素。
|
| [24] |
人口流动视角下中国房价波动的空间异质性 [J].https://doi.org/10.3969/j.issn.1000-4149.2017.06.005 URL [本文引用: 1] 摘要
尽管从全球范围来看影响房价波动的因素有许多,但在中国流动人口带来的住房需求却成为提高城市房价的关键因素。基于2005—2013年235个地级市数据的研究发现,净流入人口越多的地区,房价涨幅越快,流动人口每增加10万,将会使每100平方米住房价格上涨3360元,特别在一、二线城市,房价分别上涨6024元和15394元。2010年以后,流动人口在东西部对房价的影响存在显著的异质性,地理加权回归结果表明,流动人口是使房价波动呈空间异质性的主要因素,其中,珠三角地区成为人口流动对房价影响最大的地区。
The spatial heterogeneity of house price volatility in China from the perspective of migration [J].https://doi.org/10.3969/j.issn.1000-4149.2017.06.005 URL [本文引用: 1] 摘要
尽管从全球范围来看影响房价波动的因素有许多,但在中国流动人口带来的住房需求却成为提高城市房价的关键因素。基于2005—2013年235个地级市数据的研究发现,净流入人口越多的地区,房价涨幅越快,流动人口每增加10万,将会使每100平方米住房价格上涨3360元,特别在一、二线城市,房价分别上涨6024元和15394元。2010年以后,流动人口在东西部对房价的影响存在显著的异质性,地理加权回归结果表明,流动人口是使房价波动呈空间异质性的主要因素,其中,珠三角地区成为人口流动对房价影响最大的地区。
|
| [25] |
Combining satellite imagery and machine learning to predict poverty [J].https://doi.org/10.1126/science.aaf7894 URL PMID: 27540167 [本文引用: 1] 摘要
Reliable data on economic livelihoods remain scarce in the developing world, hampering efforts to study these outcomes and to design policies that improve them. Here we demonstrate an accurate, inexpensive, and scalable method for estimating consumption expenditure and asset wealth from high-resolution satellite imagery. Using survey and satellite data from five African countries—Nigeria, Tanzania, Uganda, Malawi, and Rwanda—we show how a convolutional neural network can be trained to identify image features that can explain up to 75% of the variation in local-level economic outcomes. Our method, which requires only publicly available data, could transform efforts to track and target poverty in developing countries. It also demonstrates how powerful machine learning techniques can be applied in a setting with limited training data, suggesting broad potential application across many scientific domains.
|
| [26] |
Big data deep learning: Challenges and perspectives [J].https://doi.org/10.1109/ACCESS.2014.2325029 URL [本文引用: 1] 摘要
Deep learning is currently an extremely active research area in machine learning and pattern recognition society. It has gained huge successes in a broad area of applications such as speech recognition, computer vision, and natural language processing. With the sheer size of data available today, big data brings big opportunities and transformative potential for various sectors; on the other hand, it also presents unprecedented challenges to harnessing data and information. As the data keeps getting bigger, deep learning is coming to play a key role in providing big data predictive analytics solutions. In this paper, we provide a brief overview of deep learning, and highlight current research efforts and the challenges to big data, as well as the future trends.
|
| [27] |
The analysis of spatial association by use of distance statistics [J]. |
| [28] |
城市体系分形特征的初步研究 [J].
本文在简要介绍分形理论的基础上,着重研究城市体系的分开。特征,探讨了城市体系空间分布、随机扩散和规模分布的规律性,并指出了在城市体系研究中运用分形理论有待于进一步探讨的问题。
Preliminary studies on the fractal properties of systems of towns [J].
本文在简要介绍分形理论的基础上,着重研究城市体系的分开。特征,探讨了城市体系空间分布、随机扩散和规模分布的规律性,并指出了在城市体系研究中运用分形理论有待于进一步探讨的问题。
|
| [29] |
A secure perceptual hash algorithm for image content authentication [J].https://doi.org/10.1007/978-3-642-24712-5 URL [本文引用: 1] |
| [30] |
分形城市与城市规划 [J].https://doi.org/10.3321/j.issn:1002-1329.2005.02.008 URL [本文引用: 1] 摘要
分形城市是自组织城市中非常重要的内容之一,也是与城市规划关系最为密切的自组织城市研究领域.本文首先阐述分形城市的基本概念及其测度方法,然后论证分形思想在城市规划中的应用思路和发展前景.分形是大自然的优化结构,分形体能够最有效地占据空间.借助分形思想规划城市和城市体系,将能使我们更为有效地利用地理空间和环境,美化人类的家园.
Fractal cities and city planing [J].https://doi.org/10.3321/j.issn:1002-1329.2005.02.008 URL [本文引用: 1] 摘要
分形城市是自组织城市中非常重要的内容之一,也是与城市规划关系最为密切的自组织城市研究领域.本文首先阐述分形城市的基本概念及其测度方法,然后论证分形思想在城市规划中的应用思路和发展前景.分形是大自然的优化结构,分形体能够最有效地占据空间.借助分形思想规划城市和城市体系,将能使我们更为有效地利用地理空间和环境,美化人类的家园.
|
| [31] |
A geographically and temporally weighted autoregressive model with application to housing prices [J].https://doi.org/10.1080/13658816.2013.878463 URL [本文引用: 1] 摘要
Spatiotemporal autocorrelation and nonstationarity are two important issues in the modeling of geographical data. Built upon the geographically weighted regression (GWR) model and the geographically and temporally weighted regression (GTWR) model, this article develops a geographically and temporally weighted autoregressive model (GTWAR) to account for both nonstationary and auto-correlated effects simultaneously and formulates a two-stage least squares framework to estimate this model. Compared with the maximum likelihood estimation method, the proposed algorithm that does not require a prespecified distribution can effectively reduce the computation complexity. To demonstrate the efficacy of our model and algorithm, a case study on housing prices in the city of Shenzhen, China, from year 2004 to 2008 is carried out. The results demonstrate that there are substantial benefits in modeling both spatiotemporal nonstationarity and autocorrelation effects simultaneously on housing prices in terms of and Akaike Information Criterion (AIC). The proposed model reduces the absolute errors by 31.8% and 67.7% relative to the GTWR and GWR models, respectively, in the Shenzhen data set. Moreover, the GTWAR model improves the goodness-of-fit of the ordinary least squares model and the GTWR model from 0.617 and 0.875 to 0.914 in terms of . The AIC test corroborates that the improvements made by GTWAR over the GWR and the GTWR models are statistically significant.
|
| [32] |
Driving forces analysis for residential housing price in Beijing [J].https://doi.org/10.1016/j.proenv.2010.10.104 URL [本文引用: 1] 摘要
Previous research showed that various factors could influence the housing market. In this paper, hedonic pricing method was employed to analyze the effects of structural variables, including land transaction price, the distance to downtown area, central business district, railway station and hospital, floor area ratio (FAR), number of bus lines nearby and dichotomous variables, including nearness to rail transit, recreational facilities and parks which reflects the accessibility and living conditions, on housing transaction price. Hedonic pricing models including linear and semi-logarithm regression model were constructed. Results showed that the semi-logarithm model had relatively stronger explanatory power than linear model. The main determinants of housing transaction price in Beijing city were land transaction price, FAR and the distance between housing to downtown area. Among which, transaction price of located land had notably raised housing transaction price, contributing 98.8% to the selling price. FAR and distance from housing to the downtown area were the main negative driving forces for housing transaction price. Compared with structural variables, though correlation analysis indicated that nearness to rail transit and existence of recreational facilities had significant positive correlation with housing transaction price, it was not demonstrated in the regression results. In this study, wavelet-based denoising method was tentatively employed in pretreating data for semi-logarithmic models, and result suggested that the explanatory power of semi-logarithm regression was enhanced.
|
| [33] |
Empirical study on the impact of urban rail Transit on house rice: Based on hedonic price model [J].
Taking Urban Rail Transit Line 8 as an example,the paper uses hedonic price model to research the impact of urban rail transit on house price.It concludes that urban rail transit has significant incremental effect on the price of houses within 1to 1.5km distance.However,different station has different impact in both range and intensity.Besides,house price increases most rapidly in years of starting to build and operate,and decreased slightly in the mid-term of building,which is caused by the noise pollution,air pollution and traffic inconvenience during the period of construction.
|
| [34] |
Spatial differentiation of urban housing prices and its impacts on land market in China [J].
The purpose of this study is to study on the new trends, new patterns and new features of spatial differentiation of urban housing prices in China, and discuss driving factors and mechanism of land market. Methods employed were PDI index, GIS and gray relative analysis. The results indicate that 1) significant spatial inequality of urban housing prices exists in china, especially the grade differentiation between first-tier cities and other cities; 2) the administrative hierarchical disparity of housing prices enhanced, while the spatial agglomeration disparity weakened; 3) the land supply and cost are in direct relation to spatial differentiation of urban housing prices in China, with the first factor being the most significantly; 4) the influence of land market for the housing prices vary among cities with different levels, with first-tier cities being the most significantly. It is concluded that significant spatial inequality and disparity of urban housing prices exists in China. It is closely related to factors of land market, and the core driving force is the land supply.
|
| [35] |
Capital inflows and house prices: Aggregate and regional evidence from China [J].https://doi.org/10.1111/1467-8454.12095 URL [本文引用: 1] 摘要
Rising house prices in China have been of concern for investors and policymakers. Prices have risen substantially in the last decade, especially in large urban
|
| [36] |
基于地理探测器的南京市住宅租金空间分异格局及驱动因素研究 [J].
以南京市“一主三副”住宅小区为研究单元,运用GIS中的渔网(Fishnet)分析和探索性空间数据分析(ESDA)对“一主三副”住宅租金的空间分布进行模拟和估计,并利用地理探测器模型从住宅小区的区位特征、建筑特征和邻里特征3个方面探究住宅租金空间分异的影响机制。结果表明:① 南京市住宅租金总体呈上升趋势,空间上表现出主城向副城递减的中心外围模式,住宅租金空间结构逐渐由单核向双核发展,且住宅租金存在显著的空间异质性;② 住宅租金呈现出明显的空间正相关性和区域集聚性,热点区自内城核心区至副城趋于弱化,冷热点空间格局呈圈层结构;③ 交通位势和中心位势是对一主三副住宅租金解释力最大的因素,商务配套、金融设施和住宅房龄的解释力次之,特征因素对主城副城租金的影响强度各异。
Spatial differentiation and influence factors of residential rent in Nanjing based on geographical detector. Journal of Geo-information
以南京市“一主三副”住宅小区为研究单元,运用GIS中的渔网(Fishnet)分析和探索性空间数据分析(ESDA)对“一主三副”住宅租金的空间分布进行模拟和估计,并利用地理探测器模型从住宅小区的区位特征、建筑特征和邻里特征3个方面探究住宅租金空间分异的影响机制。结果表明:① 南京市住宅租金总体呈上升趋势,空间上表现出主城向副城递减的中心外围模式,住宅租金空间结构逐渐由单核向双核发展,且住宅租金存在显著的空间异质性;② 住宅租金呈现出明显的空间正相关性和区域集聚性,热点区自内城核心区至副城趋于弱化,冷热点空间格局呈圈层结构;③ 交通位势和中心位势是对一主三副住宅租金解释力最大的因素,商务配套、金融设施和住宅房龄的解释力次之,特征因素对主城副城租金的影响强度各异。
|
| [37] |
数据质量和数据清洗研究综述 [J].
对数据质量,尤其是数据清洗的研究进行了综述。首先说明数据质量的重要性和衡量指标,定义了数据清洗问题。然后对数据清洗问题进行分类,并分析了解决这些问题的途径。最后说明数据清洗研究与其他技术的结合情况,分析了几种数据清洗框架。最后对将来数据清洗领域的研究问题作了展望。
Research on data quality and data cleaning: A Survey [J].
对数据质量,尤其是数据清洗的研究进行了综述。首先说明数据质量的重要性和衡量指标,定义了数据清洗问题。然后对数据清洗问题进行分类,并分析了解决这些问题的途径。最后说明数据清洗研究与其他技术的结合情况,分析了几种数据清洗框架。最后对将来数据清洗领域的研究问题作了展望。
|
| [38] |
Spatial lock-in: Do falling house prices constrain residential mobility? [J].https://doi.org/10.1006/juec.2000.2205 URL [本文引用: 1] 摘要
Falling house prices have caused numerous homeowners to suffer capital losses. Those with little home equity may be prevented from moving because of imperfections in housing finance markets: the proceeds from the sale of their home may be insufficient to repay their mortgage and provide a down payment on a new home. A data set of mortgages is used to examine the magnitude of these constraints. Estimates show that average mobility would have been 24% higher after 3 years had house prices not declined, and after 4 years, it would have been 33% higher. Among those with high initial loan-to-value ratios, the differences are even greater.
|
| [39] |
Do educational facilities affect housing price? An empirical study in Hangzhou, China [J].https://doi.org/10.1016/j.habitatint.2013.12.004 URL [本文引用: 1] |
| [40] |
基于住宅价格的北京城市空间结构研究 [J].https://doi.org/10.11820/dlkxjz.2014.10.004 URL Magsci [本文引用: 1] 摘要
城市空间结构是城市地理研究的核心重点之一。近年来,城市住宅价格快速增长,一方面导致城市空间结构出现了一些新的特征和问题,另一方面住宅价格也可敏锐地反映出城市空间结构的演变。因此,本文从住宅价格的角度对北京市城市空间结构进行了探讨。利用北京市2005 年和2012 年二手房市场住宅的空间数据,通过GIS空间分析、空间自相关分析和Hedonic 回归分析等方法,对住宅价格时空格局及影响因素进行了分析,并在此基础上从住宅价格的角度探讨了城市空间结构的优化调整问题。北京市住宅价格存在蔓延式增长、空间差异明显及空间自相关性高等特点,其主要的影响因素包括区位条件、交通便利度、周围环境、基础设施、物业等级等。基于住宅价格得出北京市空间结构的主要特征为:①已形成了多中心的城市空间结构格局。除市中心外,还有亚奥地区、万柳—香山地区、中关村地区、复兴门地区、CBD等次中心,空间扩张仍呈现“摊大饼”的发展模式;②社会空间分异现象有所缓解,但仍存在明显的居住隔离。金融街、月坛等街道是房价高值集聚区,易形成“富人区”,而南六环尤其是房山则易形成“穷人区”;③交通条件和周围硬件环境等基础设施对城市空间结构有一定的调整作用,但调整的效果并不理想。
Research on urban spatial structure in Beijing based on housing prices [J].https://doi.org/10.11820/dlkxjz.2014.10.004 URL Magsci [本文引用: 1] 摘要
城市空间结构是城市地理研究的核心重点之一。近年来,城市住宅价格快速增长,一方面导致城市空间结构出现了一些新的特征和问题,另一方面住宅价格也可敏锐地反映出城市空间结构的演变。因此,本文从住宅价格的角度对北京市城市空间结构进行了探讨。利用北京市2005 年和2012 年二手房市场住宅的空间数据,通过GIS空间分析、空间自相关分析和Hedonic 回归分析等方法,对住宅价格时空格局及影响因素进行了分析,并在此基础上从住宅价格的角度探讨了城市空间结构的优化调整问题。北京市住宅价格存在蔓延式增长、空间差异明显及空间自相关性高等特点,其主要的影响因素包括区位条件、交通便利度、周围环境、基础设施、物业等级等。基于住宅价格得出北京市空间结构的主要特征为:①已形成了多中心的城市空间结构格局。除市中心外,还有亚奥地区、万柳—香山地区、中关村地区、复兴门地区、CBD等次中心,空间扩张仍呈现“摊大饼”的发展模式;②社会空间分异现象有所缓解,但仍存在明显的居住隔离。金融街、月坛等街道是房价高值集聚区,易形成“富人区”,而南六环尤其是房山则易形成“穷人区”;③交通条件和周围硬件环境等基础设施对城市空间结构有一定的调整作用,但调整的效果并不理想。
|
| [41] |
TensorFlow: Large-scale machine learning on heterogeneous distributed systems [J].
TensorFlow is an interface for expressing machine learning algorithms, and an implementation for executing such algorithms. A computation expressed using TensorFlow can be executed with little or no change on a wide variety of heterogeneous systems, ranging from mobile devices such as phones and tablets up to large-scale distributed systems of hundreds of machines and thousands of computational devices such as GPU cards. The system is flexible and can be used to express a wide variety of algorithms, including training and inference algorithms for deep neural network models, and it has been used for conducting research and for deploying machine learning systems into production across more than a dozen areas of computer science and other fields, including speech recognition, computer vision, robotics, information retrieval, natural language processing, geographic information extraction, and computational drug discovery. This paper describes the TensorFlow interface and an implementation of that interface that we have built at Google. The TensorFlow API and a reference implementation were released as an open-source package under the Apache 2.0 license in November, 2015 and are available at www.tensorflow.org.
|

/
| 〈 |
|
〉 |
