
三江源生态工程实施前后长江源区宏观生态状况变化分析
作者简介:刘璐璐(1988-),女,山东人,博士生,研究方向为GIS与生态信息。E-mail:liull.11s@igsnrr.ac.cn
收稿日期: 2015-08-24
要求修回日期: 2015-11-16
网络出版日期: 2016-08-10
基金资助
国家自然科学基金面上项目(41571504)
国家科技支撑计划项目(2013BAC03B04)
三江源智慧生态畜牧业平台建设项目(2015-SF-A4-1)
中国科学院特色研究所培育建设项目(TSYJS05)
中国科学院科技服务网络计划项目(KFJ-EW-STS-005-04)
Change of Ecological Condition in the Headwater of the Yangtze River Before and After the Implementation of the Ecological Conservation and Construction Project
Received date: 2015-08-24
Request revised date: 2015-11-16
Online published: 2016-08-10
Copyright
基于NDVI时空序列数据,利用GLOPEM-CEVSA模型,本文估算并分析了长江源区1997-2012年植被覆盖度及植被净初级生产力时空变化特征,并在此基础上评估了生态工程实施前、后长江源区宏观生态状况变化。结果表明:工程实施后,长江源区宏观生态状况显著好转,植被覆盖度及植被净初级生产力明显增加。从多年平均值来看,工程实施后,植被覆盖度好转区域面积占植被区总面积的72.10%,净初级生产力增加区域面积占植被区总面积的73.82%;从变化趋势来看,植被覆盖度好转区域面积净增加13.02%,植被净初级生产力好转区域面积净增加24.62%。工程实施前后相比,各流域宏观生态状况恢复程度具有差异,其中楚玛尔河源头植被覆盖度上升最明显,通天河流域植被净初级生产力上升最明显。长江源区宏观生态状况的好转受益于气候的湿润化及生态工程的共同影响,若要全面有效改善仍需持续努力。
刘璐璐 , 曹巍 , 邵全琴 . 三江源生态工程实施前后长江源区宏观生态状况变化分析[J]. 地球信息科学学报, 2016 , 18(8) : 1069 -1076 . DOI: 10.3724/SP.J.1047.2016.01069
The positive effects of ecological conservation and construction projects on ecosystem restoration were obvious in the headwater of the Yangtze River. This paper estimated the vegetation coverage (VC) and net primary productivity (NPP) during the period of 1997-2012 in this region by applying the GLOPEM-CEVSA model and time series Normalized Difference Vegetation Index (NDVI) dataset. Then, the changes of ecological conditions before and after the implementation of projects were assessed. The results showed that the ecological conditions in the headwater of the Yangtze River were significantly improved after implementing the projects, with obviously increased VC and NPP. From the annual average levels of VC and NPP, we can see that by comparing the conditions before and after implementing the projects, the area with increased VC and NPP had accounted for 72.10% and 73.82% of the total area respectively. And by looking into the variation trends, we can also see that the area with restored VC and NPP had increased by 13.02% and 24.62% respectively. The vegetation restorations were varied in different watersheds. Compared the conditions before and after implementing the project, the restoration of VC in the headwater of the Chumaer River showed an obvious improvement and NPP had increased significantly in the Tongtian River watershed. The restoration of the ecological condition in the headwater of the Yangtze River was benefited from the combined effects of the humid climate and the ecological projects, while continuous efforts are still needed to improve the ecological environment sustainably and effectively in the future.
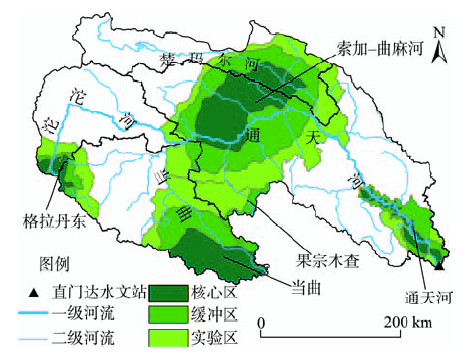
Fig. 1 The scope of the ecological conservation and construction project in the headwater of the Yangtze River图1 长江源区生态工程实施范围 |
Tab. 1 The area of vegetation coverage change before and after implementing the ecological project in the headwater of the Yangtze River表1 工程实施前后长江源区植被覆盖度变化面积统计表 |
| 植被覆盖度 变化分级/(%) | 工程实施前后植被覆盖度变化 | |
|---|---|---|
| 面积/km2 | 面积比重/(%) | |
| 明显变差(<-10) | 1698.92 | 1.57 |
| 轻微变差(-10~-2) | 10 345.53 | 9.56 |
| 基本稳定(-2~2) | 18 142.35 | 16.77 |
| 轻微好转(2~10) | 50 071.14 | 46.28 |
| 明显好转(>10) | 27 937.63 | 25.82 |
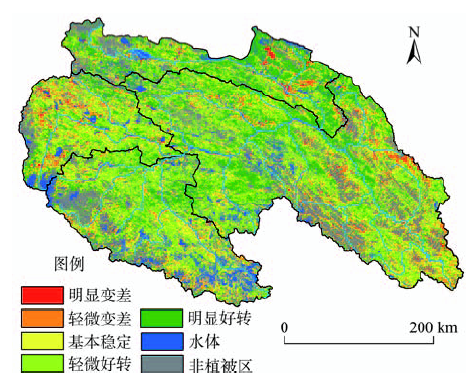
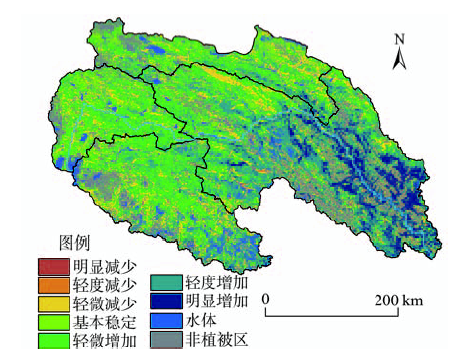
Fig. 2 The spatial distribution of vegetation coverage change before and after implementing the ecological project in the headwater of the Yangtze River图2 工程实施前后长江源区植被覆盖度变化空间分布图 |
Tab. 2 The area of vegetation coverage variation trend before and after implementing the ecological project in the headwater of the Yangtze River表2 工程实施前后长江源区植被覆盖度变化趋势面积统计表 |
| 植被覆盖度变化趋势 (年变化率) | 生态工程前(1997-2004年) | 生态工程后(2005-2012年) | ||
|---|---|---|---|---|
| 面积/km2 | 面积比重/(%) | 面积/km2 | 面积比重/(%) | |
| 明显变差(<-0.01) | 571.12 | 0.53 | 2 949.83 | 2.73 |
| 轻微变差(-0.01- -0.001) | 25 514.45 | 23.57 | 19 719.31 | 18.22 |
| 基本稳定(-0.001-0.001) | 23 635.64 | 21.84 | 12 961.12 | 11.98 |
| 轻微好转(0.001-0.01) | 53 402.43 | 49.34 | 68 156.87 | 62.97 |
| 明显好转(> 0.01) | 5 115.67 | 4.73 | 4 445.42 | 4.11 |
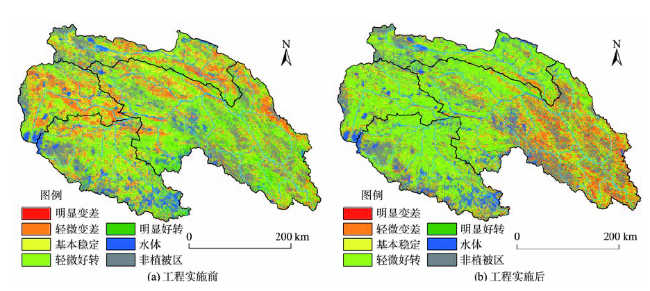
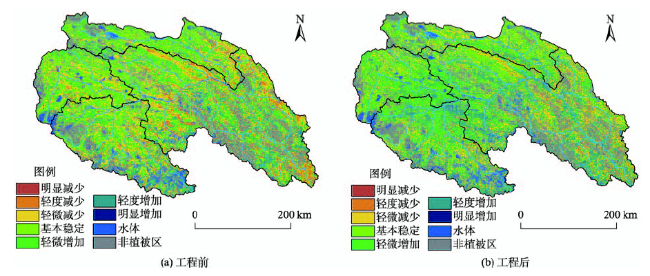
Fig. 3 The spatial distribution of vegetation coverage variation trend before (a) and after (b) implementing the ecological project in the headwater of the Yangtze River图3 工程前后长江源区植被覆盖度变化率空间分布图 |
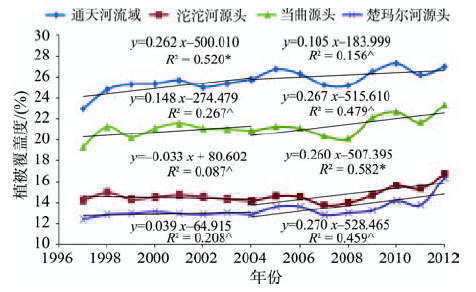
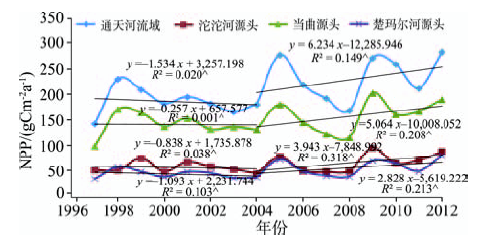
Fig. 4 The interannual variation of vegetation coverage in the headwater of the Yangtze River during 1997-2012图4 1997-2012年长江源区植被覆盖度年际变化 注:∧ P> 0.05;* P< 0.05 |
Tab. 3 The area of NPP change before and after implementing the ecological project in the headwaters of the Yangtze River表3 工程前后长江源区植被净初级生产力变化面积统计表 |
| 植被净初级生产力变化/(gCm-2a-1) | 工程前后植被净初级生产力变化 | |
|---|---|---|
| 面积/km2 | 占全区面积比重/(%) | |
| 明显减少(<-100) | 152.04 | 0.14 |
| 轻度减少(-100~-50) | 1 023.97 | 0.95 |
| 轻微减少(-50~-5) | 11 578.77 | 10.69 |
| 基本稳定(-5~5) | 15 595.60 | 14.40 |
| 轻微增加(5~50) | 50 788.03 | 46.91 |
| 轻度增加(50~100) | 19 794.80 | 18.28 |
| 明显增加(>100) | 9 343.22 | 8.63 |
Fig. 5 The spatial distribution of NPP change before and after implementing the ecological project in the headwater of the Yangtze River图5 工程前后长江源区植被净初级生产力变化空间分布图 |
Tab. 4 The area of NPP variation trend before and after implementing the ecological project in the headwater of the Yangtze River表4 1997-2012年三江源地区植被净初级生产力变化率面积统计表 |
| 植被净初级生产力变化率分级/(gCm-2a-1) | 工程前(1997-2004年) | 工程后(2004-2012年) | ||
|---|---|---|---|---|
| 面积/km2 | 面积比重/(%) | 面积/km2 | 面积比重/(%) | |
| 明显减少(<-50) | 129.86 | 0.12 | 71.05 | 0.07 |
| 轻度减少(-50~-10) | 11 746.68 | 10.85 | 5 023.11 | 4.64 |
| 轻微减少(-10~-1) | 38 631.19 | 35.69 | 17 614.05 | 16.27 |
| 基本稳定(-1~1) | 16 843.72 | 15.56 | 17 993.2 | 16.62 |
| 轻微增加(1~10) | 32 797.12 | 30.30 | 49 638.97 | 45.86 |
| 轻度增加(10~50) | 8 083.98 | 7.47 | 17 680.02 | 16.34 |
| 明显增加(>50) | 0.00 | 0.00 | 212.15 | 0.20 |
Fig. 6 The spatial distribution of NPP variation trend before (a) and after (b) implementing theecological project in the headwater of the Yangtze River图6 工程前后长江源区植被净初级生产力变化率空间分布图 |
Fig. 7 The interannual variation of NPP in the headwater of the Yangtze River during 1997-2012图7 1997-2012年长江源区平均植被净初级生产力年际变化趋势 注:∧ P> 0.05 |
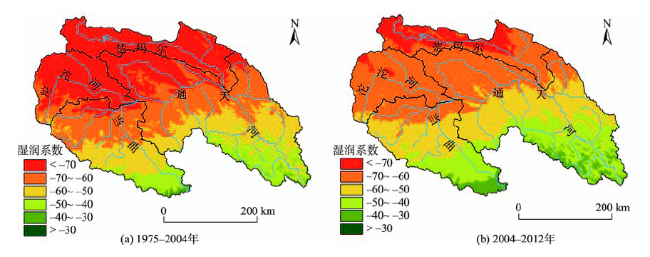
Fig. 8 The average moisture coefficient in the headwater of the Yangtze River图8 长江源区平均湿润系数空间分布 |
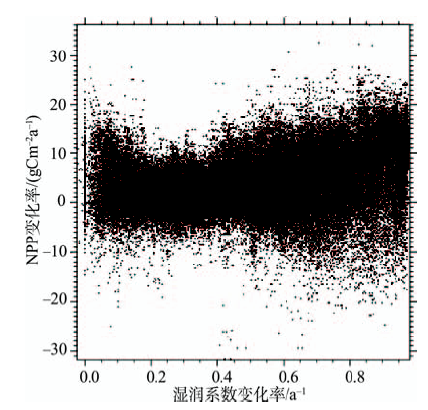
Fig. 9 The scatter distribution of NPP change rate and moisture coefficient change rate in the headwaterof the Yangtze River图9 长江源区NPP年际变化率与湿润指数年际变化率的散点分布图 |
The authors have declared that no competing interests exist.
| [1] |
[
|
| [2] |
[
|
| [3] |
[
|
| [4] |
[
|
| [5] |
|
| [6] |
[
|
| [7] |
|
| [8] |
[
|
| [9] |
[
|
| [10] |
[
|
| [11] |
[
|
| [12] |
[
|
| [13] |
[
|
| [14] |
[
|
| [15] |
|
| [16] |
|
| [17] |
[
|
| [18] |
[
|
| [19] |
|
| [20] |
|
/
| 〈 |
|
〉 |