
三江源生态工程实施以来草地恢复态势及现状分析
作者简介:徐新良(1972-),男,山东青岛人,博士,研究员,硕士生导师,主要从事土地利用/土地覆被变化与陆地生态系统综合监测与评估研究。E-mail: xuxl@lreis.ac.cn
收稿日期: 2016-06-29
要求修回日期: 2016-08-25
网络出版日期: 2017-01-13
基金资助
中国科学院重点部署项目(KJZD-EW-TZ-G10)
中国科学院特色研究所培育建设服务项目(TSYJS03)
Analysis of the Grassland Restoration Trend and Degradation Situation in the “Three-River Headwaters” Region since the Implementation of the Ecological Project
Received date: 2016-06-29
Request revised date: 2016-08-25
Online published: 2017-01-13
Copyright
三江源生态保护与建设工程实施以来,区域生态环境发生了明显的改善。为了正确认识该地区草地退化恢复的程度及其空间分布特征,本文通过对比分析2004年和2012年2期遥感影像,利用人工解译的手段获取了工程实施后三江源地区退化草地变化态势数据集,并在此基础上分析了退化草地的恢复态势,以及草地退化现状的空间格局特征。结果表明:① 2004-2012年三江源生态工程实施以后,该地区草地退化呈现不同程度的减缓态势,而且局部地区草地状况明显好转;② 三江源地区各县草地退化趋势基本得到控制,退化草地变化以轻微好转和明显好转为主,退化发生和退化加剧现象仅发生在极少数县;③ 2012年三江源退化草地面积比2004年降低了5.78%,其中中度退化草地的面积减少最显著,下降了5.35%。黄河源和长江源草地退化的形势依然比较严峻,玛多县、曲麻莱县、称多县北部和治多县东南部草地退化最明显。三江源生态工程自实施以来,草地恢复态势及现状分析对归纳总结三江源生态保护与建设一期工程的成功经验和基本教训,以及合理指导二期工程的实施具有重要的科学意义。
徐新良 , 王靓 , 李静 , 蔡红艳 . 三江源生态工程实施以来草地恢复态势及现状分析[J]. 地球信息科学学报, 2017 , 19(1) : 50 -58 . DOI: 10.3724/SP.J.1047.2017.00050
The implementation of ecological conservation and construction projects in the “Three-River Headwaters” region had a positive impact on its ecological environment. Through comparative analysis of remote sensing images in 2004 and 2012, the dataset of changes in degraded grassland after the implementation of ecological projects was acquired. Based on the dataset, we analyzed the grassland restoration trend and degradation situation in the “Three-River Headwaters” region. The results showed that the grassland presented a meliorated status at various degrees and the grassland situation improved obviously in local areas during 2004-2012 compared to the grassland degradation status in early time period of 1990-2004. The grassland degradation trend in counties of “Three-River Headwaters” region had been controlled during 2004-2012. Slight and obvious improvement dominated in all counties while occurring and intensified degradation took place in few counties. Compared with the degradation grassland area in 2004, the degradation grassland area in 2012 decreased by 5.78%, among which moderate degradation grassland decreased most obviously by 5.35%. There was a severe degradation in the source region of the Yellow River and the Yangtze River, including Maduo, Qumarlêb, southern Chindu, and southwestern Zhidoi. Analysis of the grassland restoration trend and degradation status in the “Three-River Headwaters” region after the implementation of ecological projects can not only summarize successful experience and lessons of the first-stage project, but also provide rational guidance on the implementation of a second-stage ecological project.
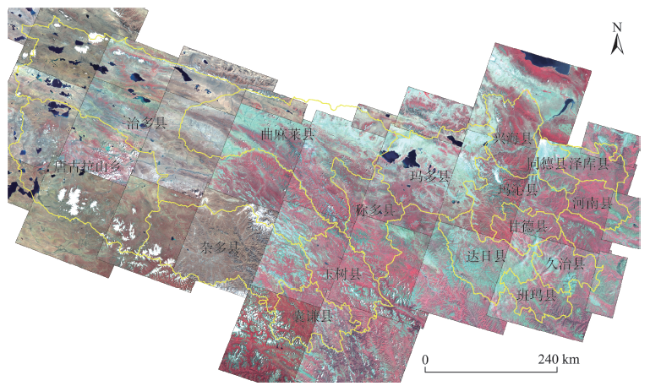
Fig. 1 Landsat TM/ETM images in 2004 in the “Three-River Headwaters” region图1 三江源2004年Landsat TM/ETM遥感影像 |
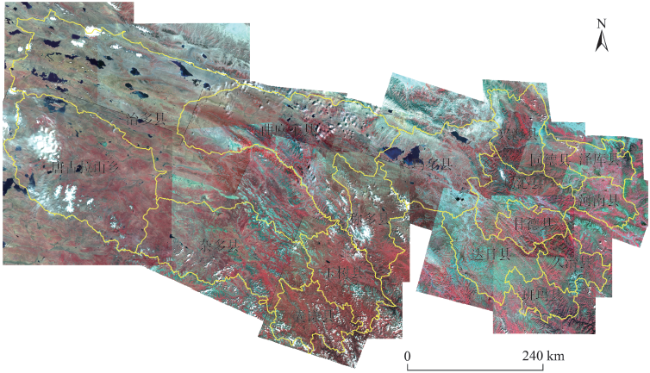
Fig. 2 HJ-1A /1B images in 2012 in the “Three-River Headwaters” region图2 三江源2012年环境小卫星遥感影像 |
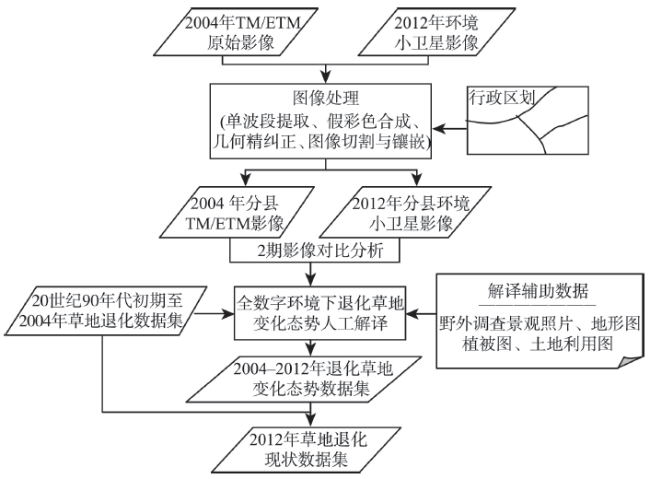
Fig. 3 The technical process of acquiring grasslandchanges in the “Three-River Headwaters” region图3 三江源草地变化信息遥感获取技术流程图 |
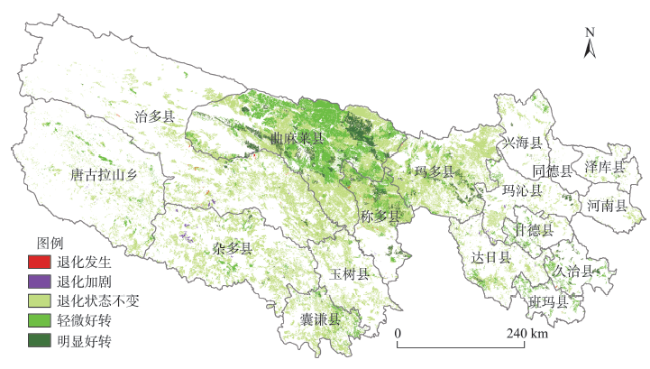
Fig. 4 Distribution of grassland degradation during 2004-2012 in the “Three-River Headwaters” region图4 2004-2012年三江源地区草地退化态势图 |
Tab. 1 Grassland degradation area in each river basin in the “Three-River Headwaters” region during 2004-2014 (km2)表1 2004-2012年三江源地区各流域草地退化面积统计表(km2) |
| 流域名称 | 退化加剧 | 退化发生 | 退化状态不变 | 轻微好转 | 明显好转 |
|---|---|---|---|---|---|
| 黄河流域 | 77.65 | 13.73 | 16 771.3 | 6610.18 | 2535.73 |
| 长江流域 | 206.75 | 86.34 | 30 267.5 | 8763.27 | 1987.22 |
| 澜沧江流域 | 11.59 | 0.00 | 8243.04 | 1304.94 | 104.74 |
| 合计 | 295.99 | 100.07 | 55 281.84 | 16 678.39 | 4627.69 |
Tab. 2 Grassland degradation area in each degeneration zone in the “Three-River Headwaters”region during 2004-2012 (km2)表2 2004-2012年三江源地区各草地退化区草地退化面积统计表(km2) |
| 退化区名称 | 退化发生 | 退化加剧 | 退化状态不变 | 轻微好转 | 明显好转 |
|---|---|---|---|---|---|
| 1区 东部八县草地小范围轻度连续退化区 | 4.63 | 40.02 | 3361.87 | 2214.78 | 574.18 |
| 2区 玛多南部、达日全县草地中等范围中轻度持续退化区 | 0.24 | 21.17 | 3836.46 | 641.45 | 141.41 |
| 3区 玛多北部、称多北部、曲麻莱大部草地大范围中度持续退化沙化区 | 38.29 | 30.89 | 23 142.20 | 15 858.26 | 4311.49 |
| 4区 称多南部、玉树、囊谦、杂多东部草地中等范围中轻度连续退化区 | 1.25 | 19.74 | 8618.43 | 1256.83 | 236.34 |
| 5区 治多中东部、曲麻莱南端较大范围轻中度持续退化区 | 47.64 | 56.29 | 10 667.48 | 289.37 | 106.73 |
| 6区 杂多中西部、唐古拉山乡东部草地中小范围轻度退化局部好转区 | 0.00 | 119.82 | 6513.78 | 997.01 | 47.44 |
| 7区 治多西部、唐古拉山乡中西部草地小范围轻度连续荒漠化区 | 13.87 | 9.52 | 4040.88 | 558.47 | 8.14 |
| 合计 | 105.92 | 297.45 | 60 181.10 | 21 816.17 | 5425.73 |
Tab. 3 Grassland degradation area in each county in the “Three-River Headwaters” region during 2004-2012 (km2)表3 2004-2012年三江源地区各县草地退化面积统计表(km2) |
| 县名 | 退化发生 | 退化加剧 | 退化状态不变 | 轻微好转 | 明显好转 |
|---|---|---|---|---|---|
| 治多县 | 59.44 | 55.63 | 10 750.96 | 362.82 | 106.74 |
| 曲麻莱县 | 0.00 | 5.65 | 13 176.11 | 13 024.88 | 3273.66 |
| 兴海县 | 0.00 | 0.00 | 693.73 | 179.00 | 18.14 |
| 唐古拉山乡 | 2.07 | 9.52 | 3223.77 | 784.33 | 8.83 |
| 玛多县 | 2.34 | 7.81 | 9360.88 | 1226.90 | 558.67 |
| 同德县 | 0.00 | 0.00 | 36.89 | 10.93 | 1.87 |
| 泽库县 | 0.00 | 0.00 | 357.97 | 85.11 | 14.04 |
| 玛沁县 | 0.00 | 36.73 | 1361.06 | 278.03 | 162.86 |
| 称多县 | 37.20 | 33.00 | 4965.95 | 1956.67 | 706.73 |
| 河南 | 0.00 | 0.00 | 353.92 | 4.30 | 7.63 |
| 杂多县 | 0.00 | 123.68 | 7511.86 | 834.93 | 69.82 |
| 甘德县 | 0.00 | 0.00 | 432.45 | 490.87 | 76.15 |
| 达日县 | 0.24 | 20.69 | 1807.78 | 403.14 | 63.34 |
| 玉树县 | 0.00 | 0.00 | 2863.39 | 189.81 | 19.23 |
| 久治县 | 3.75 | 3.29 | 110.03 | 602.25 | 218.79 |
| 班玛县 | 0.88 | 0.00 | 15.58 | 564.28 | 74.70 |
| 囊谦县 | 0.00 | 1.45 | 3159.16 | 818.58 | 44.54 |
| 合计 | 105.92 | 297.45 | 60 181.49 | 21 816.83 | 5425.74 |
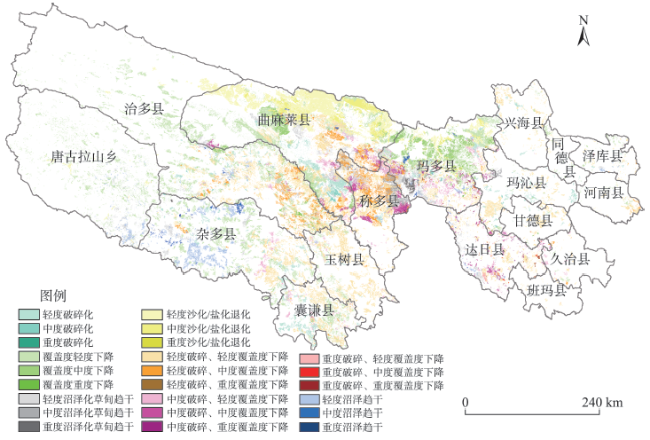
Fig. 5 Spatial pattern of grassland degradation in the “Three-River Headwaters” region in 2012图5 2012年三江源地区草地退化现状空间格局 |
Tab. 4 Comparison among grassland areas at different degradation degree in the “Three-River Headwaters” region表4 三江源地区草地退化程度面积统计对比 |
| 退化程度 | 20世纪90年代初至2004年 | 2012年退化现状 | 2004-2012年 | |||||
|---|---|---|---|---|---|---|---|---|
| 面积/km2 | 比例/% | 面积/km2 | 比例/% | 面积/km2 | 比例/% | |||
| 轻度退化 | 55 724.05 | 23.93 | 54 948.62 | 23.60 | -775.43 | -0.33 | ||
| 中度退化 | 27 347.79 | 11.74 | 14 874.46 | 6.39 | -12 473.33 | -5.35 | ||
| 重度退化 | 1030.82 | 0.44 | 809.95 | 0.35 | -220.87 | -0.09 | ||
| 合计 | 84 102.66 | 36.08 | 70 633.03 | 30.30 | -13 469.63 | -5.78 | ||
Tab. 5 Grassland degradation area in each county in the “Three-River Headwaters” region表5 三江源地区各县草地退化面积统计表 |
| 县 | 20世纪90年代初至2004年 | 2012年退化现状 | 2004-2012年变化 | |||||
|---|---|---|---|---|---|---|---|---|
| 面积/km2 | 比例/% | 面积/km2 | 比例/% | 面积/km2 | 比例/% | |||
| 班玛县 | 655.37 | 14.85 | 6345.58 | 0.90 | 5690.21 | -13.95 | ||
| 称多县 | 7503.58 | 63.58 | 14 588.30 | 41.32 | 7084.72 | -22.26 | ||
| 达日县 | 2201.24 | 20.45 | 14 486.73 | 14.00 | 12 285.49 | -6.45 | ||
| 甘德县 | 1002.07 | 19.97 | 7101.75 | 7.20 | 6099.68 | -12.77 | ||
| 河南县 | 359.89 | 6.85 | 6687.70 | 5.30 | 6327.81 | -1.55 | ||
| 久治县 | 938.28 | 15.52 | 8255.90 | 2.79 | 7317.62 | -12.73 | ||
| 玛多县 | 10 565.78 | 55.42 | 24 450.29 | 41.70 | 13 884.51 | -13.72 | ||
| 玛沁县 | 1848.35 | 23.70 | 13 471.37 | 10.78 | 11 623.02 | -12.92 | ||
| 囊谦县 | 4025.00 | 44.58 | 12 072.35 | 26.63 | 8047.35 | -17.95 | ||
| 曲麻莱县 | 29 322.30 | 81.41 | 46 665.10 | 43.95 | 17 342.80 | -37.46 | ||
| 唐古拉山乡 | 3546.84 | 13.88 | 47 703.41 | 6.89 | 44 156.57 | -6.99 | ||
| 同德县 | 191.06 | 6.10 | 4589.61 | 3.89 | 4398.55 | -2.21 | ||
| 兴海县 | 890.89 | 10.60 | 12 106.10 | 5.73 | 11 215.21 | -4.87 | ||
| 玉树县 | 3045.66 | 27.22 | 15 316.77 | 19.03 | 12 271.11 | -8.19 | ||
| 杂多县 | 6489.90 | 27.14 | 35 436.80 | 21.64 | 28 946.90 | -5.50 | ||
| 泽库县 | 382.69 | 7.02 | 6697.97 | 5.52 | 6315.28 | -1.50 | ||
| 治多县 | 11 133.76 | 27.66 | 80 670.88 | 13.55 | 69 537.12 | -14.11 | ||
The authors have declared that no competing interests exist.
| [1] |
[
|
| [2] |
|
| [3] |
[
|
| [4] |
[
|
| [5] |
[
|
| [6] |
[
|
| [7] |
|
| [8] |
|
| [9] |
|
| [10] |
|
| [11] |
[
|
| [12] |
[
|
| [13] |
[
|
| [14] |
[
|
| [15] |
[
|
| [16] |
[
|
| [17] |
[
|
| [18] |
[
|
| [19] |
[
|
/
| 〈 |
|
〉 |