
不同植被红边指数在城市草地健康判别中的对比研究
作者简介:方灿莹(1993-), 女, 福建漳州人, 硕士生, 主要从事城市化及其环境影响评价研究。E-mail: 1158985715@qq.com
收稿日期: 2017-05-24
要求修回日期: 2017-08-04
网络出版日期: 2017-10-20
基金资助
国家自然科学基金项目(41501469)
福建省测绘地理信息局项目(2017JX02)
A Comparative Study of Different Red Edge Indices for Remote Sensing Detection of Urban Grassland Health Status
Received date: 2017-05-24
Request revised date: 2017-08-04
Online published: 2017-10-20
Copyright
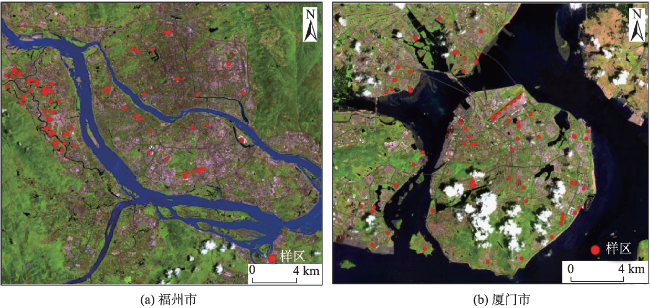
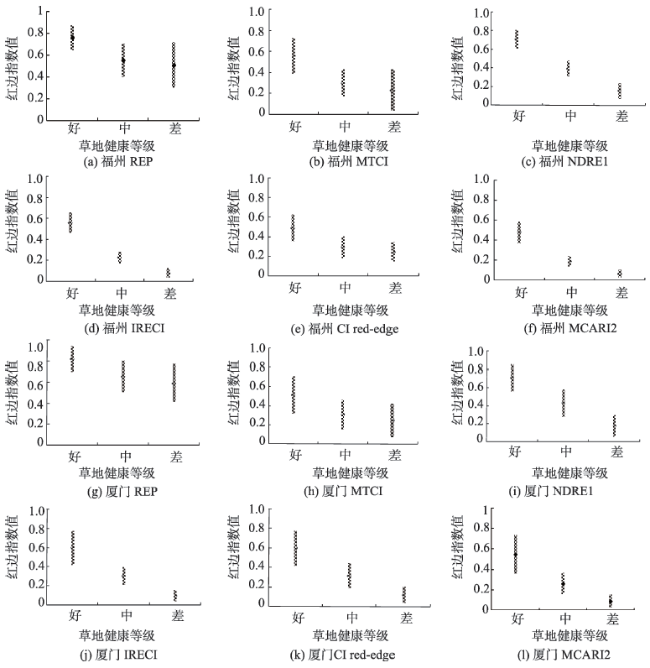
遥感红边指数与表征绿色植物生长状况的重要生化参数有密切的关系,是植被长势监测的重要因子。为寻找出最适用于城市草地生长状况监测的红边指数,本文基于Sentinel-2A数据,对比分析了不同红边指数在城市草地健康状况估算方面的差异。本文以福州市和厦门市的城市草地为例,在全面分析各种健康水平草地光谱响应特征差异的基础上,选取了6种与草地生化参数相关的红边指数,即红边位置REP、地面叶绿素指数MTCI、归一化差值红边指数NDRE1、新型倒红边叶绿素指数IRECI、红边叶绿素指数CIred-edge以及叶绿素吸收指数MCARI2,然后采用独立样本T检验及欧式距离对这6种红边指数在草地健康判别中的优劣进行了定量对比。结果表明:IRECI指数对草地健康状况最为敏感,该指数在不同健康等级草地的值域区间和均值都存在显著性差异,其判别总精度均大于85%;NDRE1和MCARI2指数次之,其他3个指数则难以判别草地的健康状况。因此,在基于Sentinel-2A影像的城市草地健康遥感判别中,推荐使用IRECI指数。
关键词: 遥感; Sentinel-2A影像; 红边波段; 红边指数; 草地健康
方灿莹 , 王琳 , 徐涵秋 . 不同植被红边指数在城市草地健康判别中的对比研究[J]. 地球信息科学学报, 2017 , 19(10) : 1382 -1392 . DOI: 10.3724/SP.J.1047.2017.01382
Being an important part of the green space system, urban grassland has played a significant role in landscaping environment, regulating microclimate and preventing soil from erosion. Therefore, it is of great importance to monitor the health status of urban grassland timely and efficiently. Remote sensing technique has been widely used for assessing vegetation growth status for decades. Numerous studies have found that red edge indices are closely related to the important biochemical parameters of green plants. Thus, they can be regarded as important indicators for monitoring health status of vegetation. However, there is no explicit conclusion about which index is more suitable for monitoring the health status of urban grasslands among the existing red edge indices. The European Sentinel-2A satellite was successfully launched in late June 2015, aiming to replace and improve the old generation of satellite sensors of high resolution (i.e. Landsat and SPOT), with improved spectral capabilities. The multispectral instrument (MSI) of Sentinel-2 has made available a set of 13 spectral bands ranging from visible (VIS) and near infrared (NIR) to shortwave infrared (SWIR), featuring four bands at 10 m, six bands at 20 m, and three bands at 60 m of spatial resolution. In comparison to the previous sensors, Sentinel-2 incorporates three new spectral bands in the red-edge region centered at 705, 740 and 783 nm, providing an opportunity for assessing red-edge spectral indices for monitoring the health status of urban grasslands. For this reason, the main objective of this paper is to find a red edge index that is more suitable for evaluating the growth status of urban grassland based on Sentinel-2A sensor data. Taking the urban grasslands in Fuzhou and Xiamen cities, Southeastern China, as examples, we firstly investigated the spectral responsive characteristics of grasslands in different health status using Sentinel-2A images dated on June 23, 2016 and August 22, 2016, respectively for Fuzhou and Xiamen. On this basis, six red edge indices related to grassland chlorophyll content were then selected to test their efficiency in detecting grassland health status. These are the red edge position (REP), the terrestrial chlorophyll index (MTCI), the normalized difference red edge index (NDRE1), the novel inverted red-edge chlorophyll index (IRECI), the red-edge chlorophyll index (CIred-edge) and the modified chlorophyll absorption ratio index (MCARI2). Furthermore, independent sample T test and Euclidean distance methods were employed to evaluate the performance of the selected indices in the detection of grassland health status. Results showed that the six red edge indices had different performances. They have different degrees of sensitivity to the changes of grassland health status. In general, the IRECI was the most sensitive to the grassland health status among the six indices in the two study areas. The index can reveal significant differences in the numerical range and mean values between grasslands with different health status. The overall accuracy of the index is greater than 85% with a kappa coefficient exceeding 0.8 both in Fuzhou and Xiamen cases. The NDRE1 and MCARI2 indices ranked the second and third, while the other three indices were unable to effectively detect the health status of the grasslands. Accordingly, the IRECI is the optimal red edge index for evaluating the grassland health status using Sentinel-2A imagery.
Key words: remote sensing; Sentinel-2A; red-edge bands; red edge index; grassland health
Fig. 1 Sentinel-2A images of Fuzhou and Xiamen (Red dots are the sample locations)图1 福州市和厦门市Sentinel-2A影像(红点为草地样区) |
Tab. 1 The main parameters of multi-spectral bands of Sentinel-2A表1 Sentinel-2A影像多光谱波段主要参数信息 |
| 波段号 | 波段 | 中心波长/nm | 波段宽度/nm | 空间分辨率/m |
|---|---|---|---|---|
| 1 | Coastal | 443 | 20 | 60 |
| 2 | Blue | 490 | 65 | 10 |
| 3 | Green | 560 | 35 | 10 |
| 4 | Red | 665 | 30 | 10 |
| 5 | Red edge | 705 | 15 | 20 |
| 6 | 740 | 15 | 20 | |
| 7 | 783 | 20 | 20 | |
| 8 | NIR-1 | 842 | 115 | 10 |
| 8b | NIR-2 | 865 | 20 | 20 |
| 9 | Water vapor | 945 | 20 | 60 |
| 10 | Cirrus | 1375 | 30 | 60 |
| 11 | MIR-1 | 1610 | 90 | 20 |
| 12 | MIR-2 | 2190 | 180 | 20 |
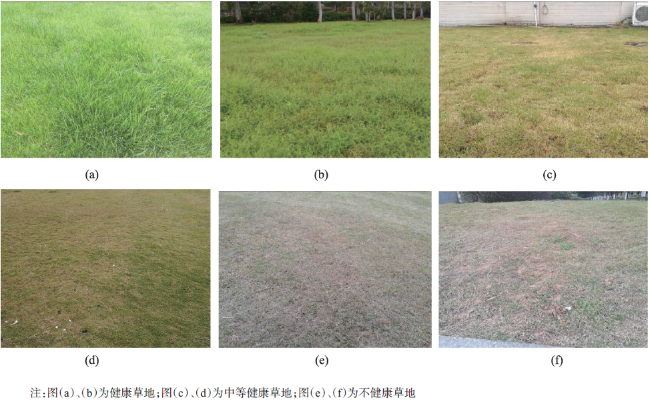
Fig. 2 Grasslands in different health status图2 不同健康等级的草地 |
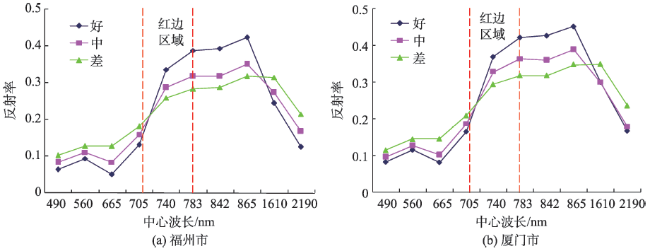
Fig. 3 Spectral signatures of grasslands in different health status图3 不同健康等级草地的光谱曲线 |
Tab. 2 Red edge indices and their calculation formulas表2 红边指数及其计算公式 |
| 指数 | 计算公式 | 对应的Sentinel-2A波段 | 描述 | 参考文献 |
|---|---|---|---|---|
| REP | REP=705+35×(0.5×(ρ665+ ρ783)-ρ705)/(ρ740-ρ705) | B4、B7、B5、B6 | 红边范围内植被反射光谱曲线斜率最大的位置。当植物叶片的叶绿素含量增加时,REP向长波方向移动,反之则向短波方向移动[25] | Guyot等[25] |
| MTCI | MTCI = (ρ753.75-ρ708.75)/(ρ708.75-ρ681.25) | B6、B5、B4 | 对植物叶片叶绿素含量较为敏感,其值越大代表叶绿素含量越高[12] | Dash等[12] |
| NDRE1 | NDRE1= (ρ750-ρ705)/(ρ750+ρ705) | B6、B5 | NDRE1是用红边的峰和谷来代替传统NDVI中的红光和近红外波段,可用于估算植物叶面积指数和叶绿素含量[13] | Gitelson等[27] |
| IRECI | IRECI = (ρ783-ρ665)/(ρ705/ρ740) | B7、B4、B5、B6 | 该指数与植物冠层叶绿素含量和叶面积指数具有很好的相关关系,可定量表征植物的叶绿素含量[26] | Frampton等[26] |
| CIred-edge | CI red-edge= (ρ750-800/ρ690-725)-1 | B7、B5 | 该指数与植物叶绿素,氮素含量具有显著的线性关系[27-28] | Gitelson等[27-28] |
| MCARI2 | MCARI 2= ((ρ750-ρ705)-0.2× (ρ750-ρ550)) ×(ρ750/ρ705) | B6、B5、B3 | 该指数对植物中的叶绿素含量较为敏感,其值越大表示叶绿素含量越高[14] | Wu等[14] |
Tab. 3 p-values of independent-sample T test of red edge indices in different health status表3 不同健康等级下红边指数的p值 |
| p值 | REP | MTCI | NDRE1 | IRECI | CIred-edge | MCARI2 | |
|---|---|---|---|---|---|---|---|
| 福州市 | 好-中 | 0.000** | 0.000** | 0.000** | 0.000** | 0.000** | 0.000** |
| 好-差 | 0.000** | 0.000** | 0.000** | 0.000** | 0.000** | 0.000** | |
| 中-差 | 0.174 | 0.011* | 0.000** | 0.000** | 0.013* | 0.000** | |
| 厦门市 | 好-中 | 0.001** | 0.000** | 0.000** | 0.000** | 0.000** | 0.000** |
| 好-差 | 0.000** | 0.000** | 0.000** | 0.000** | 0.000** | 0.000** | |
| 中-差 | 0.012* | 0.016* | 0.000** | 0.000** | 0.000** | 0.000** |
注:**代表通过1%显著性检验;*代表通过5%显著性检验 |
Fig. 4 The data range (mean±1 standard deviation) of red edge indices in different health status of grasslands图4 不同健康等级草地的红边指数值域区间(均值±1标准差) |
Tab. 4 The statistics table of Euclidean distance表4 欧式距离统计 |
| 红边指数 | 好-中 | 排序 | 中-差 | 排序 | 好-差 | 排序 | 总欧式距离 | 综合排序 | |
|---|---|---|---|---|---|---|---|---|---|
| 福州市 | IRECI | 2.97 | 1 | 2.11 | 1 | 4.49 | 1 | 9.57 | 1 |
| NDRE1 | 2.43 | 3 | 2.01 | 2 | 4.37 | 2 | 8.81 | 2 | |
| MCARI2 | 2.46 | 2 | 1.91 | 3 | 3.67 | 3 | 8.04 | 3 | |
| CIred-edge | 1.13 | 5 | 0.33 | 4 | 1.47 | 4 | 2.93 | 4 | |
| MTCI | 1.23 | 4 | 0.29 | 5 | 1.26 | 5 | 2.78 | 5 | |
| REP | 1.12 | 6 | 0.18 | 6 | 1.07 | 6 | 2.37 | 6 | |
| 厦门市 | IRECI | 1.49 | 1 | 1.93 | 1 | 2.71 | 2 | 6.13 | 1 |
| MCARI2 | 1.35 | 2 | 1.45 | 2 | 2.64 | 3 | 5.44 | 2 | |
| NDRE1 | 1.32 | 3 | 1.29 | 3 | 2.81 | 1 | 5.42 | 3 | |
| CIred-edge | 1.29 | 4 | 1.29 | 4 | 2.32 | 4 | 5.00 | 4 | |
| REP | 0.88 | 5 | 0.27 | 5 | 1.06 | 5 | 2.21 | 5 | |
| MTCI | 0.82 | 6 | 0.26 | 6 | 1.01 | 6 | 2.09 | 6 |
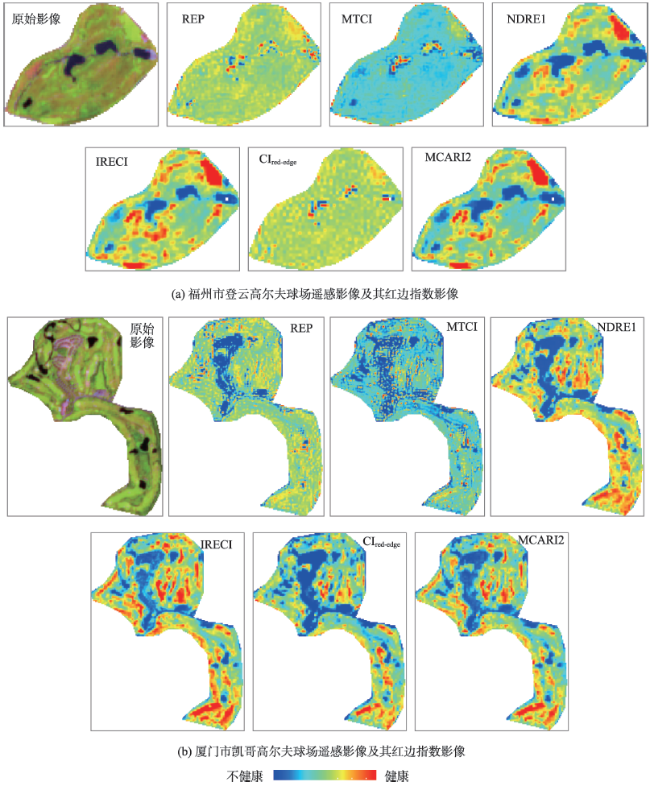
Fig. 5 Sentinel-2A images of golf courses in Fuzhou and Xiamen and their corresponding images of red edge indices图5 福州市和厦门市高尔夫球场的遥感影像及其红边指数影像 |
Tab. 5 Accuracy validation of the health grade of grasslands表5 草地健康等级判别精度验证 |
| 指数类型 | 福州市 | 厦门市 | |||
|---|---|---|---|---|---|
| 总精度/% | Kappa系数 | 总精度/% | Kappa系数 | ||
| REP | 62.12 | 0.4311 | 67.83 | 0.5195 | |
| MTCI | 69.70 | 0.5480 | 63.16 | 0.4478 | |
| NDRE1 | 87.37 | 0.8103 | 83.62 | 0.7647 | |
| IRECI | 91.41 | 0.8909 | 89.47 | 0.8419 | |
| CIred-edge | 74.24 | 0.6167 | 83.04 | 0.7457 | |
| MCARI2 | 85.86 | 0.7876 | 84.79 | 0.7716 | |
The authors have declared that no competing interests exist.
| [1] |
[
|
| [2] |
[
|
| [3] |
[
|
| [4] |
[
|
| [5] |
|
| [6] |
|
| [7] |
|
| [8] |
|
| [9] |
|
| [10] |
[
|
| [11] |
[
|
| [12] |
|
| [13] |
|
| [14] |
|
| [15] |
[
|
| [16] |
|
| [17] |
|
| [18] |
[
|
| [19] |
ESA. Sentinel-2 User Handbook [EB/OL]. (2015-07-24) [2017-04-08].
|
| [20] |
ESA. Sentinel-2 MSI - Level-2A Prototype Processor Installation and User Manual [EB/OL]. (2016-04-13) [2017-04-08]. .
|
| [21] |
ESA. Sentinel-2 technical guides [EB/OL].[2017-04-08]. https://sentinels.copernicus.eu/web/sentinel/technical-guid-es/sentinel-2-msi.
|
| [22] |
|
| [23] |
|
| [24] |
|
| [25] |
|
| [26] |
|
| [27] |
|
| [28] |
|
| [29] |
[
|
| [30] |
|
| [31] |
Clevers J G P W,
|
| [32] |
|
| [33] |
|
/
| 〈 |
|
〉 |