
利用多源城市数据划定地铁站点吸引范围
|
谭佩珊(1996— ),女,广东中山人,硕士生,主要从地铁交通研究。E-mail: 970733211@qq.com |
收稿日期: 2020-04-16
要求修回日期: 2020-09-09
网络出版日期: 2021-06-25
基金资助
广东省自然科学基金项目(2019A1515011049)
深圳市科技创新委员会研究项目(JCYJ20180305125113883)
深圳市科技创新委员会研究项目(JCYJ20170412105839839)
版权
Identifying the Catchment Area of Metro Stations Using Multi-Source Urban Data
Received date: 2020-04-16
Request revised date: 2020-09-09
Online published: 2021-06-25
Supported by
Natural Science Foundation of Guangdong Province(2019A1515011049)
The Basic Research Program of Shenzhen Science and Technology Innovation Committee(JCYJ20180305125113883)
The Basic Research Program of Shenzhen Science and Technology Innovation Committee(JCYJ20170412105839839)
Copyright
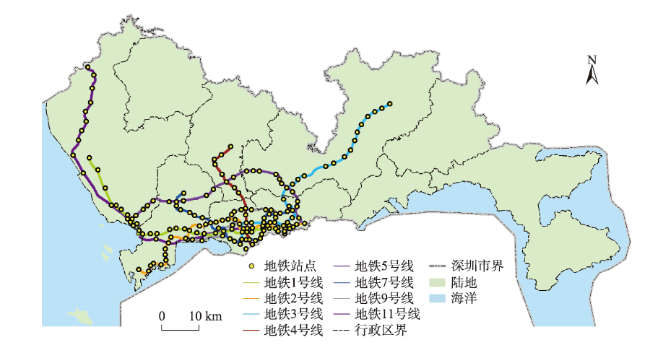
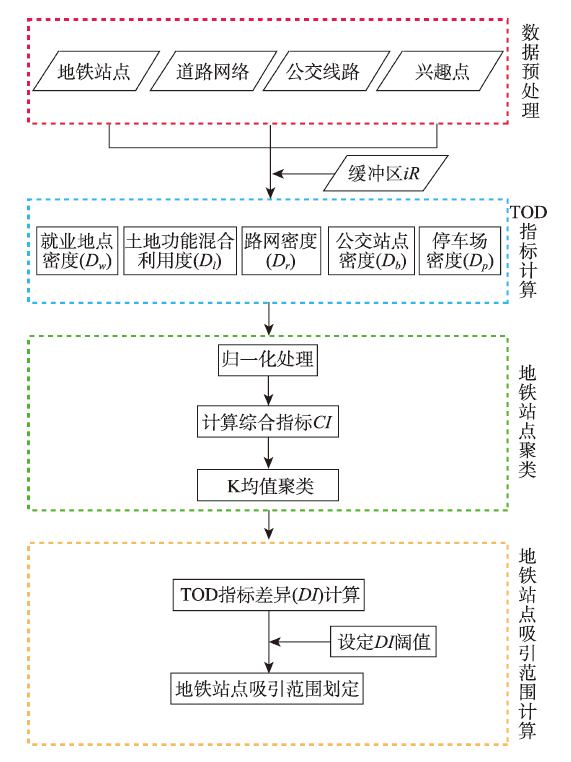
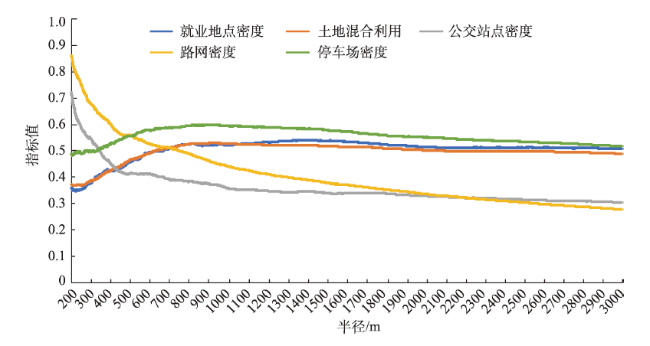
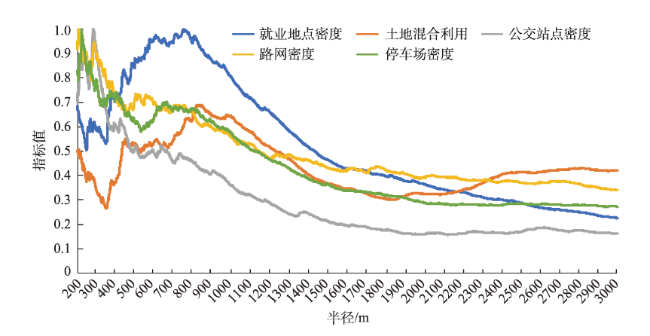
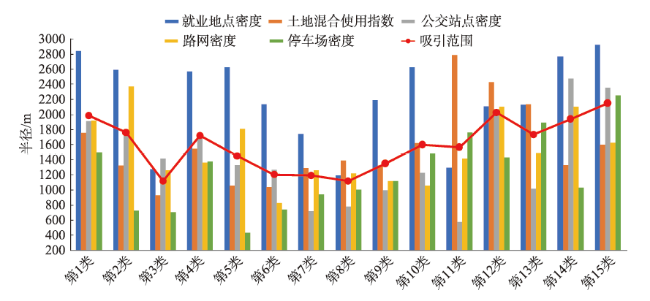
随着时代的发展,世界城市规模不断扩大,各大城市的交通需求陡然增加,而地面出行所带来的堵塞和环保问题导致政府部门把目光转向地下交通发展,其中地铁是地下交通发展中最重要的交通工具。准确划定地铁站点吸引范围,分析影响地铁站点吸引范围主要因素,不仅对于优化地铁交通服务和规划地铁周边建成环境具有重要意义,同时对于新建地铁站点设施规划具有参考价值。传统的地铁吸引范围划定方法大多依赖于居民日常出行活动的调查和经验意见,存在时间周期长且耗费巨大和吸引范围划定不准确的问题;而多源城市数据的涌现为量化地铁站点周边建成环境及客流空间分布、合理划定地铁站点提供了全新的解决方案。TOD(Transit Oriented Development,TOD)是高密度城市(如深圳、北京等)寻求的城市和交通和谐发展的重要选择,也是未来交通建设的主要参考理念。因此,从公共交通导向的开发视角出发,本文利用2017年的兴趣点、道路网络、公共交通线路等多源城市数据刻画地铁站点周围的TOD信息指标,利用K均值聚类进行地铁站点聚类,结合TOD指标的空间变化趋势,确定深圳市不同类型地铁站点的吸引范围。研究结果表明:① 基于TOD密度指标划定的地铁站点吸引范围能够揭示地铁站点的吸引范围的差异,且就业地点密度和土地混合利用度对地铁站点吸引范围的影响较大; ② 与城市非中心区域相比,城市中心区域的地铁站点吸引半径较小但出行需求较高,其凸显了地铁站点规划在空间服务密度和居民出行需求之间的取得均衡;③ 深圳市地铁站点吸引范围重叠与城市区域发展程度相关程度较高,可为利用现有地铁站点空间覆盖,发展城市功能集中区域提供参考。

谭佩珊 , 麦可 , 张亚涛 , 涂伟 . 利用多源城市数据划定地铁站点吸引范围[J]. 地球信息科学学报, 2021 , 23(4) : 593 -603 . DOI: 10.12082/dqxxkx.2021.200183
With the development of the times, the scale of the world's cities is expanding, and the traffic demand of major cities has sharply increased. Traffic congestion and environmental problems caused by road transportation have led governmental departments to turn to underground transportation. The metro is the most important means for underground transportation. Identifying the catchment area of a metro station is essential for evaluating and improving metro system service and its surrounding built environment, which provides important reference for optimizing metro resources and planning new metro facilities. Traditional methods of identifying the catchment area of a metro station mostly depend on the investigation of residents' daily travel, which is usually time-intensive and labor-consuming and causes uncertainties in catchment area. The emergence of multi- source urban data provides a new solution to quantify the surrounding built environment and spatial distribution of passenger flow, which allows for a reasonable delineation of catchment areas. Transit Oriented Development (TOD) is an important choice for the harmonious development of cities and transportation in high-density cities (e.g.Shenzhen, Beijing, etc.). From the perspective of TOD, this paper presents a data-driven method to outline the catchment area of the metro station. We used multi-source urban data in 2017 in Shenzhen city including road network, bus routes, point of interest, etc.,to characterize the TOD around metro stations. Then these metro stations were spatially clustered, and their catchment areas were computed according to the trend of the TOD indices. The TOD-based catchment area of metro stations can vary across space. The results show that: (1) the proposed method captured the difference in catchment areas around different metro stations. The employment density and mixed land use played the most important role; (2) compared with suburbs, the catchment radius of metro stations in the central urban area was relatively smaller but represented higher travel demand, which indicated that the metro planning should better balance its service coverage and urban travel demand; and (3) the overlap of catchment areas in Shenzhen coincides with the well- developed areas, which inspire us that building up new metro stations could accelerate the development of surrounding areas.
表1 2017年地铁站点聚类结果Tab. 1 The clustering result of metro stations in 2017 |
| 类别 | 数量/个 | 类别 | 数量/个 | 类别 | 数量/个 |
|---|---|---|---|---|---|
| 第1类 | 4 | 第6类 | 3 | 第11类 | 1 |
| 第2类 | 1 | 第7类 | 49 | 第12类 | 2 |
| 第3类 | 8 | 第8类 | 31 | 第13类 | 4 |
| 第4类 | 7 | 第9类 | 36 | 第14类 | 2 |
| 第5类 | 2 | 第10类 | 14 | 第15类 | 3 |
表2 2017年深圳地铁站点的吸引半径和方差Tab. 2 The attraction radius and variance of Shenzhen metro stations with different threshold in 2017 |
| 类别 | DI阈值 | ||||
|---|---|---|---|---|---|
| 0.01 | 0.02 | 0.03 | 0.04 | 0.05 | |
| 第1类 | 1987 | 1227 | 902 | 902 | 662 |
| 第2类 | 1761 | 1349 | 920 | 920 | 711 |
| 第3类 | 1119 | 744 | 539 | 539 | 453 |
| 第4类 | 1722 | 1142 | 929 | 929 | 716 |
| 第5类 | 1451 | 1036 | 929 | 759 | 518 |
| 第6类 | 1203 | 856 | 759 | 593 | 525 |
| 第7类 | 1191 | 753 | 593 | 560 | 474 |
| 第8类 | 1117 | 712 | 712 | 531 | 439 |
| 第9类 | 1352 | 880 | 880 | 649 | 540 |
| 第10类 | 1603 | 1011 | 1011 | 768 | 643 |
| 第11类 | 1568 | 983 | 983 | 774 | 374 |
| 第12类 | 2028 | 859 | 859 | 782 | 368 |
| 第13类 | 1735 | 996 | 996 | 737 | 625 |
| 第14类 | 1942 | 1144 | 1144 | 701 | 569 |
| 第15类 | 2152 | 1374 | 1374 | 1059 | 782 |
| 15类吸引半径方差 | 335.4 | 203.3 | 199.4 | 152.2 | 122.8 |
| 全市域地铁站点 | 1595 | 1004 | 902 | 747 | 560 |
| [1] |
|
| [2] |
|
| [3] |
|
| [4] |
|
| [5] |
|
| [6] |
王淑伟, 孙立山, 荣建. 北京市轨道站点吸引范围研究[J]. 交通运输系统工程与信息, 2013,13(3):183-188.
[
|
| [7] |
|
| [8] |
|
| [9] |
陆化普, 朱军. 城市轨道交通规划的研究与实践[M]. 北京: 中国水利出版社, 2001.
[
|
| [10] |
|
| [11] |
|
| [12] |
|
| [13] |
周慧, 靳凤娟. TOD在开放性大学校园规划中的应用——以湖南大学为例[J]. 中外建筑, 2011(1):85-86.
[
|
| [14] |
|
| [15] |
|
| [16] |
|
| [17] |
|
| [18] |
|
| [19] |
龙瀛, 周垠. 街道活力的量化评价及影响因素分析——以成都为例[J]. 新建筑, 2016(1):52-57.
[
|
| [20] |
李清泉. 从Geomatics到Urban Informatics[J]. 武汉大学学报·信息科学版, 2017,42(1):1-6.
[
|
| [21] |
|
| [22] |
|
| [23] |
|
| [24] |
曹瑞, 涂伟, 巢佰崇, 等. 基于智能卡数据的地铁周边职住用地识别与分析[J]. 测绘地理信息, 2016,41(3):74-78.
[
|
| [25] |
|
| [26] |
张晓春, 田锋, 吕国林, 邵源. 深圳市TOD框架体系及规划策略[J]. 城市交通, 2011,9(3):37-44.
[
|
| [27] |
唐炉亮, 牛乐, 杨雪, 等. 利用轨迹大数据进行城市道路交叉口识别及结构提取[J]. 测绘学报, 2017,46(6):770-779.
[
|
| [28] |
孔令彦, 关丽, 丁燕杰, 等. 空间大数据支持下的城市区域评估及其关键技术[J]. 测绘通报, 2017(8):100-105.
[
|
| [29] |
单杰, 秦昆, 黄长青, 等. 众源地理数据处理与分析方法探讨[J]. 武汉大学学报·信息科学版, 2014,39(4):390-396.
[
|
| [30] |
李清泉, 李德仁. 大数据GIS[J]. 武汉大学学报·信息科学版, 2014,39(6):641-644.
[
|
| [31] |
|
| [32] |
|
| [33] |
|
| [34] |
|
/
| 〈 |
|
〉 |

