
不同测算方法下行程时间不确定性对可达性的影响分析
|
肖中圣(1995- ),男,重庆梁平人,博士研究生,主要从事公共交通与土地利用关系研究。E-mail: 18114047@bjtu.edu.cn |
收稿日期: 2022-04-23
修回日期: 2022-05-16
网络出版日期: 2023-01-25
基金资助
国家自然科学基金项目(71971021)
国家自然科学基金项目(71901022)
The Impact of Travel Time Uncertainty on Accessibility under Different Measurements
Received date: 2022-04-23
Revised date: 2022-05-16
Online published: 2023-01-25
Supported by
National Natural Science Foundation of China(71971021)
National Natural Science Foundation of China(71901022)
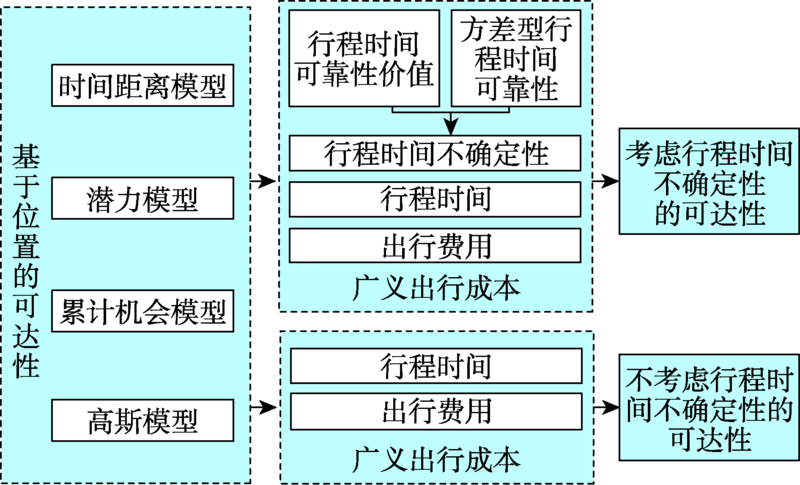
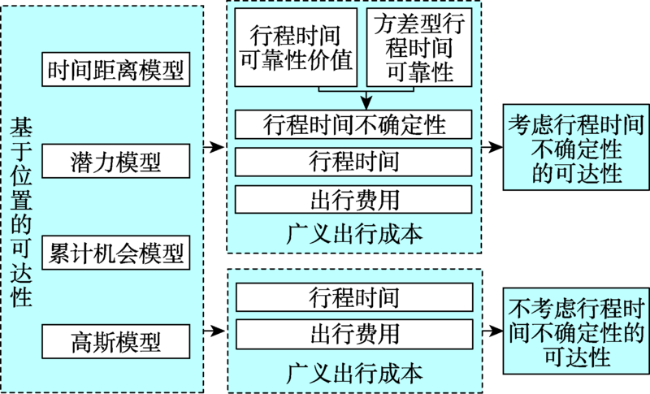
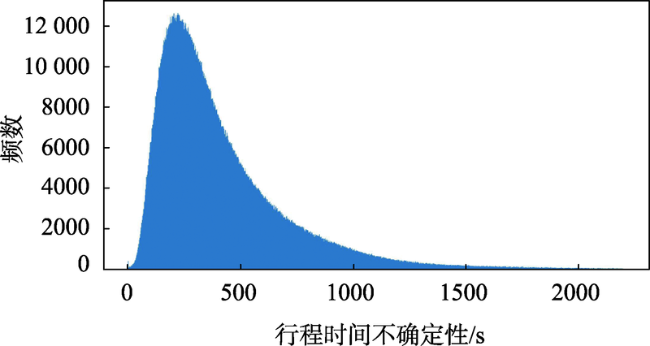
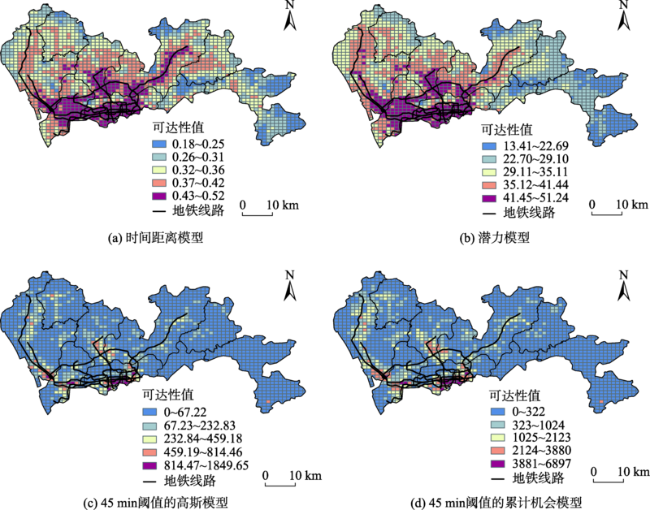
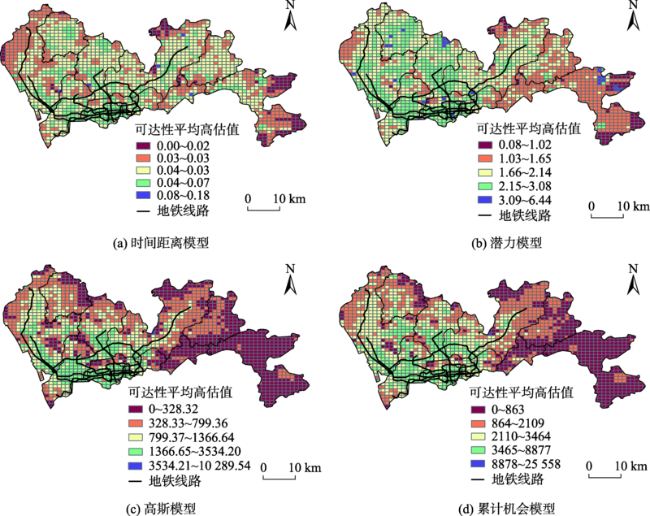
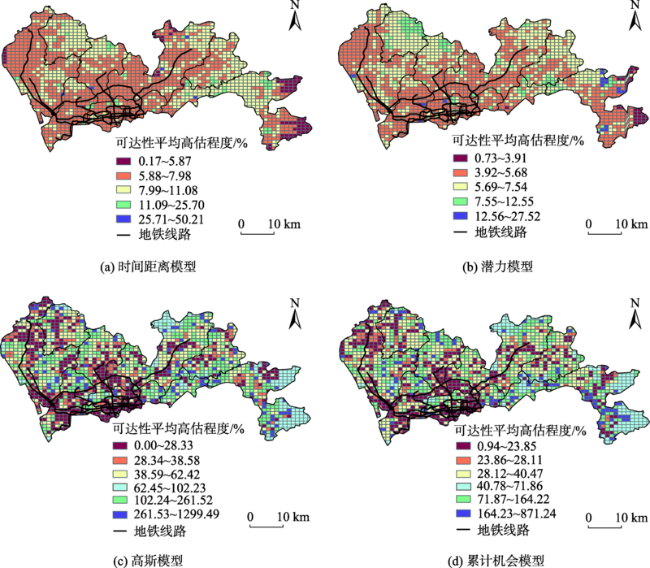
行程时间不确定性导致了可达性随时间的变化,相关研究表明忽略行程时间不确定性会高估可达性水平。既有可达性研究往往用行程时间可靠性表示行程时间不确定性,但未考虑不同可达性模型结果的差异以及行程时间可靠性价值。本文结合各OD之间的行程时间分布特征,构建方差型的行程时间可靠性来描述行程时间不确定性,并进一步将行程时间可靠性纳入到广义出行时间成本中,建立了时间距离模型、潜力模型、累计机会模型和高斯模型4种基于位置的可达性测算方法,以比较在不同测算方法下,行程时间不确定性对可达性的影响。深圳的案例研究表明:① 忽略行程时间不确定性会使全区域的可达性至少被高估5.04%,最大被高估95.04%。潜力模型、时间距离模型、累计机会模型和高斯模型的高估幅度由低到高;② 行程时间不确定性对可达性的影响存在阈值效应,阈值越高,可达性受影响的程度越小;③ 从空间分布来看,行程时间不确定性对可达性水平高和低的区域都有一定影响。若不考虑行程时间不确定性,可达性高的区域高估值大,而在可达性低的区域,可达性高估的百分比较大,高估百分比中位数的差异程度最大可达77.1%;④ 行程时间不确定性对潜力模型可达性分类的影响最小,对累计机会模型差异的影响最大。可达性使用者应充分考虑研究区域实际情况,结合可解释性与理论性偏好,进而选择合适的可达性模型和评判标准。
肖中圣 , 许奇 , 毛保华 , 魏润斌 , 冯佳 . 不同测算方法下行程时间不确定性对可达性的影响分析[J]. 地球信息科学学报, 2022 , 24(11) : 2102 -2114 . DOI: 10.12082/dqxxkx.2022.220219
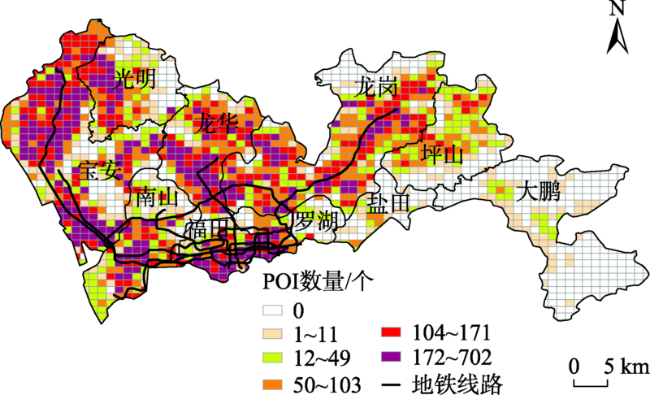
Many scholars have focused on public transit accessibility, as the public transportation system plays more important role in commuting. Travel time uncertainty, which is caused by timetable and traffic condition changes, leads to uncertainty in accessibility. Ignoring travel time uncertainty may cause overestimation of accessibility. This overestimation may bring optimism about travel time to the commuter, and they may not reach their destinations on time. Therefore, it is essential to measure public transit accessibility realistically. Moreover, previous studies often use one measurement to calculate the influence of travel time uncertainty on accessibility and do not consider the differences between measurements. Different measures may be oriented to different infrastructure investment, therefore, understanding the results of different measures is also important. To fill these gaps, we first divided the study area (Shenzhen) into 1854 grids and collected millions of travel dataset and POI dataset from GaoDe Map. Then, this paper developed the travel time reliability by investigating the travel time distribution and standard deviation between OD pairs. We extended the generalized travel cost in accessibility measurements by incorporating travel time reliability. The static accessibility measurements use the generalized travel cost without considering travel time reliability. Furthermore, we developed four types of placed-based accessibility measurements to analyze the differences between accessibility with and without travel time uncertainty. The results in Shenzhen's case showed that travel time uncertainty increased accessibility at least by 5.80%, and at most by 95.04% in the whole area. The order of models from minimum to largest increase was that: the potential model, the time distance model, the cumulative opportunity model, and the Gaussian model. The accessibility of Gaussian model increased by 59%~553%, while the generalized travel cost threshold increased from 45 min to 120 min. Additionally, the impact of travel time uncertainty on accessibility existed threshold effect, the higher threshold, the smaller the degree of reduction. The results indicated that ignoring the travel time uncertainty may underestimate the effect of improving the transit system. From the perspective of spatial patterns, the influence of travel time uncertainty covers the whole region. The value of overestimation was high in the area with a high level of accessibility, the degree of overestimation was high in the area with a low level of accessibility when travel time uncertainty was ignored. The median of overestimation degree can reach 77.1%. The potential model had the minimal variation in accessibility classification and the cumulative model generated the maximum variation. The results provide the insights that users should pay more attention to the impact of travel time uncertainty on accessibility. Additionally, government should take care on the model choice and consider the results of different measurements comprehensively, as different models lead to different decisions.
表1 不同阈值和不同模型下的平均可达性Tab. 1 Mean accessibility under different thresholds and measurements |
| 模型类别 | 是否考虑行程时间 不确定性(Y/N) | 广义出行时间成本阈值/min | |||||
|---|---|---|---|---|---|---|---|
| 45 | 60 | 75 | 90 | 115 | 120 | ||
| 时间距离模型 | Y | 0.3440 | 0.3440 | 0.3440 | 0.3440 | 0.3440 | 0.3440 |
| N | 0.3748 | 0.3748 | 0.3748 | 0.3748 | 0.3748 | 0.3748 | |
| 潜力模型 | Y | 31.92 | 31.92 | 31.92 | 31.92 | 31.92 | 31.92 |
| N | 33.84 | 33.84 | 33.84 | 33.84 | 33.84 | 33.84 | |
| 高斯模型 | Y | 61.43 | 401.46 | 1179.76 | 2490.61 | 4611.32 | 7439.09 |
| N | 112.40 | 569.11 | 1554.64 | 3228.35 | 5722.88 | 9075.45 | |
| 累计机会模型 | Y | 349 | 1685 | 4346 | 8542 | 14 902 | 22 803 |
| N | 581 | 2252 | 5501 | 10 716 | 18 018 | 27 184 | |
表2 阈值变化对可达性增幅的影响Tab. 2 The impact of changes in threshold on accessibility (%) |
| 模型 | 是否考虑行程时间不确定性(Y/N) | 成本阈值/min | ||||
|---|---|---|---|---|---|---|
| 60&45 | 75&60 | 90&75 | 105&90 | 120&105 | ||
| 高斯模型 | Y | 553 | 194 | 111 | 85 | 61 |
| N | 406 | 173 | 108 | 77 | 59 | |
| 累积机会模型 | Y | 382 | 158 | 97 | 74 | 53 |
| N | 288 | 144 | 95 | 68 | 51 | |
表3 忽略行程时间不确定性对可达性的高估百分比Tab. 3 The degree of overestimation on accessibility (%) |
| 模型 | 成本阈值/min | |||||
|---|---|---|---|---|---|---|
| 45 | 60 | 75 | 90 | 115 | 120 | |
| 时间距离模型 | 7.85 | |||||
| 潜力模型 | 5.80 | |||||
| 高斯模型 | 95.04 | 51.19 | 37.67 | 35.11 | 26.54 | 23.58 |
| 累计机会模型 | 59.50 | 32.65 | 26.43 | 25.93 | 20.76 | 19.15 |
表4 存在分类差异的栅格数量Tab. 4 The number of grids with classify difference |
| 模型 | 成本阈值/min | 平均数量/个 | |||||
|---|---|---|---|---|---|---|---|
| 45 | 60 | 75 | 90 | 115 | 120 | ||
| 时间距离模型 | 103 | 103 | |||||
| 潜力模型 | 96 | 96 | |||||
| 高斯模型 | 344 | 338 | 171 | 169 | 236 | 129 | 231 |
| 累计机会模型 | 471 | 293 | 338 | 343 | 166 | 205 | 303 |
表5 存在分类差异的栅格的高估程度Tab. 5 The median degree of overestimation (%) |
| 模型 | 成本阈值/min | |||||
|---|---|---|---|---|---|---|
| 45 | 60 | 75 | 90 | 115 | 120 | |
| 时间距离模型 | 7.51 | |||||
| 潜力模型 | 6.33 | |||||
| 高斯模型 | 150.6 | 50.6 | 27.4 | 47.5 | 27.7 | 29.6 |
| 累计机会模型 | 104.3 | 50.9 | 38.7 | 35.0 | 32.7 | 34.4 |
| [1] |
|
| [2] |
|
| [3] |
|
| [4] |
|
| [5] |
陈杰, 李昂, 符峥, 等. 公交模式对公共服务设施可达性的影响[J]. 地球信息科学学报, 2019, 21(7):983-993.
[
|
| [6] |
|
| [7] |
|
| [8] |
刘炜, 董傲然, 邓雷, 等. 基于网络开放数据的城市公共交通可达性公平测度研究[J]. 武汉理工大学学报(交通科学与工程版), 2021, 45(6):1045-1050.
[
|
| [9] |
|
| [10] |
陈洁, 陆锋, 程昌秀. 可达性度量方法及应用研究进展评述[J]. 地理科学进展, 2007, 26(5):100-110.
[
|
| [11] |
|
| [12] |
|
| [13] |
王亚飞, 袁辉, 陈碧宇, 等. 行程时间不确定环境下地点可达性研究[J]. 武汉大学学报·信息科学版, 2019, 44(11):1723-1729.
[
|
| [14] |
|
| [15] |
|
| [16] |
|
| [17] |
|
| [18] |
Kara,
|
| [19] |
|
| [20] |
|
| [21] |
刘琳琳, 郑伯红, 骆晨. 基于交通大数据的南昌市中心城区等时圈划分及特征分析[J]. 地球信息科学学报, 2022, 24(2):220-234.
[
|
| [22] |
|
| [23] |
|
| [24] |
|
| [25] |
|
| [26] |
|
| [27] |
|
| [28] |
|
| [29] |
熊志华, 姚智胜, 邵春福. 基于路段相关的路网行程时间可靠性[J]. 中国安全科学学报, 2004, 14(10):81-84.
[
|
| [30] |
|
| [31] |
付晓, 李梦瑶, 陆欣, 等. 考虑行程时间不确定性的服务设施时空可达性度量[J]. 交通运输系统工程与信息, 2019, 19(2):86-93.
[
|
| [32] |
|
| [33] |
|
| [34] |
何娇娇, 张勇. 行程时间可靠性及其价值估计分析[J]. 系统工程, 2016, 34(7):110-117.
[
|
| [35] |
|
| [36] |
|
| [37] |
|
| [38] |
|
| [39] |
|
| [40] |
|
| [41] |
|
| [42] |
|
| [43] |
|
| [44] |
许奇, 陈越, 黄靖茹, 等. 考虑出行费用的就业可达性分析[J]. 交通运输系统工程与信息, 2022, 22(2):37-44.
[
|
| [45] |
张天然, 朱春节. 伦敦公共交通可达性分析方法及应用[J]. 城市交通, 2019, 17(1):70-76,13.
[
|
| [46] |
朱宇婷, 刘莹, 许奇, 等. 交通可达性与城市经济活动的空间特征分析:以北京市为例[J]. 交通运输系统工程与信息, 2020, 20(5):226-233.
[
|
/
| 〈 |
|
〉 |