
机载LiDAR点云密度和插值方法对DEM及地表粗糙度精度影响分析
|
贝祎轩(1997— ),女,山东淄博人,硕士生,主要从事数字地形建模研究。E-mail: TGK_Conch@163.com |
收稿日期: 2022-07-07
修回日期: 2022-08-24
网络出版日期: 2023-04-19
基金资助
国家自然科学基金(42271438)
山东省自然科学基金项目(ZR2020YQ26)
山东省自然科学基金项目(ZR2019MD007)
山东省高等学校青创科技支持计划(2019KJH007)
Effects of Airborne LiDAR Point Cloud Density and Interpolation Methods on the Accuracy of DEM and Surface Roughness
Received date: 2022-07-07
Revised date: 2022-08-24
Online published: 2023-04-19
Supported by
National Natural Science Foundation of China(42271438)
Shandong Provincial Natural Science Foundation, China(ZR2020YQ26)
Shandong Provincial Natural Science Foundation, China(ZR2019MD007)
A Project of Shandong Province Higher Educational Youth Innovation Science and Technology Program(2019KJH007)
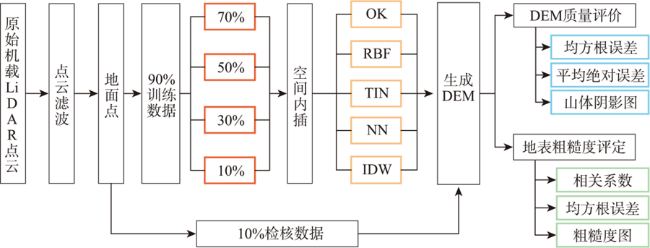
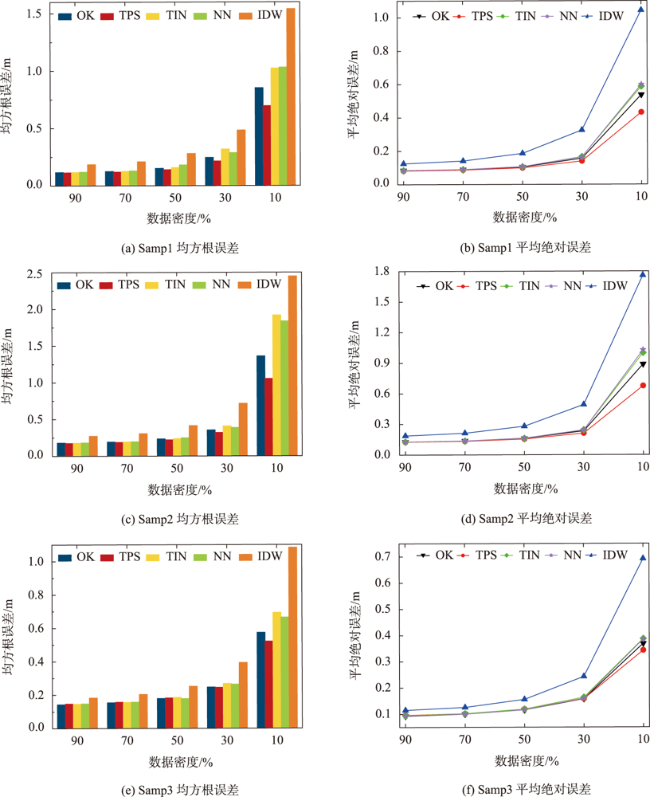
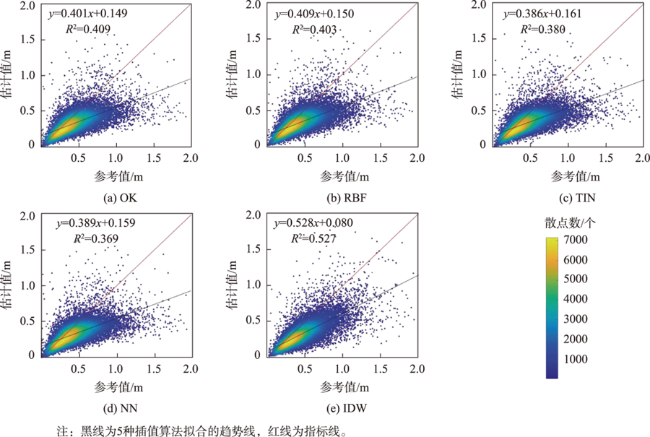
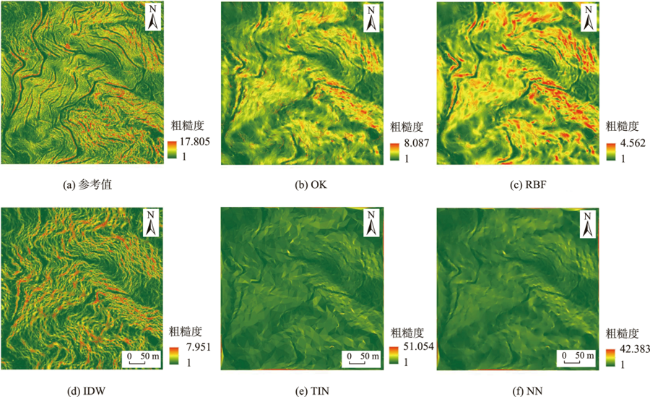
机载LiDAR点云是获取高质量数字高程模型(Digital Elevation Model, DEM)的主要数据源,而地表粗糙度作为DEM的主要派生产品,在地学研究中发挥了重要作用,但点云密度和插值方法对DEM及地表粗糙度精度影响程度并没有明确结论。为此,本文利用不同地形条件下的林区机载LiDAR点云为实验对象,将原始点云随机缩减为不同的采样密度,利用5种常用插值方法(克里金(Ordinary Kriging, OK),径向基函数(Radial Basis Function, RBF),不规则三角网(Triangulated Irregular Network, TIN),自然邻域(Natural Neighbor, NN)和反距离加权(Inverse Distance Weighting, IDW))构建各个测区不同采样密度条件下的DEM,并通过空间特征和统计特征两方面对DEM及其地表粗糙度精度分析。结果表明:① DEM插值算法的精度随点云密度缩减而降低,且数据量缩减至原始数据量的30%后,不同算法精度区别较为明显,其中,RBF和OK精度最优,IDW精度最低;② DEM误差与地表粗糙度存在正相关,随数据密度降低,OK、RBF、IDW所得粗糙度与DEM误差的相关系数均降低,与TIN和NN的相关系数先降低后在30%处升高;③ 从插值生成的DEM中提取地表粗糙度,其误差随数据密度缩减而增大,其中IDW所得粗糙度的精度在密度为90%和70%时最高,而数据密度缩减至50%后,RBF能够更准确地捕捉到地形变化。
贝祎轩 , 陈传法 , 王鑫 , 孙延宁 , 何青鑫 , 李坤禹 . 机载LiDAR点云密度和插值方法对DEM及地表粗糙度精度影响分析[J]. 地球信息科学学报, 2023 , 25(2) : 265 -276 . DOI: 10.12082/dqxxkx.2023.220486
Airborne LiDAR point clouds are the main data source for obtaining high-quality Digital Elevation Model (DEM), and surface roughness, as the main derivative of DEM, plays an important role in geoscience research. However, there is no clear conclusion about the influence of the airborne LiDAR point cloud data density and interpolation methods on the accuracy of DEMs and surface roughness. Thus, this paper evaluates the performance of five classical interpolation methods including Ordinary Kriging (OK), Radial Basis Function (RBF), Triangulated Irregular Network (TIN), Natural Neighbor (NN), and Inverse Distance Weighting (IDW) for quantifying surface roughness using different LiDAR data density (90%, 70%, 50%, 30%, and 10% of the original data) in three study sites with different terrain characteristics. The results show that: (1) the accuracy of each DEM interpolation algorithm decreases with the decrease of point cloud density, and when the data amount is reduced to 30% of the original data amount, the accuracy of different algorithms is obviously different. Among them, RBF and OK have the highest accuracy, while IDW has the lowest accuracy; (2) the DEM error is positively correlated with surface roughness. With the decrease of data density, the correlation coefficients between DEM error and roughness obtained by OK, RBF, and IDW methods all decrease, and the correlation coefficients between DEM error and roughness obtained by TIN and NN decrease first and then increase at density of 30%; (3) The surface roughness error extracted from DEM based on all interpolation methods increases with the decrease of data density, and the accuracy of IDW derived roughness is the highest when the data density is 90% and 70%. When the data density is reduced by 50%, RBF can capture terrain changes more accurately.
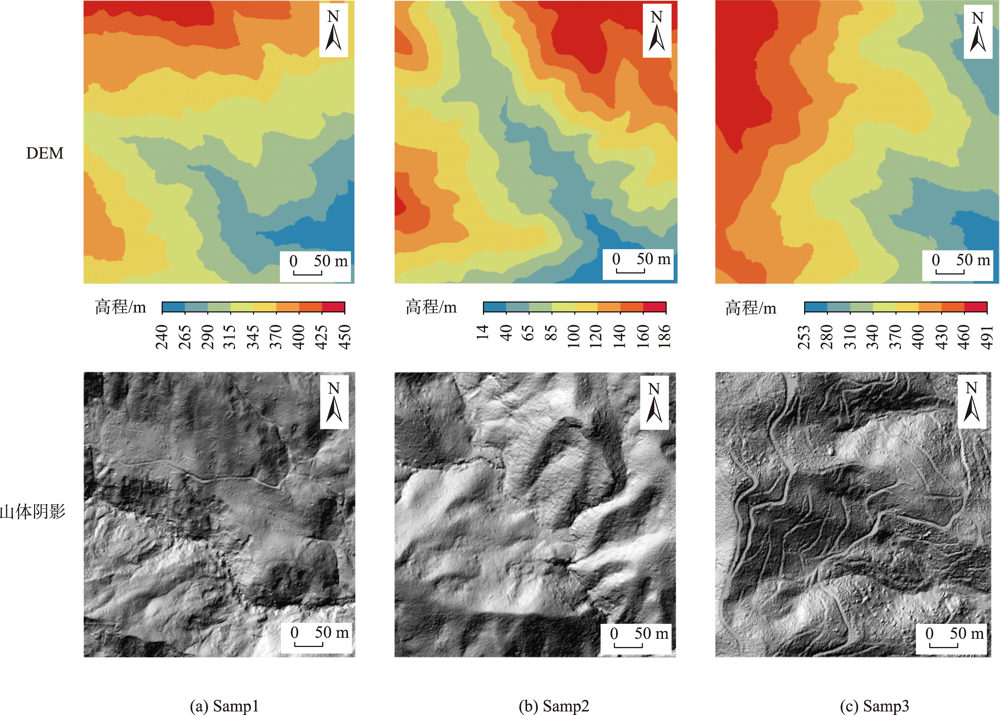
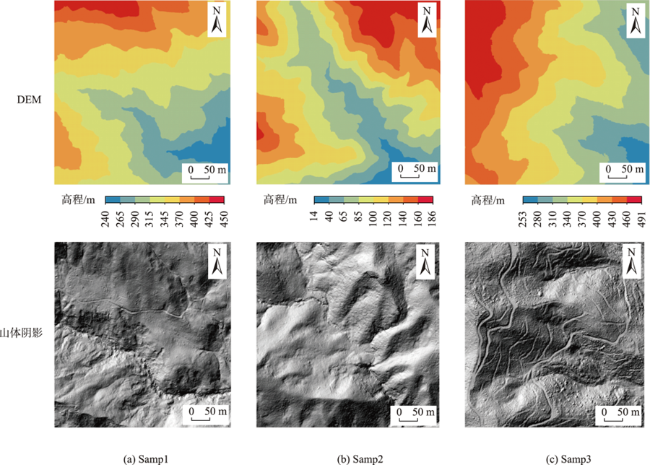
图1 试验区域原始DEM及山体阴影图Fig. 1 Original DEMs of the test area and shadow map of the mountain |
表1 试验数据的统计信息Tab. 1 Statistical information of the experimental data |
| 试验区域 | 地形特征 | 点云密度/(pts/m2) | 平均坡度/° | 平均高程/m | 高程范围/m |
|---|---|---|---|---|---|
| Samp1 | 覆盖高大植被的斜坡 | 1.31 | 29.85 | 340.0 | 239.6~451.4 |
| Samp2 | 地形复杂的峰鞘沟谷 | 0.59 | 30.16 | 102.2 | 15.3~185.9 |
| Samp3 | 陡坡 | 2.57 | 30.65 | 376.5 | 253.6~489.6 |
表2 试验数据的采集信息Tab. 2 Collection information of the datasets |
| 试验区域 | 位置 | 采集时间 | 扫描设备 | 飞行高度/m | 扫描角度/° | 重叠度/% |
|---|---|---|---|---|---|---|
| Samp1 | 加利福尼亚州 | 2017年10月 | Optech Titan | 650~1250 | ±20 | >50 |
| Samp2 | 奥克兰 | 2016—2018年 | Optech Galaxy | 1975 | ±34 | 30 |
| Samp3 | 俄勒冈州 | 2015年6月 | Optech Gemini | 900 | ±15 | 50 |
表3 试验区域平均点间距及插值分辨率Tab. 3 Number of point clouds and average distance between neighbor points (m) |
| 试验区域 | 平均点间距 | DEM分辨率 |
|---|---|---|
| Samp1 | 0.88 | 0.45 |
| Samp2 | 1.30 | 0.65 |
| Samp3 | 0.62 | 0.30 |
表4 不同数据缩减下的点云数量Tab. 4 The number of sample points after data reduction |
| 试验区域 | 点云数量/个 | ||||
|---|---|---|---|---|---|
| 90% | 70% | 50% | 30% | 10% | |
| Samp1 | 294 512 | 206 158 | 147 256 | 88 354 | 29 451 |
| Samp2 | 132 078 | 92 455 | 66 039 | 39 623 | 13 208 |
| Samp3 | 579 075 | 405 353 | 289 538 | 173 723 | 57 908 |
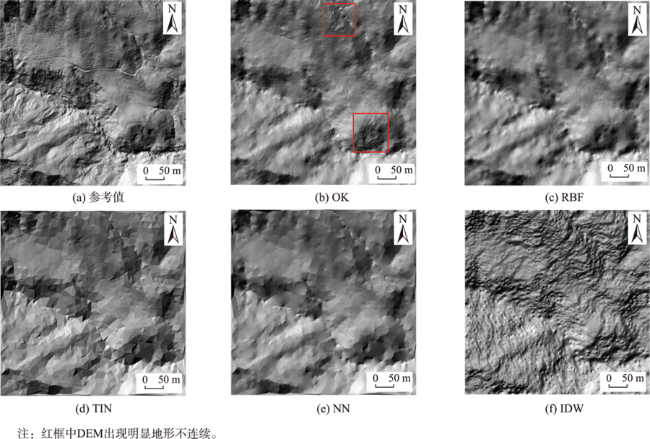
图4 10%数据密度条件下对Samp1插值所得山体阴影图Fig. 4 Hillshades of all the interpolation methods on Samp1 with 10% data density |
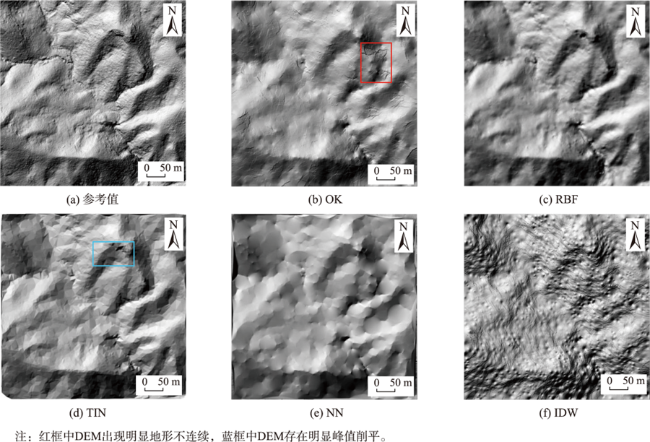
图5 10%数据密度条件下对Samp2插值所得山体阴影图Fig. 5 Hillshades of all the interpolation methods on Samp2 with 10% data density |
表5 各种算法所得地表粗糙度RMSE |
| 试验区域 | 数据密度/% | RMSE | ||||
|---|---|---|---|---|---|---|
| OK | RBF | TIN | NN | IDW | ||
| Samp1 | 90 | 0.168 | 0.167 | 0.168 | 0.172 | 0.154 |
| 70 | 0.169 | 0.167 | 0.169 | 0.178 | 0.158 | |
| 50 | 0.169 | 0.169 | 0.173 | 0.189 | 0.169 | |
| 30 | 0.178 | 0.175 | 0.198 | 0.208 | 0.188 | |
| 10 | 0.197 | 0.190 | 0.258 | 0.258 | 0.221 | |
| Samp2 | 90 | 0.243 | 0.241 | 0.245 | 0.247 | 0.231 |
| 70 | 0.245 | 0.242 | 0.246 | 0.248 | 0.237 | |
| 50 | 0.250 | 0.247 | 0.250 | 0.255 | 0.251 | |
| 30 | 0.258 | 0.254 | 0.269 | 0.311 | 0.278 | |
| 10 | 0.280 | 0.271 | 0.664 | 0.554 | 0.323 | |
| Samp3 | 90 | 0.133 | 0.133 | 0.136 | 0.143 | 0.130 |
| 70 | 0.134 | 0.134 | 0.134 | 0.144 | 0.133 | |
| 50 | 0.136 | 0.136 | 0.138 | 0.136 | 0.137 | |
| 30 | 0.141 | 0.139 | 0.149 | 0.150 | 0.148 | |
| 10 | 0.152 | 0.148 | 0.202 | 0.211 | 0.167 | |
Tab. 5 The accuracy of surface roughness obtained by various algorithms (m) |
| [1] |
|
| [2] |
|
| [3] |
李振洪, 李鹏, 丁咚, 等. 全球高分辨率数字高程模型研究进展与展望[J]. 武汉大学学报·信息科学版, 2018, 43(12):1927-1942.
[
|
| [4] |
|
| [5] |
|
| [6] |
曹伟, 陈动, 史玉峰, 等. 激光雷达点云树木建模研究进展与展望[J]. 武汉大学学报·信息科学版, 2021, 46(2):203-220.
[
|
| [7] |
陈传法, 王梦樱, 杨帅, 等. 适用于林区机载LiDAR点云的多分辨率层次插值滤波方法[J]. 山东科技大学学报(自然科学版), 2021, 40(2):12-20.
[
|
| [8] |
|
| [9] |
Guo Qinghua Li Wenkai Yu Hong Alvarez Otto. Effects of topographic variability and lidar sampling density on several DEM interpolation methods[J]. Photogrammetric Engineering & Remote Sensing, 2010, 76(6):701-712.
|
| [10] |
|
| [11] |
|
| [12] |
|
| [13] |
|
| [14] |
|
| [15] |
赵明伟, 汤国安, 田剑. AMMI模型的DEM内插方法不确定性研究[J]. 地球信息科学学报, 2012, 14(1):62-66.
[
|
| [16] |
|
| [17] |
|
| [18] |
|
| [19] |
|
| [20] |
|
| [21] |
|
| [22] |
|
| [23] |
|
| [24] |
王舒. 基于被动微波遥感的地表粗糙度及土壤水分反演研究[J]. 测绘学报, 2021, 50(10):1419.
[
|
| [25] |
|
| [26] |
|
| [27] |
|
| [28] |
|
| [29] |
|
| [30] |
|
| [31] |
|
/
| 〈 |
|
〉 |