
基于多源开放数据的中国农村可达指数评估
|
刘垚明(1999—),男,河北承德人,硕士生,研究方向为数据挖掘与分析。E-mail: 20171001314@cug.edu.cn |
收稿日期: 2022-03-02
修回日期: 2022-05-19
网络出版日期: 2023-04-19
基金资助
可持续发展大数据国际研究中心主任青年基金(CBAS2022DF010)
国家自然科学基金项目(41771428)
国家自然科学基金项目(42001327)
中国科学院A 类战略先导科技专项“地球大数据科学工程”(XDA19090131)
Evaluating Rural Access Index across China with Multi-source Open Data
Received date: 2022-03-02
Revised date: 2022-05-19
Online published: 2023-04-19
Supported by
Director Fund of the International Research Center of Big Data for Sustainable Development Goals,(CBAS2022DF010)
National Natural Science Foundation of China(41771428)
National Natural Science Foundation of China(42001327)
Strategic Priority Research Program of the Chinese Academy of Sciences(XDA19090131)
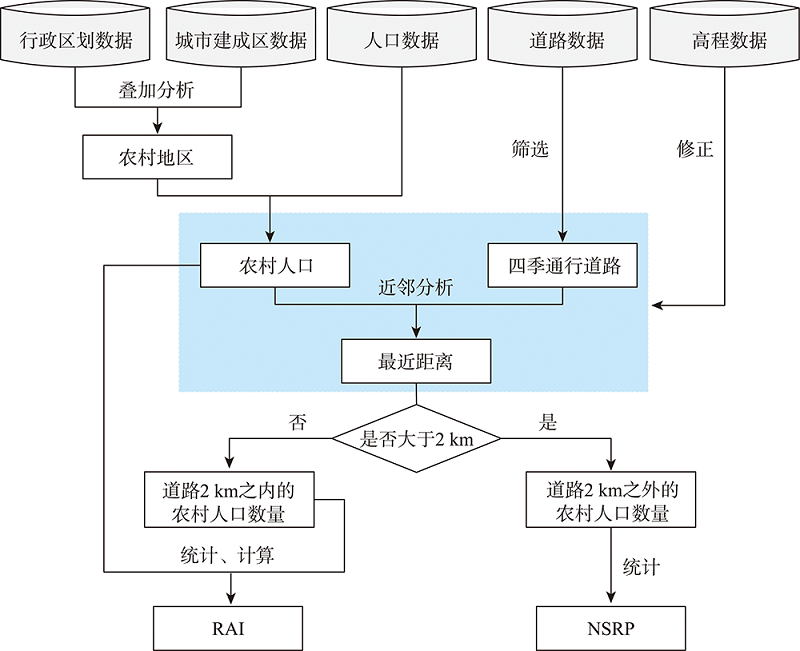
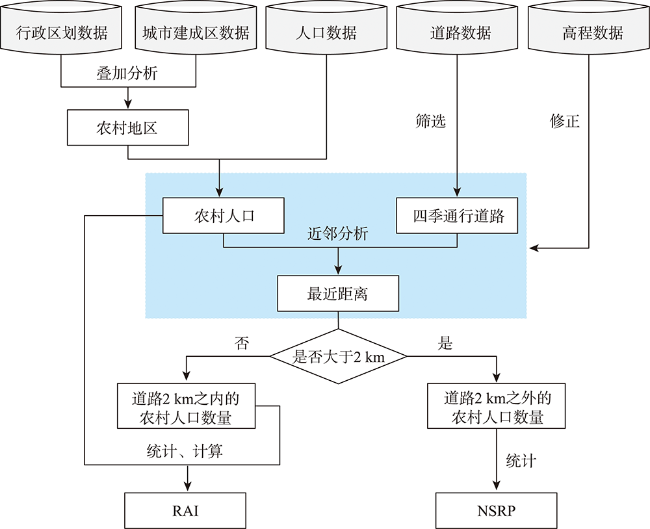
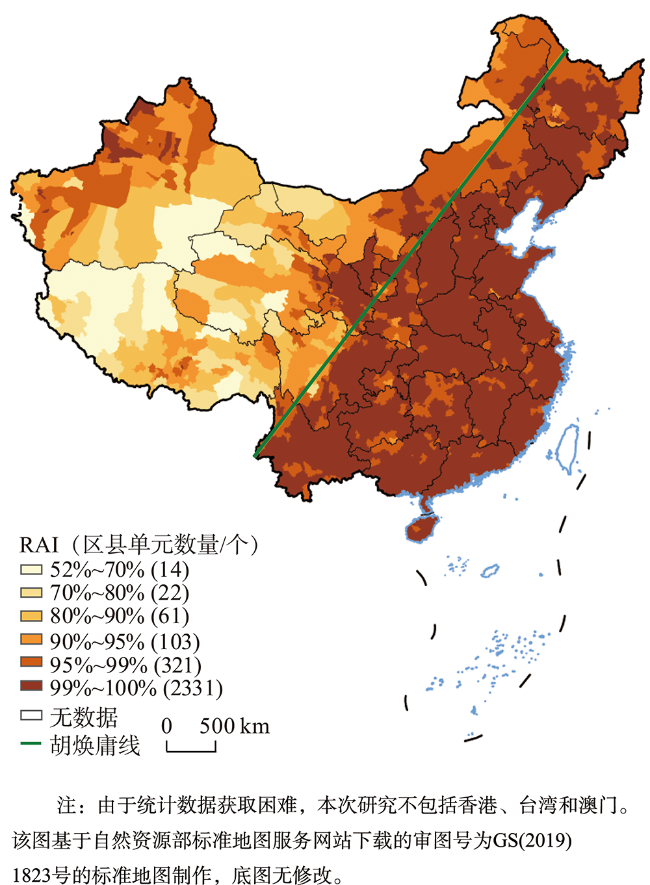
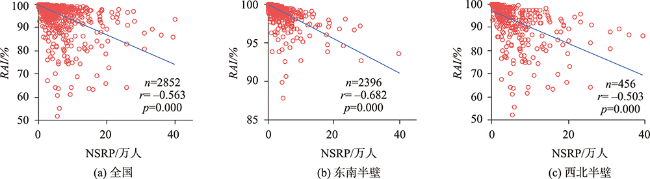
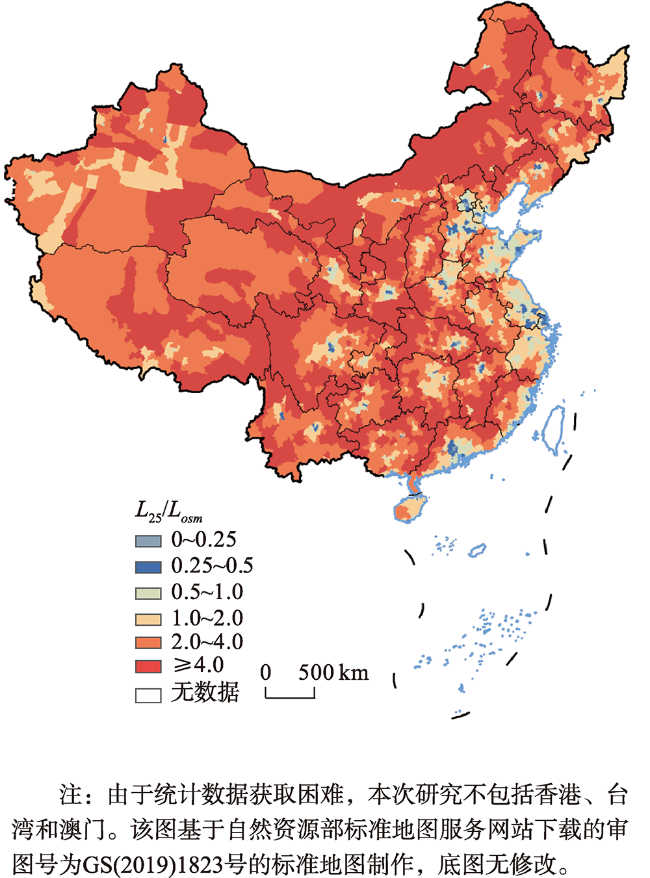
农村可达指数(RAI)是联合国可持续发展目标(SDGs)的重要评估指标(SDG 9.1.1),用于衡量享受道路交通服务的农村人口比例,但是目前存在指标不全、范围有限、数据有偏和解释不足等问题。因此,本文基于1:25万道路数据、1:100万行政区划数据、100 m分辨率人口数据、城市建成区数据、高程数据和GDP数据六种全球或区域开放的地理空间数据,评估了全国2852个区县单元的RAI和NSRP(难以享受道路交通服务的农村人口)指标,并引入社会经济变量和地形变量理解这2个指标的空间格局。研究发现:① 虽然我国仍有485.3万难以享受道路交通服务的农村人口;但是享受道路交通服务的农村人口比例为99.5%,且该值远高于世界银行给出的评估结果(71.8%);② RAI和NSRP的空间格局均沿“胡焕庸线”呈两极化分布:“胡焕庸线”以东地区的RAI值较高、NSRP值较低;而“胡焕庸线”以西地区的RAI值较低、NSRP值较高;③ RAI和NSRP与社会经济和地形变量显著相关,且与地形变量的相关性更高,表明地形对2个指标空间格局影响显著。本研究首次在区县级尺度上揭示了我国农村交通服务的空间格局,可以为改善农村道路交通设施提供决策支持。
刘垚明 , 李宛静 , 张修远 , 张宇恒 , 李然 , 周琪 . 基于多源开放数据的中国农村可达指数评估[J]. 地球信息科学学报, 2023 , 25(4) : 783 -793 . DOI: 10.12082/dqxxkx.2023.220087
Rural Access Index (RAI) is an indicator (SDG 9.1.1) of the UN's Sustainable Development Goals (SDGs), and it measures the proportion of the rural population who live within 2 km of all-season roads. Currently, there is a lack of evaluation on RAI's spatial pattern in China and its influencing factors in existing studies. To fill this gap, our study proposes another indicator, Non-Served Rural Population (NSRP), and employs six open datasets including 1:250 000 road data, 1:1 000 000 county-level division data, 100 m population data, urban extent data, DEM data, and GDP data to evaluate both the RAI and NSRP indicators for 2852 counties in China. We also select two categories of variables (i.e., socio-economic and terrain variables) to analyze the spatial patterns of RAI and NSRP. Results show that: (1) The RAI and NSRP of China are 99.5% and 4.8 million, respectively. It means that 99.5% of rural population in China live within 2 km of all-season roads, and this value is much higher than that published by The World Bank. However, there still are 4.8 million rural population that live outside the 2 km of all-season roads; (2) The spatial patterns of both RAI and NSRP can be divided into two parts. That is, a relatively high RAI and low NSRP in the southeast of the “Hu Huanyong Line”, but on the contrary, a relatively low RAI and high NSRP in the northwest of the “Hu Huanyong Line”; (3) Both the RAI and NSRP are significantly correlated with socio-economic and terrain variables, and the correlation between RAI (or NSRP) and the terrain variable is the strongest, which indicates that the terrain may be a main factor that affecting the spatial patterns of these two indicators. This study first maps the spatial pattern of SDG 9.1.1 in China, which provides basic data, helpful information, and knowledge for improving road infrastructure in rural areas of China.
Key words: SDG9.1.1; accessibility; rural; road; population; spatial pattern; GDP; terrain; China
表1 RAI和NSRP指标与4种解释变量的相关性结果Tab. 1 Correlations between two indicators and four explanatory variables |
| 人口 | GDP | 高程平均值 | 坡度标准差 | ||
|---|---|---|---|---|---|
| RAI | 全国 | 0.241** | 0.156** | -0.654** | -0.329** |
| 东南半壁 | 0.136** | 0.121** | -0.232** | -0.212** | |
| 西北半壁 | 0.466** | 0.290** | -0.594** | -0.365** | |
| NSRP | 全国 | -0.087** | -0.121** | 0.353** | 0.247** |
| 东南半壁 | 0.048* | -0.062** | 0.067** | 0.123** | |
| 西北半壁 | -0.057 | -0.061 | 0.193** | 0.229** |
注:**显著性水平<0.01;*显著性水平<0.05。 |
附录A 31个省(区/市)区县单元RAI指标的统计结果(%)
| 序号 | 省市区名称 | 平均值 | 最大值 | 最小值 |
|---|---|---|---|---|
| 1 | 天津市 | 99.9 | 100.0 | 99.6 |
| 2 | 北京市 | 99.9 | 100.0 | 99.6 |
| 3 | 河南省 | 99.9 | 100.0 | 98.3 |
| 4 | 上海市 | 99.9 | 100.0 | 98.8 |
| 5 | 河北省 | 99.9 | 100.0 | 96.0 |
| 6 | 江苏省 | 99.8 | 100.0 | 97.6 |
| 7 | 安徽省 | 99.8 | 100.0 | 97.2 |
| 8 | 浙江省 | 99.8 | 100.0 | 95.6 |
| 9 | 湖北省 | 99.8 | 100.0 | 97.7 |
| 10 | 辽宁省 | 99.8 | 100.0 | 93.8 |
| 11 | 山西省 | 99.8 | 100.0 | 98.7 |
| 12 | 海南省 | 99.8 | 100.0 | 98.8 |
| 13 | 山东省 | 99.8 | 100.0 | 93.6 |
| 14 | 广东省 | 99.7 | 100.0 | 97.8 |
| 15 | 福建省 | 99.7 | 100.0 | 97.4 |
| 16 | 江西省 | 99.7 | 100.0 | 98.0 |
| 17 | 广西壮族自治区 | 99.6 | 100.0 | 96.9 |
| 18 | 吉林省 | 99.6 | 100.0 | 97.0 |
| 19 | 贵州省 | 99.5 | 100.0 | 94.4 |
| 20 | 宁夏回族自治区 | 99.5 | 100.0 | 95.9 |
| 21 | 云南省 | 99.5 | 100.0 | 89.9 |
| 22 | 湖南省 | 99.4 | 100.0 | 96.6 |
| 23 | 重庆市 | 99.3 | 100.0 | 94.7 |
| 24 | 陕西省 | 99.2 | 100.0 | 93.7 |
| 25 | 黑龙江省 | 98.9 | 100.0 | 87.8 |
| 26 | 四川省 | 98.1 | 100.0 | 78.6 |
| 27 | 内蒙古自治区 | 97.9 | 100.0 | 75.7 |
| 28 | 甘肃省 | 97.2 | 100.0 | 75.4 |
| 29 | 新疆维吾尔自治区 | 94.4 | 100.0 | 63.3 |
| 30 | 青海省 | 90.6 | 100.0 | 55.4 |
| 31 | 西藏自治区 | 84.3 | 99.3 | 52.0 |
附录B 31个省(区/市)区县单元NSRP指标的统计结果(人)
| 序号 | 省市区名称 | 平均值 | 最大值 | 最小值 |
|---|---|---|---|---|
| 1 | 天津市 | 301.7 | 2212 | 0 |
| 2 | 北京市 | 303.8 | 1282 | 0 |
| 3 | 山西省 | 450.7 | 5791 | 0 |
| 4 | 辽宁省 | 466.1 | 5303 | 0 |
| 5 | 浙江省 | 479.0 | 8568 | 0 |
| 6 | 河北省 | 489.9 | 17 749 | 0 |
| 7 | 海南省 | 499.7 | 2747 | 0 |
| 8 | 河南省 | 615.6 | 10 329 | 0 |
| 9 | 安徽省 | 639.1 | 15 007 | 0 |
| 10 | 湖北省 | 694.0 | 13 830 | 0 |
| 11 | 福建省 | 699.2 | 6118 | 0 |
| 12 | 上海市 | 715.8 | 8531 | 0 |
| 13 | 江苏省 | 830.2 | 13 573 | 0 |
| 14 | 宁夏回族自治区 | 916.5 | 7483 | 2 |
| 15 | 广西壮族自治区 | 1001.2 | 5899 | 0 |
| 16 | 吉林省 | 1024.6 | 7232 | 0 |
| 17 | 广东省 | 1035.9 | 7530 | 0 |
| 18 | 云南省 | 1122.9 | 5695 | 0 |
| 19 | 山东省 | 1235.3 | 39 805 | 0 |
| 20 | 江西省 | 1242.4 | 13 193 | 0 |
| 21 | 贵州省 | 1253.2 | 10 537 | 0 |
| 22 | 陕西省 | 1673.3 | 17 889 | 0 |
| 23 | 四川省 | 2001.7 | 19 764 | 0 |
| 24 | 黑龙江省 | 2064.3 | 28 226 | 0 |
| 25 | 内蒙古自治区 | 2563.2 | 12 572 | 0 |
| 26 | 湖南省 | 3190.8 | 26 041 | 0 |
| 27 | 重庆市 | 3583.0 | 27 888 | 0 |
| 28 | 甘肃省 | 4091.1 | 30 883 | 0 |
| 29 | 西藏自治区 | 5080.1 | 17 197 | 465 |
| 30 | 青海省 | 6432.8 | 25 814 | 0 |
| 31 | 新疆维吾尔自治区 | 7352.8 | 39 346 | 0 |
| [1] |
UN. Transforming our world: The 2030 agenda for sustainable development[R]. New York: UN, 2015.
|
| [2] |
郭茹, 戴欣宇, 刘林京, 等. 可持续发展目标评价研究进展及中国实践[J]. 生态经济, 2022, 38(1):211-217.
[
|
| [3] |
IAEG-SDGs. Global indicator framework for the Sustainable Development Goals and targets of the 2030 agenda for sustainable development[EB/OL]. available from: https://unstats.un.org/sgds/indicators/indicators-list/.
|
| [4] |
UN General Assembly. Resolution adopted by the General Assembly on work of the statistical commission pertaining to the 2030 agenda for sustainable development[Z]. 2017.
|
| [5] |
|
| [6] |
|
| [7] |
中共中央国务院印发《交通强国建设纲要》[N]. 人民日报,2019-9-20(004).
[The Central Committee of the Communist Party and The State Council of China issued Outline of building a strong transportation country. People's Daily, 2019-9-20(004).]
|
| [8] |
|
| [9] |
World Bank Group. Measuring rural access: using new technologies[M]. World Bank, 2016.
|
| [10] |
|
| [11] |
|
| [12] |
|
| [13] |
|
| [14] |
|
| [15] |
徐州, 林孝松, 朱荣, 等. 巫山县乡村地区公路网通达性空间格局研究[J]. 浙江大学学报(理学版), 2019, 46(4):511-520.
[
|
| [16] |
马雪莹, 邵景安, 徐新良. 基于熵权-TOPSI的山区乡镇通达性研究——以重庆市石柱县为例[J]. 地理科学进展, 2016(9):1144-1154.
[
|
| [17] |
肖京格, 周廷刚, 姚林虎, 等. 重庆市交通网络的可达性时空特征及其演化规律[J]. 地球信息科学学报, 2015, 17(1):54-61.
[
|
| [18] |
罗雨, 李同昇, 王昭, 等. 乡村振兴视角下秦巴山区农村路网通达性评价与分区优化研究——以陕西省山阳县为例[J]. 人文地理, 2020, 35(3):104-114.
[
|
| [19] |
|
| [20] |
|
| [21] |
|
| [22] |
|
| [23] |
|
| [24] |
|
| [25] |
|
| [26] |
|
| [27] |
胡焕庸. 中国人口之分布——附统计表与密度图[J]. 地理学报, 1935, 2(2):33-74.
[
|
| [28] |
United Nations, Leaving No one behind: Equality and non-discrimination at the heart of sustainable development[EB/OL]. available from: https://unsceb.org/sites/default/files/imported_files/CEB%20equality%20framewor k-A4-web-rev3.pdf, 2017.
|
| [29] |
|
| [30] |
|
| [31] |
IAEG-SDGS. Tier classification for global SDG indicators. New York: Interagency and Expert Group on SDG Indicators, 2021.
|
| [32] |
郭华东, 梁栋, 陈方, 等. 地球大数据促进联合国可持续发展目标实现[J]. 中国科学院院刊, 2021, 36(8):874-884.
[
|
| [33] |
|
| [34] |
|
/
| 〈 |
|
〉 |

