
乌梁素海流域生态脆弱性时空变化及其成因分析
|
李云帆(1999—),山西长治人,硕士生,研究方向为资源环境遥感。E-mail: lilichin@bjfu.edu.cn |
收稿日期: 2023-04-21
修回日期: 2023-07-13
网络出版日期: 2023-09-22
基金资助
中建股份科技研发计划项目(CSCEC-2020-Z-5)
中欧科技合作“龙计划”五期项目(59257)
中欧对地观测合作森林监测技术与示范应用(2021YFE0117700)
Spatiotemporal Changes and Causes of Ecological Vulnerability in Ulansuhai Basin
Received date: 2023-04-21
Revised date: 2023-07-13
Online published: 2023-09-22
Supported by
CSCEC Science and Technology Research and Development Program(CSCEC-2020-Z-5)
China-Europe Science and Technology Cooperation "Dragon Plan" Phase V Project(59257)
Cooperation project between China and Europe in Earth Observation on forest monitoring technology and demonstration applications(2021YFE0117700)
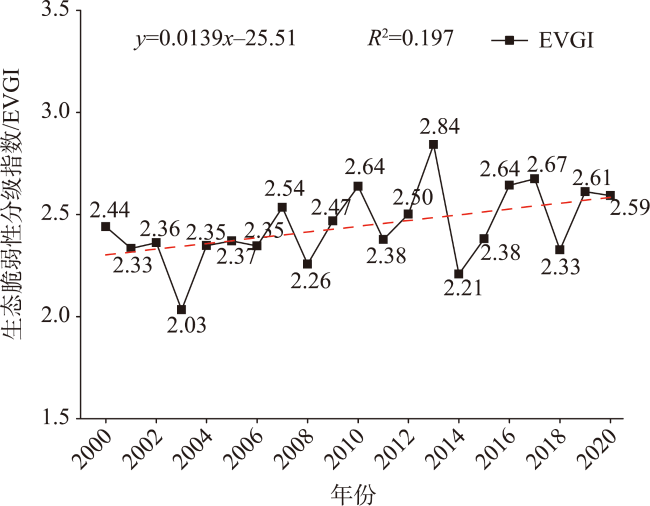
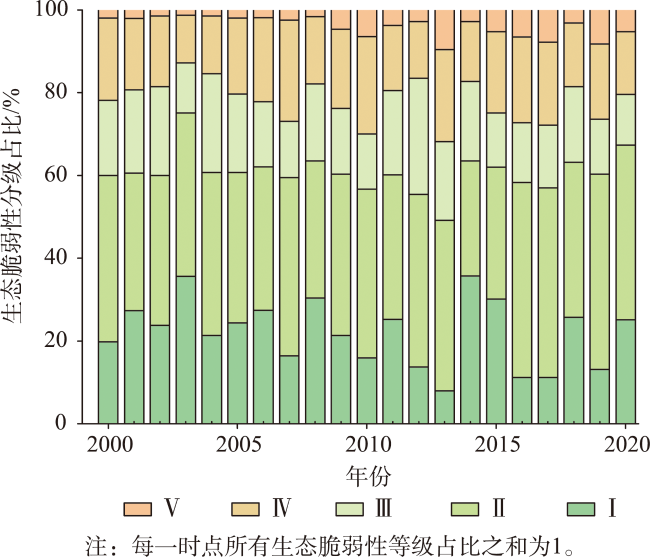
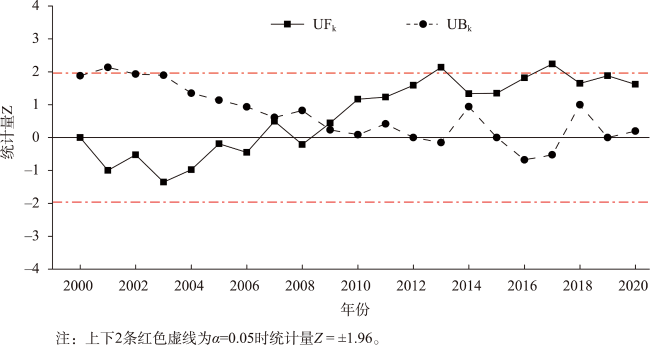
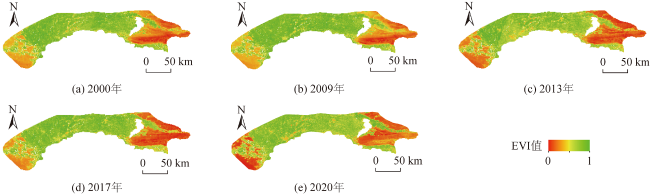
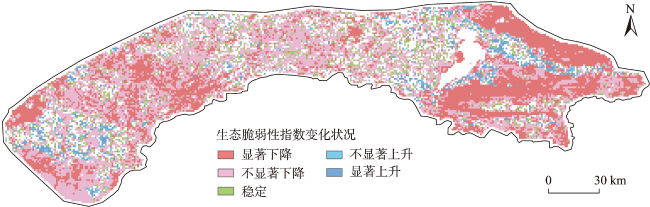
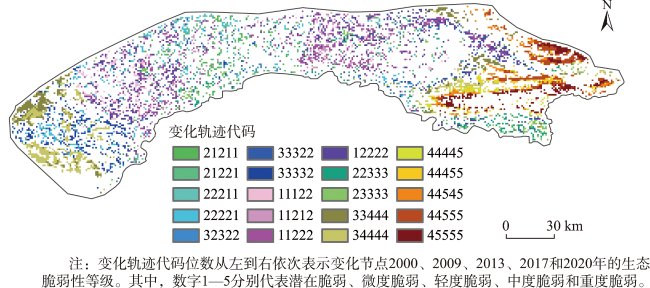
面对“碎片化”生态治理的挑战,全面了解流域生态系统的脆弱性及其演变规律成为生态环境综合治理的关键。乌梁素海流域作为全国示范意义的生态保护修复工程试点,经历了传统“治理湖泊”到系统“治理流域”的转变。本研究选择乌梁素海流域作为研究对象,构建了“敏感-恢复-压力”生态脆弱性评价指标体系,并以Google Earth Engine (GEE)云平台为基础,采用Mann-Kendall突变检验、Sen+Mann-Kendall趋势分析和变换轨迹等方法,对2000—2020年乌梁素海流域生态脆弱性时空演变进行分析,最后通过地理探测器进一步探讨了乌梁素海流域生态脆弱性的成因,并揭示了其主要驱动因子。研究结果表明:乌梁素海流域的生态脆弱性表现为“中间低、两边高”的格局。其中,西部乌兰布和沙漠以及东部乌拉山区生态脆弱性较高,而中部河套灌区则相对较低。2000—2020年,流域的生态脆弱性分级指数从2.44上升至2.59,揭示了生态脆弱性的轻微恶化趋势。2000、2009、2013、2017和2020年为突变节点,约59.82%的区域在评估期间生态脆弱性等级保持稳定,变化轨迹法显示2013年为显著下降的节点,2017年后下降趋势减缓。此外,地表干度是乌梁素海流域生态脆弱性的核心驱动因子,多个因素相互作用时对生态脆弱性的解释力超过单一因素。土地覆盖类型解释力最为显著,其次是气象类型、经济类型。本研究对长时序流域生态脆弱性的时空变化及成因进行了分析,为同类型的生态脆弱区域评估和生态保护与修复工程治理提供科学依据。
李云帆 , 李彩霞 , 贾翔 , 吴晶 , 张晓丽 , 梅晓丽 , 朱若柠 , 王冬 . 乌梁素海流域生态脆弱性时空变化及其成因分析[J]. 地球信息科学学报, 2023 , 25(10) : 2039 -2054 . DOI: 10.12082/dqxxkx.2023.230212
To meet the challenges posed by the "fragmented" nature of ecological governance, it is crucial to have a holistic understanding of the vulnerability of basin ecosystems and the underlying patterns of their evolution for comprehensive ecological management. The Ulansuhai Basin, serving as a pilot site for a representative ecological conservation and restoration project, has experienced a shift from traditional "lake management" to a more systemic "basin management". This study selected the Ulansuhai Basin as the study area and established a "Sensitivity-Recovery-Pressure" index system for ecological vulnerability assessment. Using the Google Earth Engine cloud platform, methods including Mann-Kendall test, Sen+Mann-Kendall trend analysis, and transformation trajectory were applied to analyse the spatiotemporal evolution of ecological vulnerability in the Ulansuhai Basin from 2000 to 2020. Moreover, geographical detectors were utilized to further investigate the causes of ecological vulnerability in the Ulansuhai Basin, and to identify the primary driving factors. The results indicated that the ecological vulnerability of the Ulansuhai Basin exhibited a “low in the middle, high on both sides” pattern, e.g., the western region of the Ulan Buh Desert and the eastern Ula Mountain region had relatively higher ecological vulnerability, while the central Hetao irrigation area had lower ecological vulnerability. From 2000 to 2020, the basin’s ecological vulnerability grading index increased from 2.44 to 2.59, indicating a slight decline in ecological vulnerability. Abrupt changes of vulnerability were observed in 2000, 2009, 2013, 2017, and 2020, with approximately 59.82% of the basin area maintaining stable ecological vulnerability grades throughout the assessment period. The transformation trajectory method showed that the decline of vulnerability peaked in 2013 and then began to slow after 2017. Additionally, surface aridity was identified as a key driving factor of ecological vulnerability in the Ulansuhai Basin, and the interaction of multiple factors showed a stronger explanatory power for ecological vulnerability than a single factor. Generally, land cover type exhibited the most significant explanatory power, followed by meteorological and economic types. This study analyzed the long-term spatiotemporal changes and causes of ecological vulnerability in basin ecosystems, providing a scientific basis for the assessment and governance of ecological conservation and restoration projects in ecologically vulnerable regions.
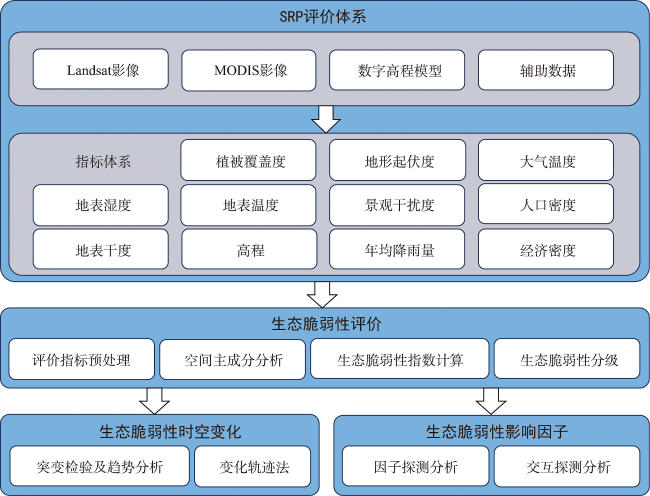
表1 乌梁素海流域生态脆弱性评价体系和数据来源Tab. 1 Ecological vulnerability assessment system of Ulansuhai Basin data sources |
| 要素层 | 指标层 | 指标性质 | 空间分辨率 | 原始数据来源 |
|---|---|---|---|---|
| 生态敏感性 (Sensitivity) | 高程 | 正向 | 90 m | SRTM[32] |
| 地形起伏度 | 正向 | 90 m | SRTM | |
| 景观干扰度 | 正向 | 1 km | Zendo[33] | |
| 年均降雨量 | 正向 | 1 km | 中国科学院环境数据中心 | |
| 大气温度 | 正向 | 1 km | Zendo[34] | |
| 地表温度 | 正向 | 1 km | MODIS | |
| 地表湿度 | 负向 | 30 m | Landsat | |
| 地表干度 | 正向 | 30 m | Landsat | |
| 生态压力度 (Pressure) | 人口密度 | 正向 | 1 km | GPW v4[35] |
| 生态恢复力 (Recovery) | 植被覆盖度 | 负向 | 30 m | Landsat |
| 经济密度 | 负向 | 1 km | 中国科学院环境数据中心[36] |
表2 缨帽变换传感器系数Tab. 2 Tasseled Cap Transform sensor coefficient |
| 传感器名称 | B | G | R | NIR | SWIR1 | SWIR2 |
|---|---|---|---|---|---|---|
| TM | 0.031 5 | 0.202 1 | 0.301 2 | 0.159 4 | -0.680 6 | -0.610 9 |
| ETM+ | 0.262 6 | 0.214 1 | 0.092 6 | 0.065 6 | -0.762 9 | -0.538 8 |
| OLI | 0.151 1 | 0.197 3 | 0.328 3 | 0.340 7 | -0.711 7 | -0.455 9 |
表3 乌梁素海流域生态脆弱性分级划分标准Tab. 3 Classification standard of ecological vulnerability in Ulansuhai Basin |
| 脆弱性等级 | 生态脆弱性指数范围 | 脆弱程度 | 生态特征解释 |
|---|---|---|---|
| Ⅰ | 0≤ EVI<0.2 | 潜在脆弱 | 生态功能完整,对各类干扰敏感性弱,承受生态压力小,自我恢复能力强,无生态异常出现 |
| Ⅱ | 0.2≤ EVI<0.4 | 微度脆弱 | 生态功能较为完整,对各类干扰敏感性较弱,承受生态压力较小,自我恢复能力强,存在潜在的生态异常 |
| Ⅲ | 0.4≤ EVI<0.6 | 轻度脆弱 | 生态功能尚可维持,对各类干扰敏感性中等,承受生态压力接近阈值,自我恢复能力较弱,存在少量的生态异常 |
| Ⅳ | 0.6≤ EVI<0.8 | 中度脆弱 | 生态功能部分退化,对各类干扰敏感性较强,承受生态压力较大,受损后恢复难度较大,生态异常较多 |
| Ⅴ | 0.8≤ EVI ≤1 | 重度脆弱 | 生态功能退化严重,对各类干扰敏感性强,承受生态压力大,受损恢复难度大,生态异常集中连片出现 |
表4 交互探测器结果类型Tab. 4 Interactive detector result types |
| 判断依据 | 交互作用 |
|---|---|
| 非线性减弱 | |
| 单线性减弱 | |
| 双线性增强 | |
| 相互独立 | |
| 非线性增强 |
图7 乌梁素海流域2000—2020年生态脆弱性趋势分析Fig. 7 Trend analysis of ecological vulnerability in Ulansuhai Basin from 2000 to 2020 |
表5 乌梁素海流域2000—2020年生态脆弱性指数变化统计Tab. 5 Ecological vulnerability index change statistics in Ulansuhai Basin from 2000 to 2020 |
| Sen斜率 | 变化状况 | 研究区占比/% | |
|---|---|---|---|
| >0.000 5 | ≥ 1.96 | 显著上升 | 4.15 |
| >0.000 5 | < 1.96 | 不显著上升 | 2.77 |
| -0.000 5~0.000 5 | < 1.96 | 稳定不变 | 9.55 |
| <-0.000 5 | < 1.96 | 不显著下降 | 48.59 |
| <-0.000 5 | ≥ 1.96 | 显著下降 | 34.93 |
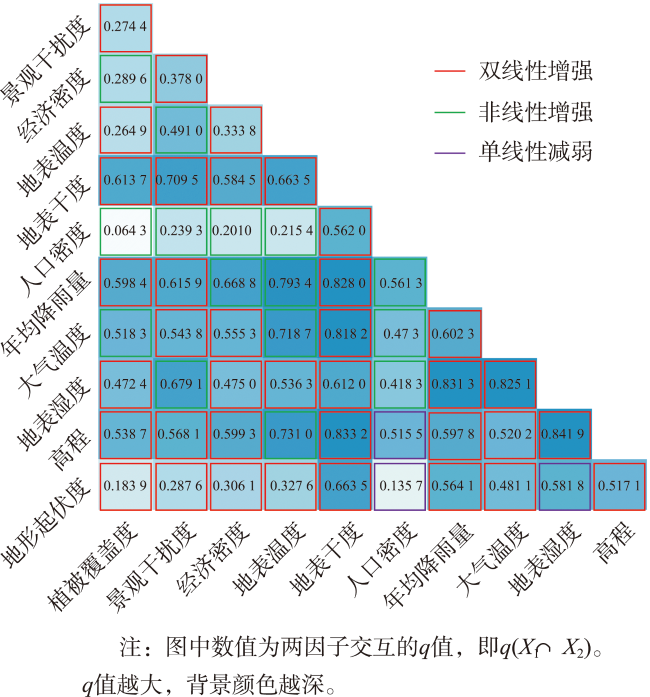
表6 单因子对生态脆弱性影响Tab. 6 Impact of single factor on ecological vulnerability |
| 生态脆弱性因子 | q统计值 | p值 |
|---|---|---|
| 地形起伏度 | 0.135 6 | 2.93E-10 |
| 高程 | 0.515 2 | 6.12E-10 |
| 地表湿度 | 0.417 5 | 3.37E-10 |
| 大气温度 | 0.472 6 | 1.20E-10 |
| 年均降雨量 | 0.560 0 | 6.66E-10 |
| 人口密度 | 0.000 0 | 1 |
| 地表干度 | 0.561 3 | 5.19E-10 |
| 地表温度 | 0.214 9 | 9.49E-10 |
| 经济密度 | 0.200 9 | 3.98E-10 |
| 景观干扰度 | 0.237 9 | 5.29E-10 |
| 植被覆盖度 | 0.063 7 | 5.94E-10 |
| [1] |
张学玲, 余文波, 蔡海生, 等. 区域生态环境脆弱性评价方法研究综述[J]. 生态学报, 2018, 38(16):5970-5981.
[
|
| [2] |
王让会, 樊自立. 塔里木河流域生态脆弱性评价研究[J]. 干旱环境监测, 1998, 12(4):218-221,223.
[
|
| [3] |
廖炜, 李璐, 吴宜进, 等. 丹江口库区土地利用变化与生态环境脆弱性评价[J]. 自然资源学报, 2011, 26(11):1879-1889.
[
|
| [4] |
吴琼. 基于景观格局的辽宁海岸带生态脆弱性评价[D]. 大连: 辽宁师范大学, 2014.
[
|
| [5] |
姚建, 艾南山, 丁晶. 中国生态环境脆弱性及其评价研究进展[J]. 兰州大学学报, 2003, 39(3):77-80.
[
|
| [6] |
徐广才, 康慕谊, 贺丽娜, 等. 生态脆弱性及其研究进展[J]. 生态学报, 2009, 29(5):2578-2588.
[
|
| [7] |
田海宁. 汉中市生态脆弱性评价及空间分布规律研究[J]. 中国农业资源与区划, 2017, 38(3):148-152.
[
|
| [8] |
|
| [9] |
于伯华, 吕昌河. 青藏高原高寒区生态脆弱性评价[J]. 地理研究, 2011, 30(12):2289-2295.
[
|
| [10] |
吴春生, 黄翀, 刘高焕, 等. 基于模糊层次分析法的黄河三角洲生态脆弱性评价[J]. 生态学报, 2018, 38(13):4584-4595.
[
|
| [11] |
|
| [12] |
|
| [13] |
温晓金, 杨新军, 王子侨. 多适应目标下的山地城市社会—生态系统脆弱性评价[J]. 地理研究, 2016, 35(2):299-312.
[
|
| [14] |
|
| [15] |
李永化, 范强, 王雪, 等. 基于SRP模型的自然灾害多发区生态脆弱性时空分异研究——以辽宁省朝阳县为例[J]. 地理科学, 2015, 35(11):1452-1459.
[
|
| [16] |
张泽, 胡宝清, 丘海红, 等. 基于山江海视角与SRP模型的桂西南-北部湾生态环境脆弱性评价[J]. 地球与环境, 2021, 49(3):297-306.
[
|
| [17] |
王铁军, 赵礼剑, 张溪. 青藏高原生态屏障区生态环境综合评价方法探讨[J]. 测绘通报, 2018(9):112-116.
[
|
| [18] |
|
| [19] |
刘晶晶. 集中连片特困区生态环境脆弱性评价研究——以大别山片区为例[D]. 武汉: 华中师范大学, 2019.
[
|
| [20] |
徐静, 王泽宇. 中国陆海统筹绩效时空分异及影响因素——基于脆弱性视角的分析[J]. 地域研究与开发, 2019, 38(2):25-30.
[
|
| [21] |
沈文娟, 李明诗. 基于长时间序列Landsat影像的南方人工林干扰与恢复制图分析[J]. 生态学报, 2017, 37(5):1438-1449.
[
|
| [22] |
|
| [23] |
朱鹏航, 于瑞宏, 葛铮, 等. 乌梁素海长时序水质变化及其驱动因子[J]. 生态学杂志, 2022, 41(3):546-553.
[
|
| [24] |
田野, 冯启源, 唐明方, 等. 基于生态系统评价的山水林田湖草生态保护与修复体系构建研究——以乌梁素海流域为例[J]. 生态学报, 2019, 39(23):8826-8836.
[
|
| [25] |
|
| [26] |
王劲峰, 徐成东. 地理探测器:原理与展望[J]. 地理学报, 2017, 72(1):116-134.
[
|
| [27] |
|
| [28] |
|
| [29] |
鲁飞飞, 张勇, 李雪, 等. 乌梁素海流域湿地保护与恢复建设的探讨[J]. 林业资源管理, 2019(5):23-27,67.
[
|
| [30] |
柳新伟, 周厚诚, 李萍, 等. 生态系统稳定性定义剖析[J]. 生态学报, 2004, 24(11):2635-2640.
[
|
| [31] |
乔青, 高吉喜, 王维, 等. 生态脆弱性综合评价方法与应用[J]. 环境科学研究, 2008, 21(5):117-123.
[
|
| [32] |
|
| [33] |
|
| [34] |
|
| [35] |
|
| [36] |
|
| [37] |
张伟, 李爱农. 基于DEM的中国地形起伏度适宜计算尺度研究[J]. 地理与地理信息科学, 2012, 28(4):8-12.
[
|
| [38] |
崔杨林, 高祥, 董斌, 等. 县域景观生态风险评价[J]. 浙江农林大学学报, 2021, 38(3):541-551.
[
|
| [39] |
谢花林. 基于景观结构的土地利用生态风险空间特征分析——以江西兴国县为例[J]. 中国环境科学, 2011, 31(4):688-695.
[
|
| [40] |
荆玉平, 张树文, 李颖. 基于景观结构的城乡交错带生态风险分析[J]. 生态学杂志, 2008, 27(2):229-234.
[
|
| [41] |
徐涵秋. 城市遥感生态指数的创建及其应用[J]. 生态学报, 2013, 33(24):7853-7862.
[
|
| [42] |
|
| [43] |
|
| [44] |
巴彦淖尔市地方志编纂委员会. 巴彦淖尔年鉴-2020[M]. 北京: 九州出版社, 2020.
[Bayannaoer Local Chronicles Compilation Committee. Bayannaoer Yearbook[M]. Beijing: Kyushu Press, 2020.] DOI:10.38624/y.cnki.ybyze.2021.000001
|
| [45] |
王钰, 胡宝清. 西江流域生态脆弱性时空分异及其驱动机制研究[J]. 地球信息科学学报, 2018, 20(7):947-956.
[
|
| [46] |
|
| [47] |
徐涵秋, 邓文慧. MRSEI指数的合理性分析及其与RSEI指数的区别[J]. 遥感技术与应用, 2022, 37(1):1-7.
[
|
| [48] |
|
| [49] |
蔡博峰, 于嵘. 基于遥感的植被长时序趋势特征研究进展及评价[J]. 遥感学报, 2009, 13(6):1170-1186.
[
|
| [50] |
|
| [51] |
张保龙, 于亮亮, 赵宇新, 等. 乌梁素海流域近60年气候变化特征研究[J]. 宁夏工程技术, 2021, 20(4):289-294,303.
[
|
| [52] |
迟文峰, 匡文慧, 党晓宏, 等. 基于遥感的内蒙古地级市土地覆盖结构时空变化特征分析[J]. 遥感技术与应用, 2019, 34(1):33-45.
[
|
| [53] |
王新民, 温挨树, 王海军, 等. 自然与人工创造的奇迹乌梁素海流域生态治理启示录[J]. 人与生物圈, 2021(1):49-53.
[
|
| [54] |
霍亮. 黄河流域乌梁素海生态修复与保护的实践[C]. 2021第九届中国水生态大会论文集.西安, 2021:221-224.
[
|
| [55] |
|
| [56] |
|
| [57] |
林妍敏, 南雄雄, 胡志瑞, 等. 西北典型生态脆弱区植被覆盖度时空变化及其生态安全评价:以宁夏贺兰山为例[J]. 生态与农村环境学报, 2022, 38(5):599-608.
[
|
| [58] |
张泽, 胡宝清, 丘海红, 等. 桂西南喀斯特-北部湾海岸带生态环境脆弱性时空分异与驱动机制研究[J]. 地球信息科学学报, 2021, 23(3):456-466.
[
|
| [59] |
|
| [60] |
|
| [61] |
|
| [62] |
|
| [63] |
|
| [64] |
汪东川, 陈星, 孙志超, 等. 格尔木长时间序列遥感生态指数变化监测[J]. 生态学报, 2022, 42(14):5922-5933.
[
|
/
| 〈 |
|
〉 |