
退化环境下LiDAR里程计定位方法
|
徐爱功(1963— ),男,山东日照人,博士,教授,主要研究方向为全球卫星定位系统、地理信息系统及智能交通系统的集成与应用。E-mail: xu_ag@126.com |
Copy editor: 蒋树芳 , 黄光玉
收稿日期: 2024-01-17
修回日期: 2024-03-07
网络出版日期: 2024-10-09
基金资助
国家自然科学基金项目(42074012)
辽宁省“兴辽英才计划”项目(XLYC2002101)
辽宁省“兴辽英才计划”项目(XLYC2008034)
LiDAR Odometry Positioning Method for Degenerate Environment
Received date: 2024-01-17
Revised date: 2024-03-07
Online published: 2024-10-09
Supported by
National Natural Science Foundation of China(42074012)
Liaoning Revitalization Talents Program(XLYC2002101)
Liaoning Revitalization Talents Program(XLYC2008034)
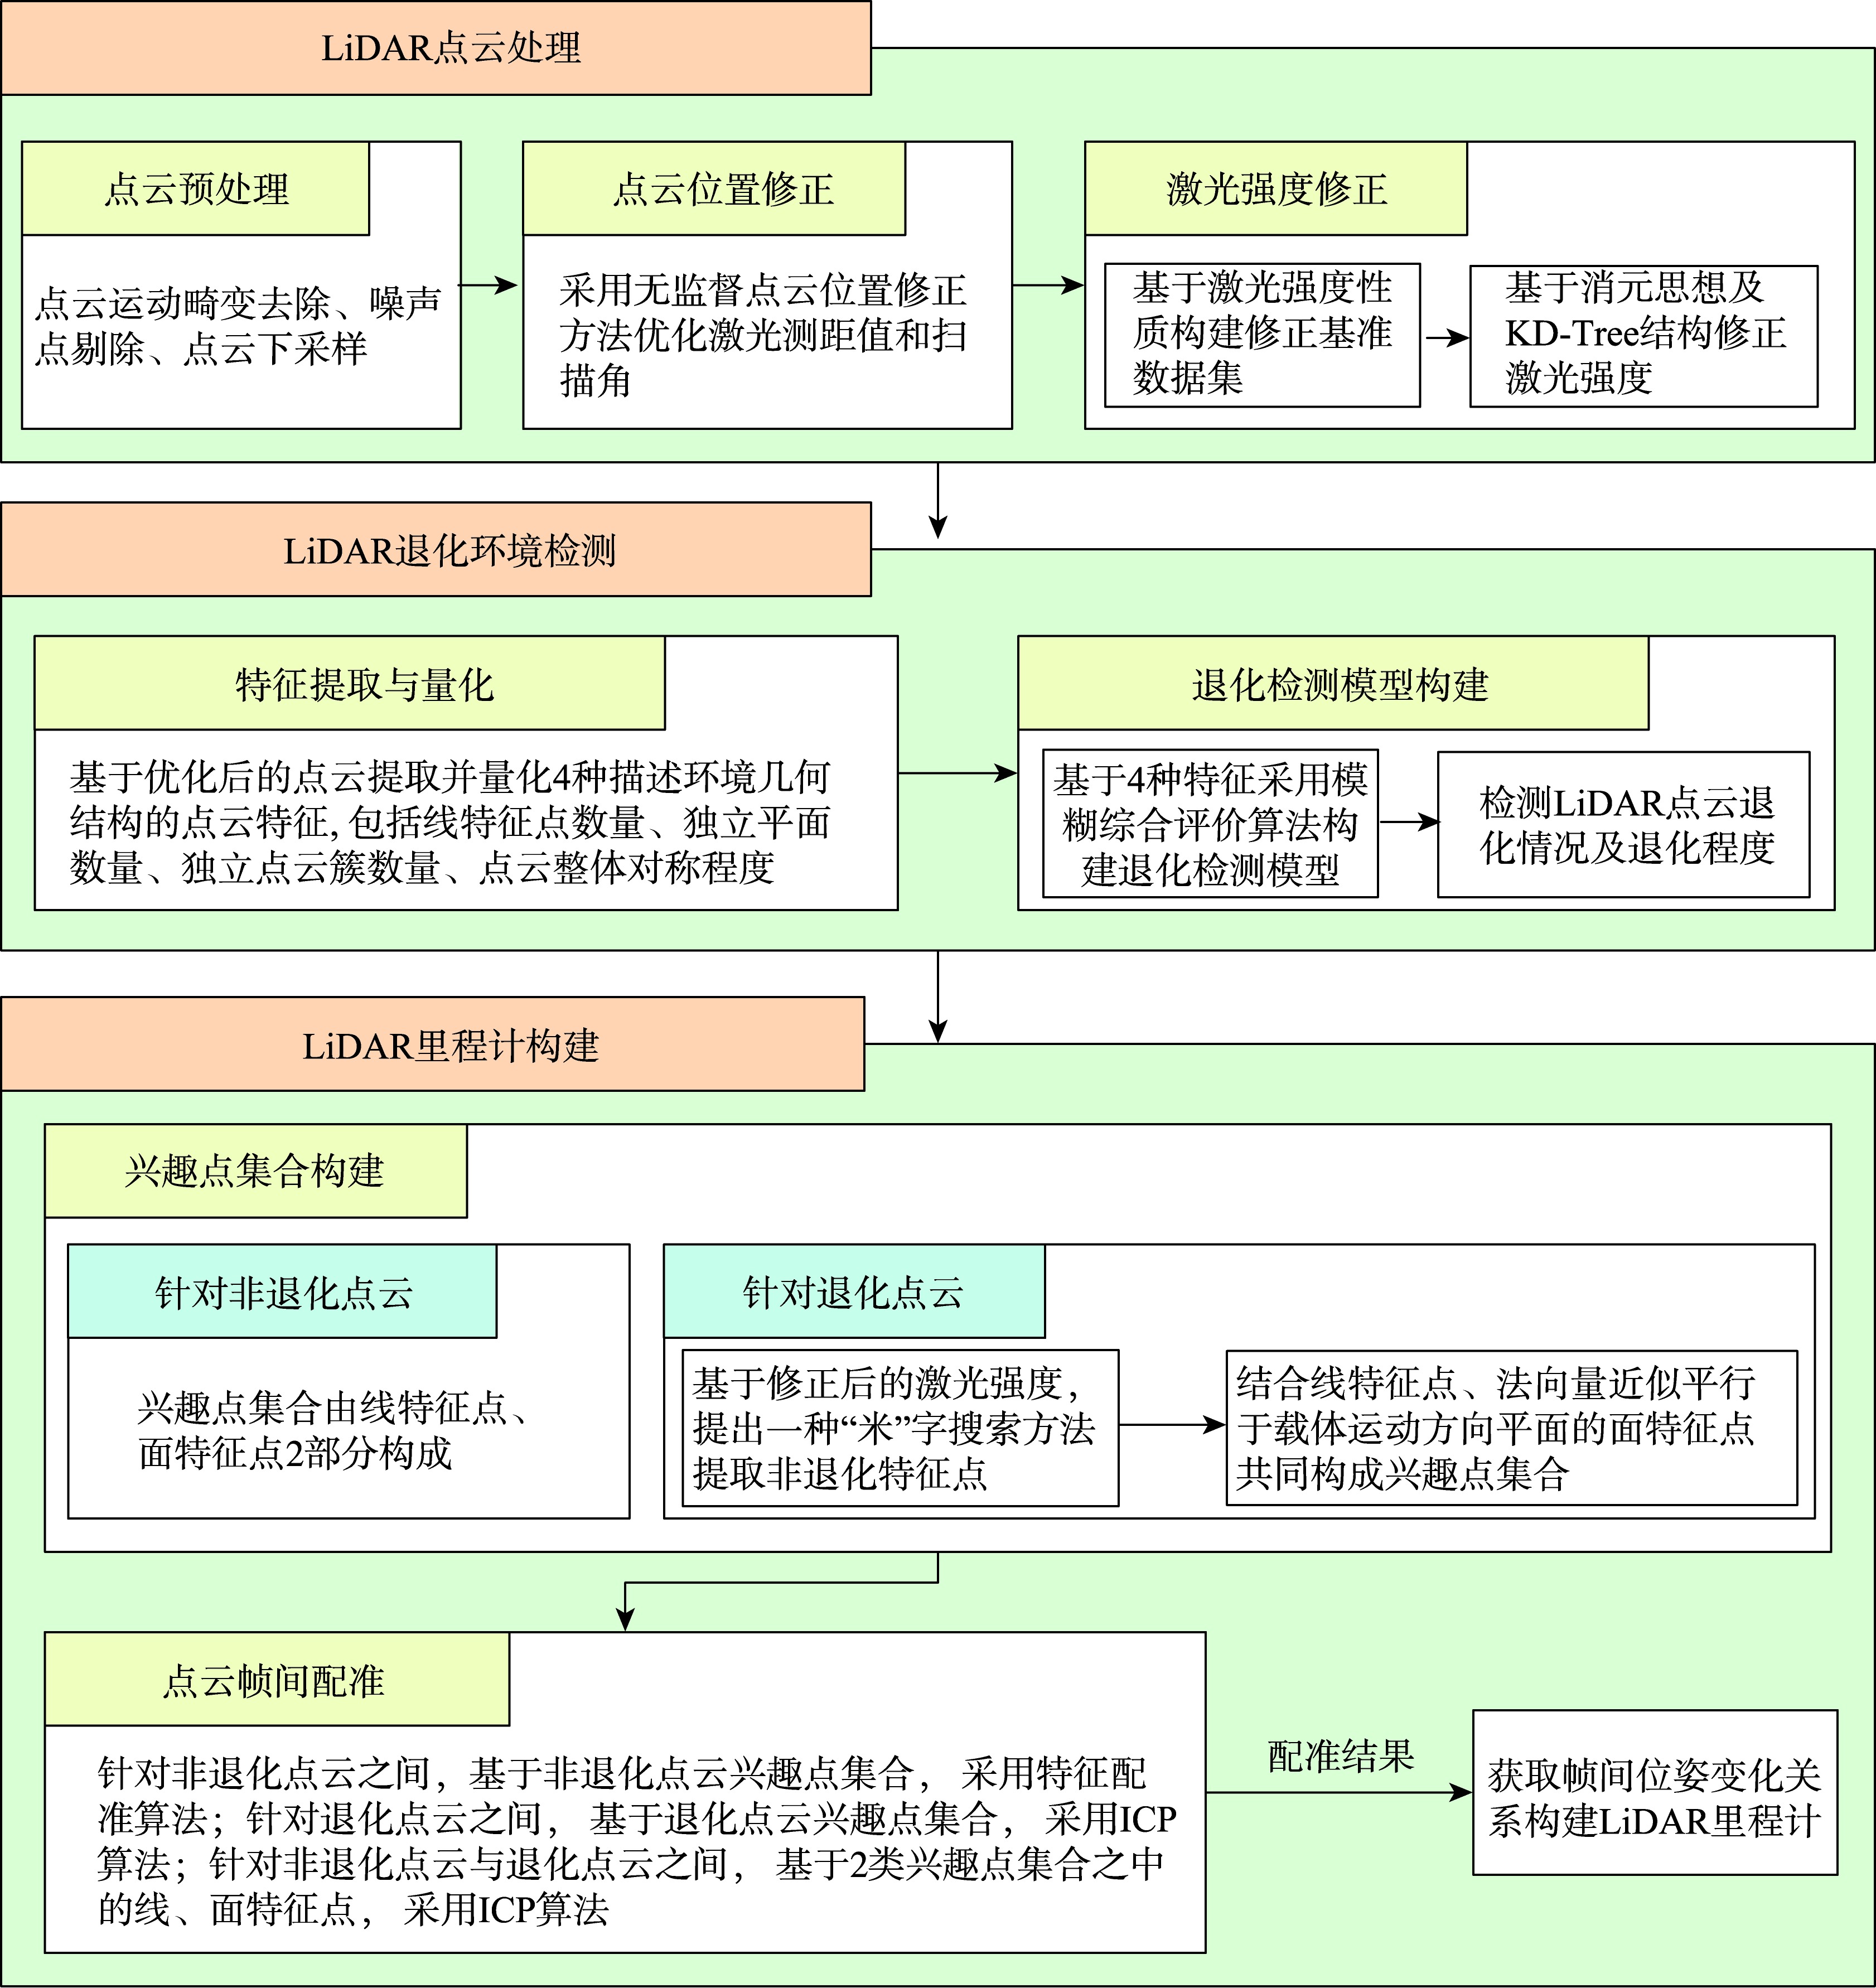
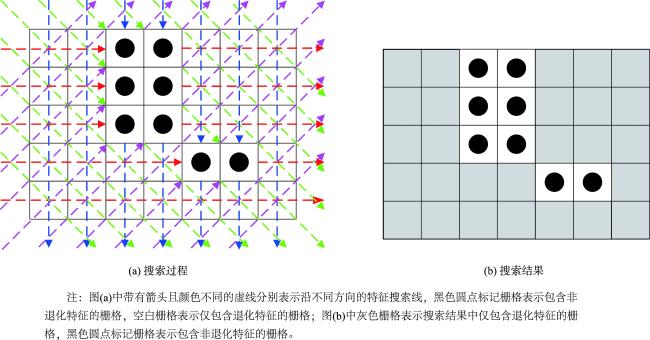
针对基于常见点云帧间配准算法所构建的传统LiDAR里程计在退化环境中定位鲁棒性差的问题,本文借助修正后的激光强度提出了一种面向退化环境的LiDAR里程计定位方法,并提出了一种准确的LiDAR退化环境检测方法。首先,基于激光强度性质和消元思想提出一种强度修正方法,并采用无监督位置修正方法共同优化原始点云。以此为基础,提取4种点云特征并采用模糊综合评价方法准确地检测每帧点云的退化情况。针对非退化点云,提取线、面特征构建兴趣点集合;针对退化点云,借助激光强度并提出一种“米字搜索”方法提取非退化特征,同有效的线、面特征构建兴趣点集合。最后,通过合适的配准算法处理帧间兴趣点集合,从而构建鲁棒的LiDAR里程计。实验结果表明,本文方法修正激光强度的正确率为93.34%; LiDAR退化点云正确检测率为98.58%,非退化点云错误检测率仅为2.24%;本文提出的LiDAR里程计定位方法相较于基于特征配准算法和ICP算法所构建的LiDAR里程计,定位均方根误差分别降低了90.00%、83.96%,最大误差分别降低了86.23%、79.07%,单次帧间配准所需时长为0.006 9 s,有效地提高了退化环境中传统LiDAR里程计的定位精度,并兼顾了数据处理效率;相较于同领域的对比方法,本文方法展现出了更显著的优势。
徐爱功 , 高佳鑫 , 隋心 , 王长强 , 史政旭 . 退化环境下LiDAR里程计定位方法[J]. 地球信息科学学报, 2024 , 26(10) : 2316 -2334 . DOI: 10.12082/dqxxkx.2024.240035
Simultaneous Localization and Mapping (SLAM) based on Light Detection and Ranging (LiDAR) is one of the core technologies widely used in the field of indoor and outdoor integrated positioning and spatial data acquisition. It has the advantage of strong anti-interference without considering light conditions. However, in degenerate environments lacking geometric features, the traditional LiDAR odometry based on feature registration algorithm or Iterative Closest Point (ICP) algorithm usually produce inaccurate results. To address the above problem, this paper proposes a LiDAR odometer positioning method for degenerate environments using modified laser intensity and an accurate LiDAR degenerate environment detection method. Firstly, an intensity correction method is proposed based on laser intensity properties and the elimination idea, and an unsupervised position correction method is used to jointly optimize the original point cloud. Based on this, four point cloud features are extracted, and the fuzzy comprehensive evaluation method is used to accurately detect the degradation of each frame point cloud. For well-conditioned point clouds, line and surface features are extracted to construct the interest point set. For degenerate point clouds, a " MI word search " method is proposed to extract well-conditioned features based on laser intensity, and the interest point set is constructed with effective line and surface features. Finally, the robust LiDAR odometry is constructed by processing the inter-frame interest point sets through suitable registration algorithms. The experimental results show that the correct rate of laser intensity correction is 93.34 %. The correct detection rate of LiDAR degenerate point cloud is 98.58 %, and the error detection rate of well-conditioned point cloud is only 2.24 %. Compared with the LiDAR odometry based on feature registration algorithm and ICP algorithm, the positioning Root Mean Square Error (RMSE) of the LiDAR odometry positioning method proposed in this paper is reduced by 90.00% and 83.96%, respectively, and the Maximum Error (MAXE) is reduced by 86.23 % and 79.07 %, respectively. The time required for single inter-frame registration is 0.006 9 s, which effectively improves the positioning accuracy of traditional LiDAR odometry in degenerate environment while maintaining data processing efficiency. Compared with the other methods in the same field, our method shows more significant advantages. In addition, since the method in this paper is completely innovated and improved on the basis of traditional LiDAR odometer, it has a low overall complexity and significant advantages in terms of secondary development and portability.
表1 激光强度修正效果Tab. 1 Laser intensity correction effect |
| 评价对象及参数 | 第1帧 | 第2帧 | 第3帧 | 第4帧 | 第5帧 | 第6帧 | 第7帧 | 第8帧 | 均值 | |
|---|---|---|---|---|---|---|---|---|---|---|
| 墙面 | 基准点云数/个 | 1 137 | 1 360 | 1 557 | 1 609 | 1 438 | 1 931 | 1 740 | 2 043 | 1 602 |
| 修正点云数/个 | 1 096 | 1 196 | 1 458 | 1 496 | 1 223 | 1 825 | 1 556 | 1 866 | 1 465 | |
| 修正正确率/% | 96.39 | 87.94 | 93.64 | 92.98 | 85.05 | 94.51 | 89.43 | 91.34 | 91.41 | |
| 地砖 | 基准点云数/个 | 1 461 | 1 409 | 1 421 | 1 437 | 1 413 | 1 690 | 1 612 | 1 592 | 1 504 |
| 修正点云数/个 | 1 436 | 1 369 | 1 401 | 1 416 | 1 378 | 1 585 | 1 576 | 1 507 | 1 459 | |
| 修正正确率/% | 98.29 | 97.16 | 98.59 | 98.54 | 97.52 | 93.79 | 97.77 | 94.66 | 97.04 | |
| 纸板 | 基准点云数/个 | 866 | 848 | 720 | 652 | 661 | 739 | 957 | 932 | 797 |
| 修正点云数/个 | 788 | 818 | 673 | 607 | 630 | 701 | 903 | 886 | 751 | |
| 修正正确率/% | 90.99 | 96.46 | 93.47 | 93.10 | 95.31 | 94.86 | 94.36 | 95.06 | 94.20 | |
| 木板 | 基准点云数/个 | 292 | 225 | 187 | 288 | 239 | 482 | 245 | 391 | 294 |
| 修正点云数/个 | 265 | 219 | 159 | 252 | 207 | 410 | 235 | 376 | 265 | |
| 修正正确率/% | 90.75 | 97.33 | 85.03 | 87.50 | 86.61 | 85.06 | 95.92 | 96.16 | 90.14 | |
| 铁皮箱 | 基准点云数/个 | 395 | 737 | 843 | 869 | 239 | 545 | 1 102 | 958 | 711 |
| 修正点云数/个 | 369 | 681 | 785 | 867 | 214 | 466 | 916 | 829 | 641 | |
| 修正正确率/% | 93.42 | 92.40 | 93.12 | 99.77 | 89.54 | 85.50 | 83.12 | 86.53 | 90.43 | |
| 人 | 基准点云数/个 | 1 315 | 473 | 304 | 292 | 378 | 382 | 535 | 241 | 490 |
| 修正点云数/个 | 651 | 283 | 177 | 135 | 167 | 218 | 244 | 82 | 245 | |
| 修正正确率/% | 49.51 | 59.83 | 58.22 | 46.23 | 44.18 | 57.07 | 45.61 | 34.02 | 49.33 | |
| 求和 | 基准点云数/个 | 5 466 | 5 052 | 5 032 | 5 147 | 4 368 | 5 769 | 6 191 | 6 157 | 5 398 |
| 修正点云数/个 | 4 605 | 4 566 | 4 653 | 4 773 | 3 819 | 5 205 | 5 430 | 5 546 | 4 826 | |
| 修正正确率/% | 84.25 | 90.38 | 92.47 | 92.73 | 87.43 | 90.22 | 87.71 | 90.08 | 89.40 | |
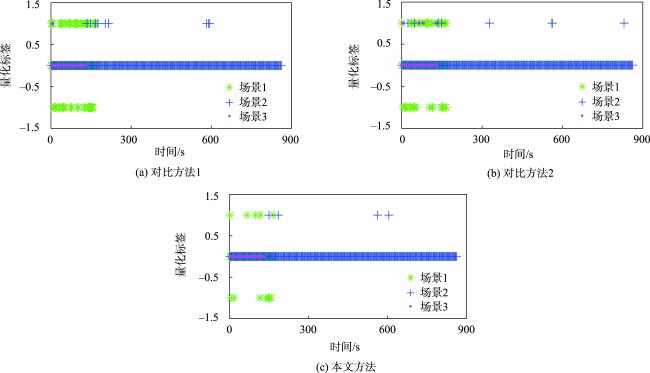
表2 退化检测精度与效率对比Tab. 2 Comparison of degradation detection accuracy and efficiency |
| 指标类型 | 实验场景 | 对比方法1 | 对比方法2 | 本文方法 |
|---|---|---|---|---|
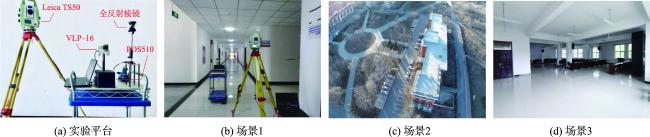
| 退化点 云漏检 数量/帧 | 场景1 | 110 | 42 | 20 |
| 场景2 | - | - | - | |
| 场景3 | - | - | - | |
| 均值 | 110 | 42 | 20 | |
| 非退化 点云误 检数量 /帧 | 场景1 | 199 | 48 | 17 |
| 场景2 | 23 | 18 | 6 | |
| 场景3 | 11 | 12 | 0 | |
| 均值 | 78 | 26 | 8 | |
| 退化点 云正确 检测率/% | 场景1 | 92.20 | 97.02 | 98.58 |
| 场景2 | - | - | - | |
| 场景3 | - | - | - | |
| 均值 | 92.20 | 97.02 | 98.58 | |
| 非退化 点云错 误检测 率/% | 场景1 | 77.73 | 18.75 | 6.64 |
| 场景2 | 0.27 | 0.21 | 0.07 | |
| 场景3 | 0.83 | 0.91 | 0.00 | |
| 均值 | 26.28 | 6.62 | 2.24 | |
| 检测 效率/s | 场景1 | 0.013 5 | 0.007 6 | 0.010 3 |
| 场景2 | 0.015 6 | 0.008 3 | 0.011 2 | |
| 场景3 | 0.013 8 | 0.006 7 | 0.009 6 | |
| 均值 | 0.014 3 | 0.007 5 | 0.010 4 |
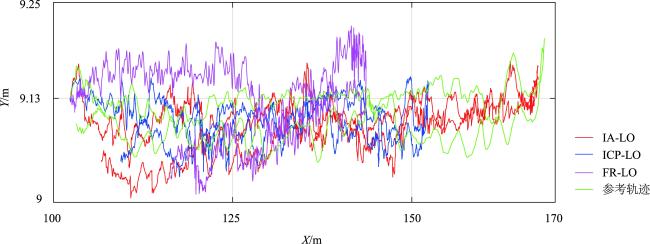
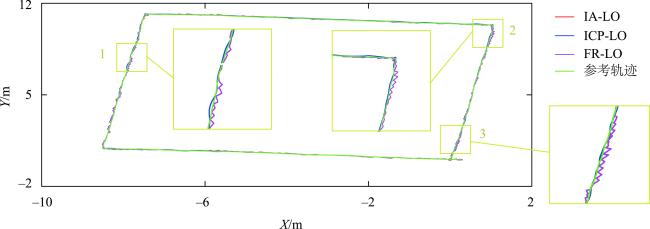
图7 场景1中3种里程计的X-Y平面二维定位轨迹对比Fig. 7 Comparison of X-Y plane positioning trajectory of three odometries in scene 1 |
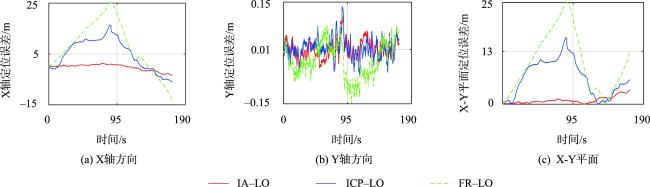
图8 场景1中3种里程计的二维定位误差对比Fig. 8 Comparison of two-dimensional positioning errors of three odometries in scene 1 |
表3 场景1中3种里程计的二维定位精度和处理效率对比Tab. 3 Comparison of two-dimensional positioning accuracy and processing efficiency of three odometries in scene 1 |
| 指标类型 | IA-LO | ICP-LO | FR-LO | |
|---|---|---|---|---|
| X轴 | RMSE/m | 1.266 4 | 7.895 0 | 12.666 8 |
| MAXE/m | 3.435 9 | 16.417 4 | 24.950 2 | |
| Y轴 | RMSE/m | 0.030 2 | 0.032 6 | 0.054 9 |
| MAXE/m | 0.109 4 | 0.136 3 | 0.149 2 | |
| X-Y 平面 | RMSE/m | 1.266 7 | 7.895 1 | 12.666 9 |
| MAXE/m | 3.436 0 | 16.417 5 | 24.950 2 | |
| 运算效率/s | 0.006 9 | 0.065 9 | 0.001 9 | |
图9 场景3中3种里程计的X-Y平面二维定位轨迹对比Fig. 9 Comparison of X-Y plane positioning trajectory of three odometries in scene 3 |
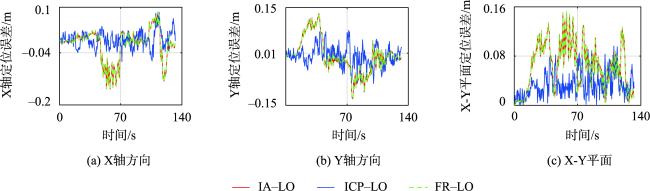
图10 场景3中3种里程计的二维定位误差对比Fig. 10 Comparison of two-dimensional positioning errors of three odometries in scene 3 |
表4 场景3中3种里程计的二维定位精度和处理效率对比Tab. 4 Comparison of two-dimensional positioning accuracy and processing efficiency of three odometries in scene 3 |
| 指标类型 | IA-LO | ICP-LO | FR-LO | |
|---|---|---|---|---|
| X轴 | RMSE/m | 0.051 5 | 0.025 4 | 0.051 5 |
| MAXE/m | 0.151 6 | 0.085 0 | 0.151 6 | |
| Y轴 | RMSE/m | 0.053 1 | 0.030 6 | 0.053 1 |
| MAXE/m | 0.132 0 | 0.083 2 | 0.132 0 | |
| X-Y 平面 | RMSE/m | 0.073 9 | 0.039 8 | 0.073 9 |
| MAXE/m | 0.152 2 | 0.096 2 | 0.152 2 | |
| 运算效率/s | 0.001 8 | 0.064 8 | 0.001 8 | |
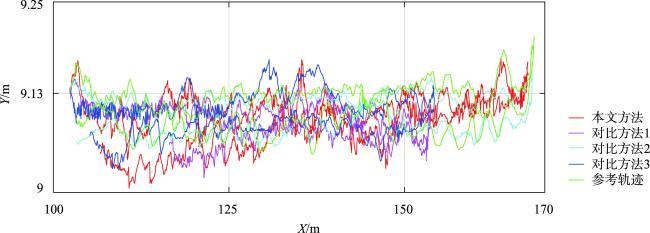
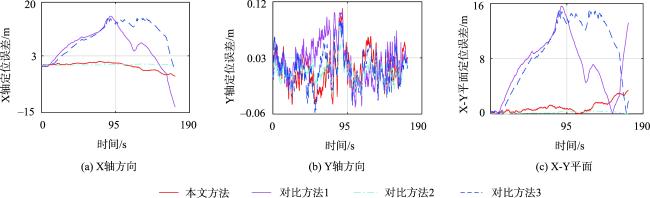
图11 4种方法的X-Y平面二维定位轨迹对比Fig. 11 Comparison of X-Y plane positioning trajectory of four methods |
图12 4种方法的二维定位误差对比Fig. 12 Comparison of two-dimensional positioning errors of four methods |
表5 4种方法的二维定位精度和处理效率对比Tab. 5 Comparison of two-dimensional positioning accuracy and processing efficiency of four methods |
| 指标类型 | IA-LO | 对比方法1 | 对比方法2 | 对比方法3 | |
|---|---|---|---|---|---|
| X轴 | RMSE/m | 1.266 4 | 7.045 8 | 0.164 3 | 6.054 8 |
| MAXE/m | 3.435 9 | 15.607 4 | 0.406 6 | 14.977 9 | |
| Y轴 | RMSE/m | 0.030 2 | 0.034 5 | 0.017 4 | 0.029 1 |
| MAXE/m | 0.109 4 | 0.102 9 | 0.077 6 | 0.088 4 | |
| X-Y 平面 | RMSE/m | 1.266 7 | 7.066 2 | 0.215 8 | 6.268 1 |
| MAXE/m | 3.436 0 | 15.608 0 | 0.406 8 | 14.978 0 | |
| 运算效率/s | 0.006 9 | 0.005 6 | 0.002 8 | 0.005 1 | |
表6 本文方法相较于3种对比方法的X-Y平面二维定位误差及运算效率的变化程度Tab. 6 The change degree of X-Y plane two-dimensional positioning error and operation efficiency of our method compared with the three comparison methods (%) |
| 对比方法类型 | X-Y平面的 定位RMSE | X-Y平面的 定位MAXE | 运算效率 |
|---|---|---|---|
| 对比方法1 | 降低了82.07 | 降低了77.99 | 降低了23.21 |
| 对比方法2 | 升高了486.98 | 升高了744.64 | 降低了146.43 |
| 对比方法3 | 降低了79.79 | 降低了77.06 | 降低了35.29 |
| [1] |
|
| [2] |
李帅鑫, 李九人, 田滨, 等. 面向点云退化的隧道环境的无人车激光SLAM方法[J]. 测绘学报, 2021, 50(11):1487-1499.
[
|
| [3] |
|
| [4] |
|
| [5] |
|
| [6] |
|
| [7] |
|
| [8] |
|
| [9] |
|
| [10] |
|
| [11] |
|
| [12] |
|
| [13] |
张亮, 刘智宇, 曹晶瑛, 等. 扫地机器人增强位姿融合的Cartographer算法及系统实现[J]. 软件学报, 2020, 31(9):2678-2690.
[
|
| [14] |
|
| [15] |
|
| [16] |
|
| [17] |
|
| [18] |
|
| [19] |
周治国, 邸顺帆. 基于强度扫描上下文回环检测的激光雷达SLAM算法[J]. 中国惯性技术学报, 2022, 30(6):738-745.
[
|
| [20] |
|
| [21] |
何东, 宋沙磊, 王滨辉, 等. 多光谱激光雷达数据强度校正及点云色彩优化[J]. 中国激光, 2021, 48(11):199-207.
[
|
| [22] |
|
| [23] |
王丽英, 赵元丁. 一种灰度体素结构分割模型下的机载LiDAR 3D滤波算法[J]. 地球信息科学学报, 2020, 22(11):2118-2127.
[
|
| [24] |
徐爱功, 高佳鑫, 隋心, 等. 惯性测量单元辅助的LiDAR动态点云剔除方法[J]. 测绘科学, 2023, 48(5):173-182.
[
|
| [25] |
|
| [26] |
程效军, 郭王, 李泉, 等. 基于强度与颜色信息的地面LiDAR点云联合分类方法[J]. 中国激光, 2017, 44(10):273-280.
[
|
| [27] |
|
| [28] |
李沛婷, 赵庆展, 陈洪. 回波强度约束下的K-means无人机LiDAR点云聚类滤波[J]. 地球信息科学学报, 2018, 20(4):471-479.
[
|
| [29] |
|
| [30] |
王永波, 盛业华. 一种基于曲率极值法的LiDAR点云特征提取算法[J]. 中国矿业大学学报, 2011, 40(4):640-646.
[
|
| [31] |
刘亚坤, 李永强, 刘会云, 等. 基于改进RANSAC算法的复杂建筑物屋顶点云分割[J]. 地球信息科学学报, 2021, 23(8):1497-1507.
[
|
| [32] |
|
| [33] |
易凤佳, 黄端, 刘建红, 等. 汉江流域湿地变化及其生态健康评价[J]. 地球信息科学学报, 2017, 19(1):70-79.
[
|
| [34] |
孙永福, 吴昊, 林晓言, 等. 铁路建设项目综合评价指标体系与方法[J]. 铁道学报, 2023, 45(9):1-11.
[
|
| [35] |
谭人华, 王艳慧, 关鸿亮. 基于GIS与模糊层次分析法的景观视觉资源综合评价[J]. 地球信息科学学报, 2019, 21(5):663-674.
[
|
| [36] |
|
| [37] |
|
| [38] |
黄先锋, 李娜, 张帆, 等. 利用LiDAR点云强度的十字剖分线法道路提取[J]. 武汉大学学报(信息科学版), 2015, 40(12):1563-1569.
[
|
| [39] |
|
| [40] |
|
/
| 〈 |
|
〉 |