
Journal of Geo-information Science >
A Coupled FLUS and Markov Approach to Simulate the Spatial Pattern of Land Use in Rapidly Developing Cities
Received date: 2021-06-28
Revised date: 2021-09-22
Online published: 2022-03-25
Supported by
National Natural Science Foundation of China(41801306)
National Key Research and Development Program of China(2019YFB2102903)
Copyright
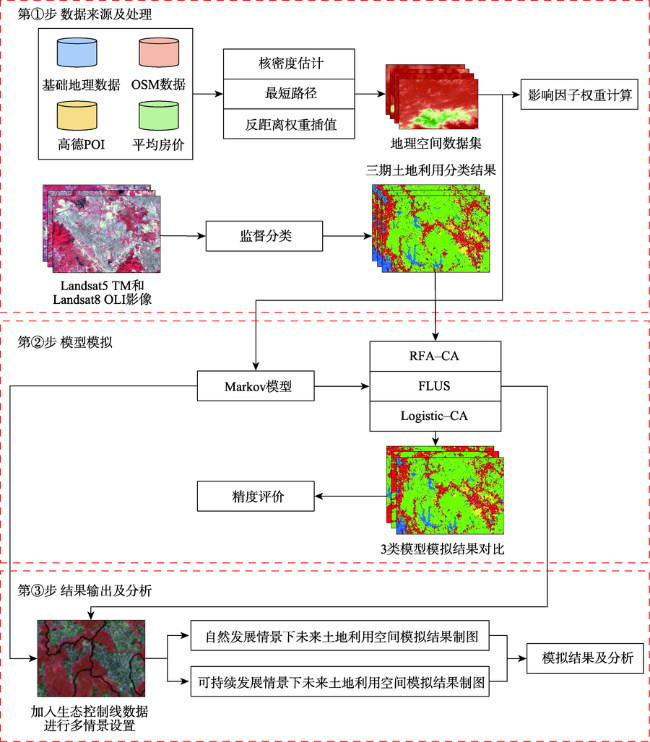
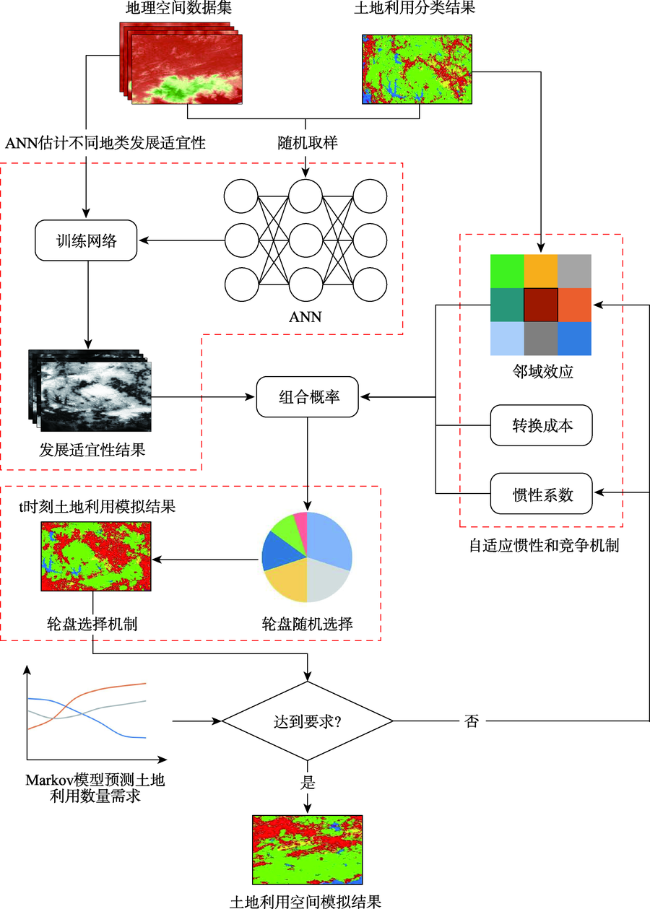
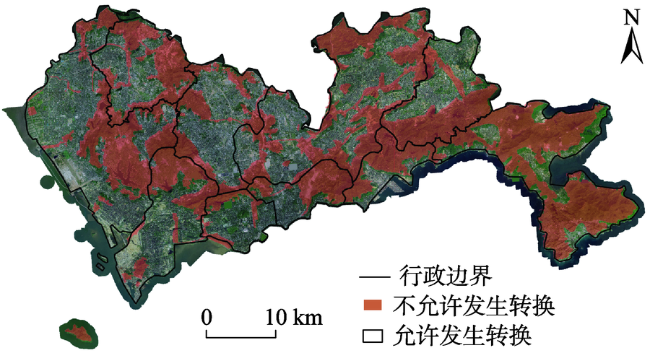
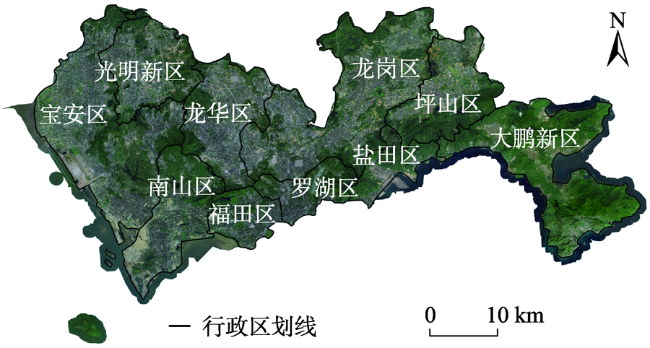
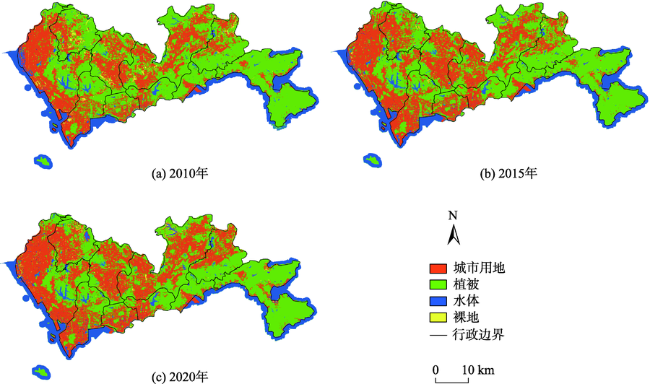
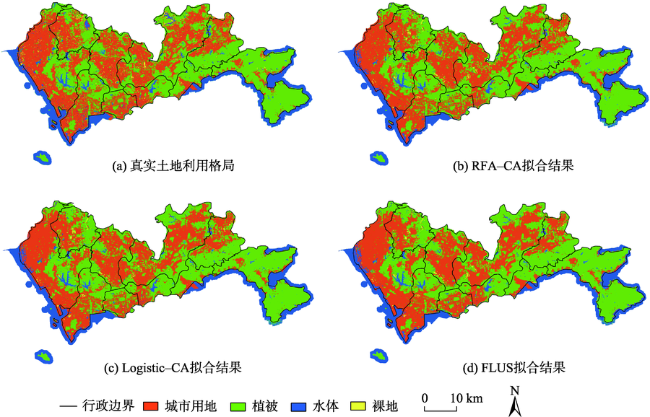
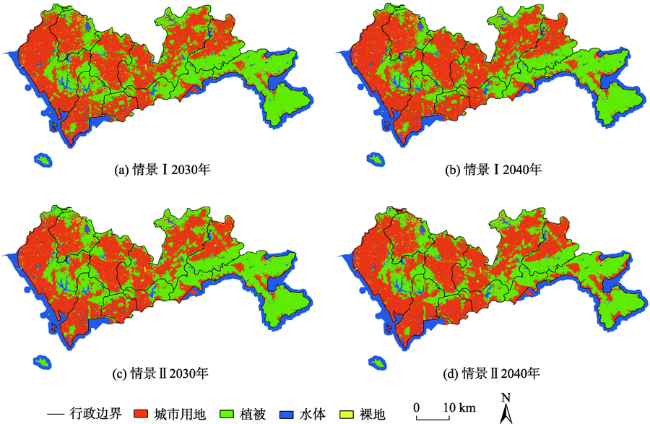
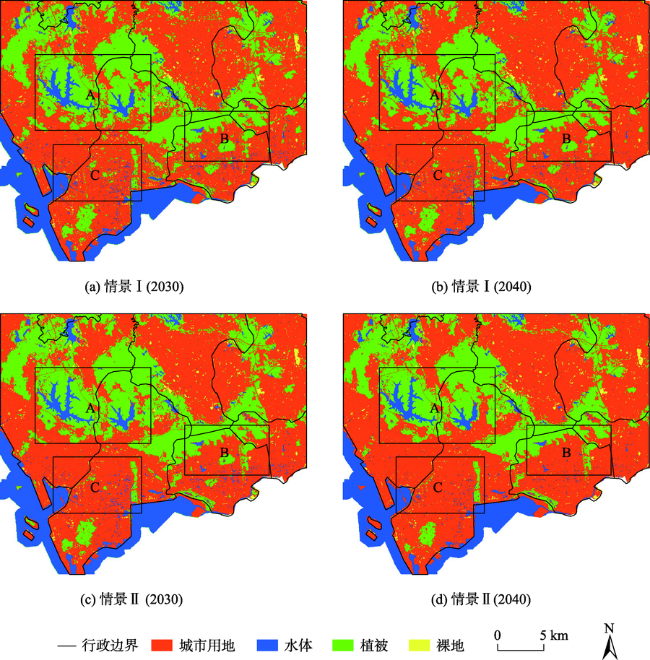
Modeling urban land use change is important for future regional planning and sustainable development. Previous FLUS-based studies are mostly based on larger grid scales. How to simulate the complex land use change processes in rapidly developing cities and explore the driving mechanisms of land use change still need further exploration. This paper constructs an urban land use pattern simulation framework coupled with FLUS and Markov and innovatively introduces house price to characterize socio-economic attributes. We take Shenzhen as the study area to simulate future urban land use spatial patterns under different development scenarios based on small grid scale (30 m) land use classification data and multi-source spatial variables such as basic geography data, road and river networks, and point-of-interest data. Finally, we analyze the land use change drivers using random forest models. The results show that the coupled FLUS and Markov method proposed in this paper has higher accuracy (FoM = 0.22) and simulate the land use change processes more accurately in rapidly developing cities, compared to traditional CA models (RFA-CA and Logistic-CA). The mapping results of multi-scenario land use patterns verify the importance of ecological control lines in the process of urban development, further illustrating the reference value of the proposed simulation framework for future urban planning layout. Hospital infrastructure, entertainment venues, and bus stop, road network density have a greater impact on urban development than natural factors (e.g., elevation, slope), while the distance to coastline limits land use change processes to some extent within Shenzhen. The model constructed in this study and the fine mapping results can provide a reference basis and theoretical foundation for related research on urban regional planning and spatial pattern simulation.

WANG Xudong , YAO Yao , REN Shuliang , SHI Xuguo . A Coupled FLUS and Markov Approach to Simulate the Spatial Pattern of Land Use in Rapidly Developing Cities[J]. Journal of Geo-information Science, 2022 , 24(1) : 100 -113 . DOI: 10.12082/dqxxkx.2022.210359
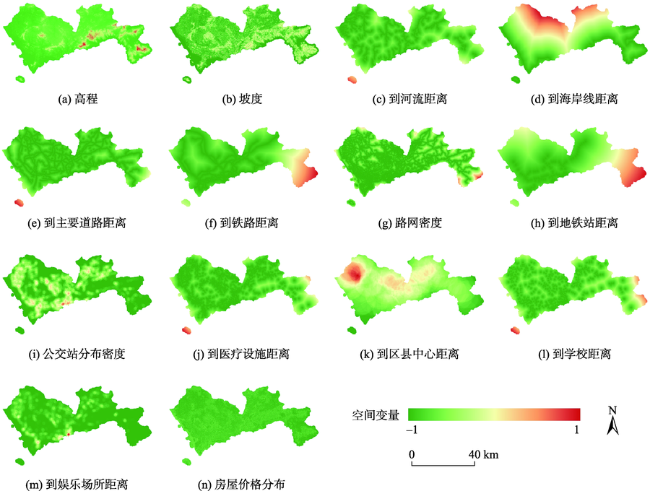
表1 影响因子细节概括Tab. 1 Summary of impact factor details |
| 类别 | 空间变量 | 分辨率/m | 含义 |
|---|---|---|---|
| 自然因素 | 高程/m | 30 | 地形高程条件 |
| 坡度/° | 地形坡度条件 | ||
| 到河流距离/m | 像元几何中心到最近河流的欧氏距离 | ||
| 到海岸线距离/m | 像元几何中心到最近海岸线的欧氏距离 | ||
| 交通因素 | 到主要道路距离/m | 像元几何中心到最近主要道路的欧氏距离 | |
| 到铁路距离/m | 像元几何中心到最近铁路的欧氏距离 | ||
| 路网密度/(km/km2) | 每个像元周边的道路分布密度 | ||
| 到地铁站距离/m | 30 | 像元几何中心到最近地铁站的欧氏距离 | |
| 公交站分布密度/(个/km2) | 每个像元周边的公交站分布密度 | ||
| 社会经济因素 | 到医疗设施距离/m | 像元几何中心到最近医疗设施的欧氏距离 | |
| 到区县中心距离/m | 像元几何中心到最近区县中心的欧氏距离 | ||
| 到学校距离/m | 像元几何中心到最近学校的欧氏距离 | ||
| 到娱乐场所距离/m | 像元几何中心到最近娱乐场所的欧氏距离 | ||
| 房屋价格分布/元 | 30 | 每个像元所在位置的房价精细制图 |
表2 Characteristic weight values of each impact factor at the time of land use changeTab. 2 Resilience evolution comprehensive level assessment of the Harbin-Dalian urban belt |
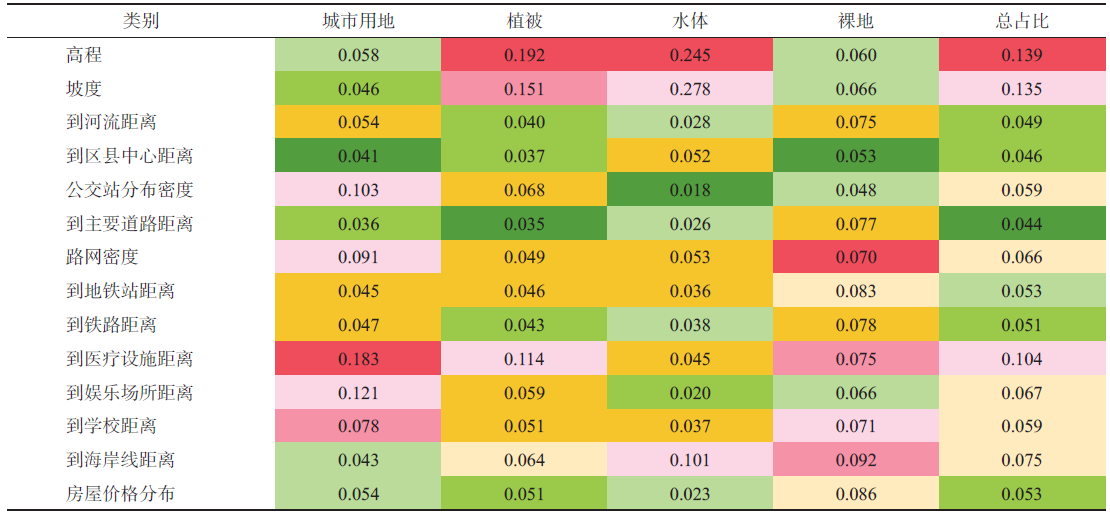 |
注:表中绿-黄-红色阶表征不同影响因子特征权重值由小至大的排序情况。 |
表3 不同模型拟合结果精度对比Tab. 3 Comparison of simulated results accuracy via different models |
| RFA-CA | Logistic-CA | FLUS | |
|---|---|---|---|
| 总体精度 | 0.842 | 0.843 | 0.850 |
| Kappa系数 | 0.744 | 0.746 | 0.757 |
| FoM | 0.198 | 0.198 | 0.220 |
表4 2030、2040年深圳市各类土地利用数量需求Tab. 4 Demand for various types of land use in Shenzhen in 2030 and 2040 (km2) |
| 城市用地 | 植被 | 水体 | 裸地 | |
|---|---|---|---|---|
| 2030年 | 1074.441 | 787.715 | 293.127 | 38.749 |
| 2040年 | 1151.236 | 712.587 | 291.338 | 38.872 |
| [1] |
|
| [2] |
|
| [3] |
|
| [4] |
|
| [5] |
|
| [6] |
|
| [7] |
|
| [8] |
|
| [9] |
|
| [10] |
|
| [11] |
|
| [12] |
|
| [13] |
|
| [14] |
|
| [15] |
|
| [16] |
|
| [17] |
|
| [18] |
朱寿红, 舒帮荣, 马晓冬, 等. 基于"反规划"理念及FLUS模型的城镇用地增长边界划定研究——以徐州市贾汪区为例[J]. 地理与地理信息科学, 2017, 33(5):80-86.
[
|
| [19] |
|
| [20] |
张亚飞, 廖和平, 李义龙. 基于反规划与FLUS模型的城市增长边界划定研究——以重庆市渝北区为例[J]. 长江流域资源与环境, 2019, 28(4):21-31.
[
|
| [21] |
|
| [22] |
|
| [23] |
|
| [24] |
|
| [25] |
|
| [26] |
|
| [27] |
|
| [28] |
|
| [29] |
|
| [30] |
|
| [31] |
李秋萍, 刘逸诗, 巩诗瑶, 等. 基于居民出行活动特征的个体经济水平推断方法[J]. 武汉大学学报·信息科学版, 2019, 44(10):1575-1580.
[
|
| [32] |
|
| [33] |
深圳市统计局, 国家统计局深圳调查队. 深圳统计年鉴[M]. 北京: 中国统计出版社, 2020.
[ Shenzhen Bureau of Statistics, Shenzhen Survey Team of National Bureau of Statistics. Shenzhen Statistical Yearbook[M]. Beijing: China Statistics Press, 2020. ]
|
| [34] |
|
| [35] |
何媛婷, 王石英, 袁再健, 等. 珠江三角洲土地利用变化及其对城市化发展的响应[J]. 生态环境学报, 2020, 29(2):303-310.
[
|
| [36] |
王二红, 冯长春, 张爱华. 深圳市建设用地扩展分析[J]. 城市发展研究, 2015, 22(5):38-44.
[
|
| [37] |
|
| [38] |
|
| [39] |
|
| [40] |
姚尧, 任书良, 王君毅, 等. 卷积神经网络和随机森林的城市房价微观尺度制图方法[J]. 地球信息科学学报, 2019, 21(2):168-177.
[
|
/
| 〈 |
|
〉 |