×
模态框(Modal)标题
在这里添加一些文本
Close
Close
Submit
Cancel
Confirm
×
模态框(Modal)标题
×
Journal
Article
Figure
Search
EN
中文
Home
About Journal
Overview
Indexing
Awards
Editorial Board
Guide for Authors
Editorial Policies
Subscription
Contact Us
EN
中文
Figure/Table detail
Hazard Changes Assessment of Future High Temperature in China based on CMIP6
GUO Chunhua, ZHU Xiufang, ZHANG Shizhe, TANG Mingxiu, XU Kun
Journal of Geo-information Science
, 2022, 24(
7
): 1391-1405. DOI:
10.12082/dqxxkx.2022.210491
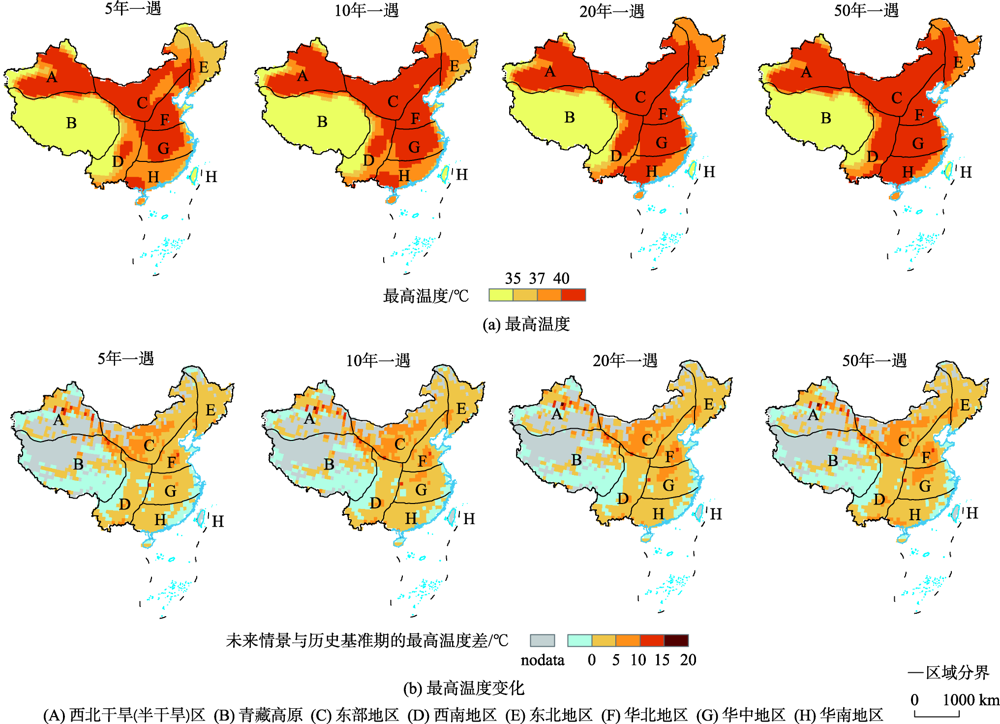
Fig. 6
Distribution map and change map of maximum temperature under the four return periods in the SSP2-4.5 scenario
Other figure/table from this article
Tab. 1
List of 12 models in Coupled Model Intercomparison Project(CMIP6)
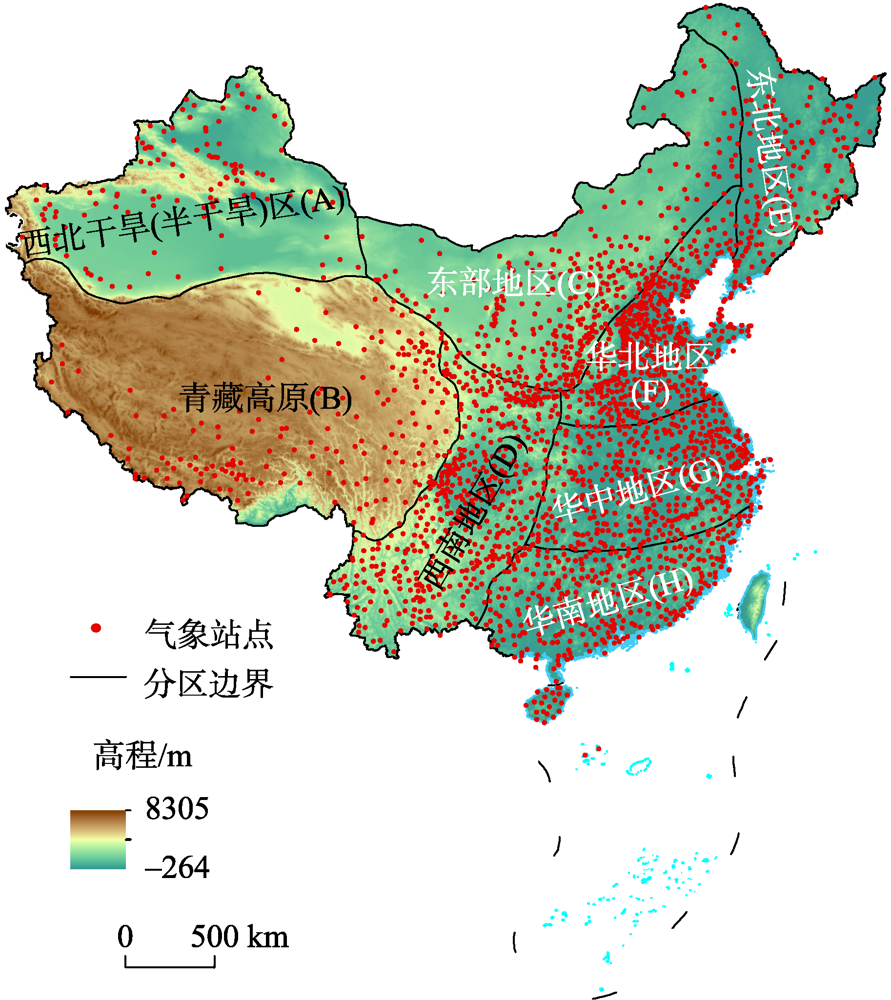
Fig. 1
Distribution of meteorological stations and climate zones in China
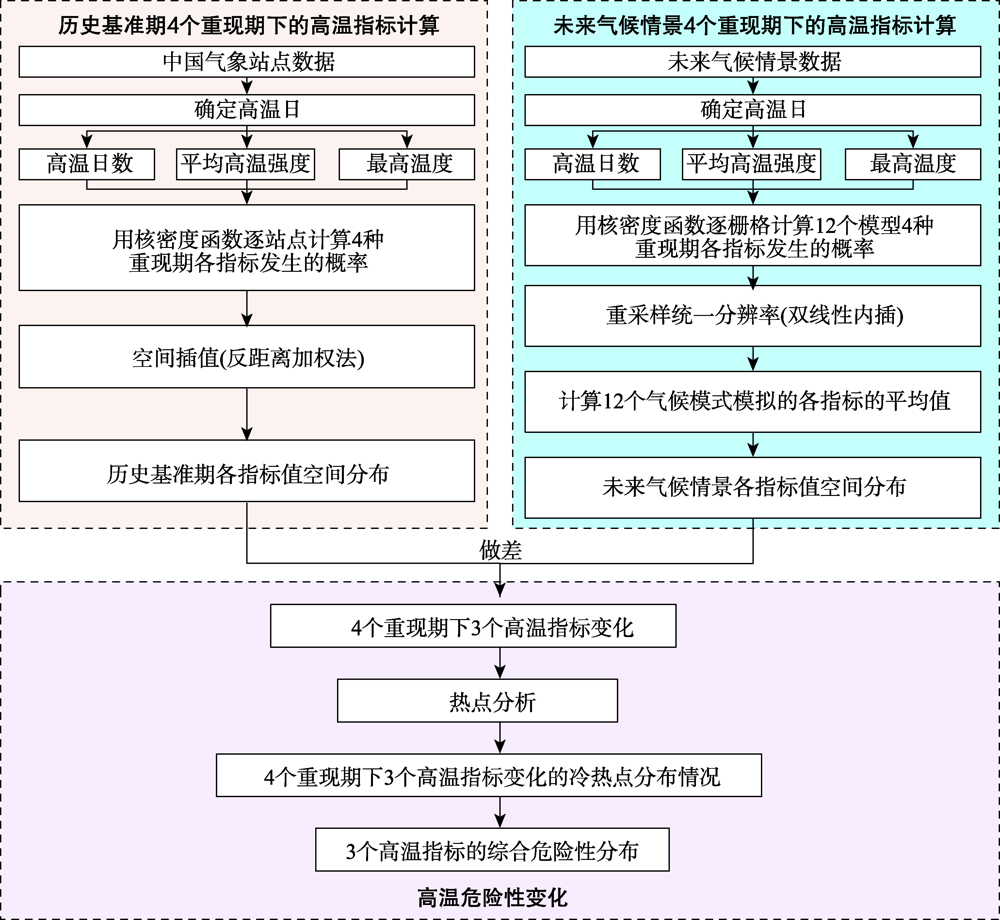
Fig. 2
Technical flowchart of high temperature hazard change assessment
Fig. 3
Taylor program for the observed and CMIP6 simulated mean daily maximum temperature
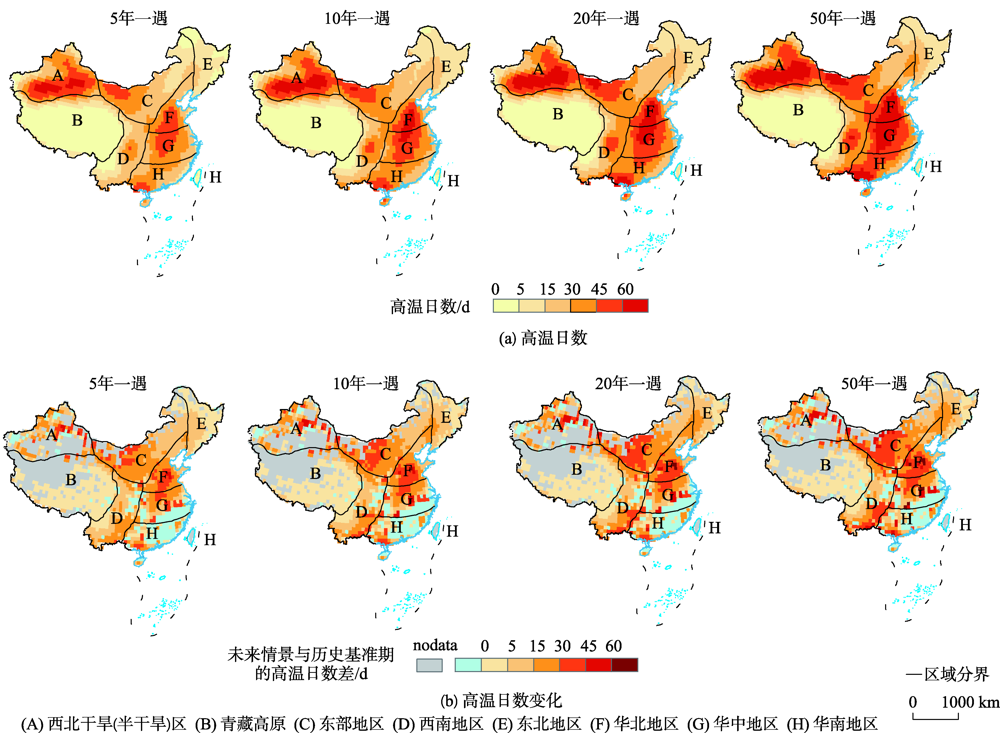
Fig. 4
Distribution map and change map of the number of high temperature days under the four return periods in the SSP2-4.5 scenario
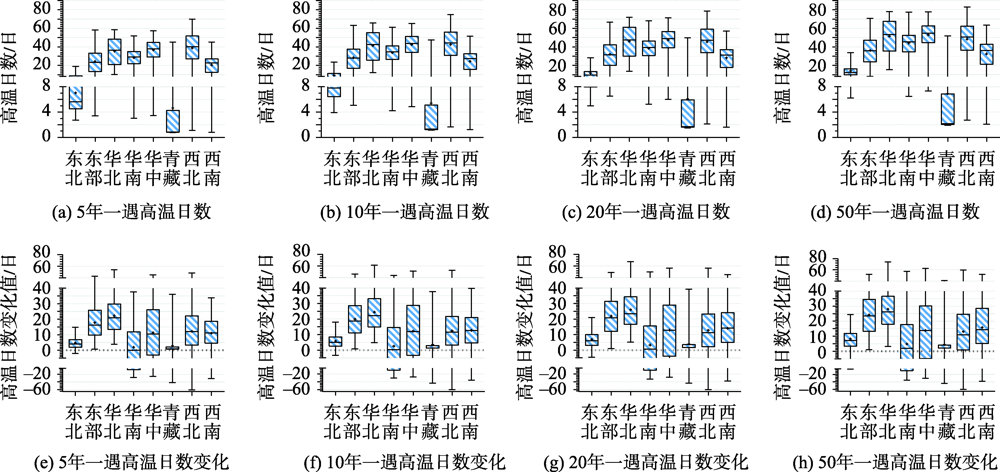
Fig. 5
Statistical diagram of the distribution and change of the number of high temperature days under the four return periods in the SSP2-4.5 scenario
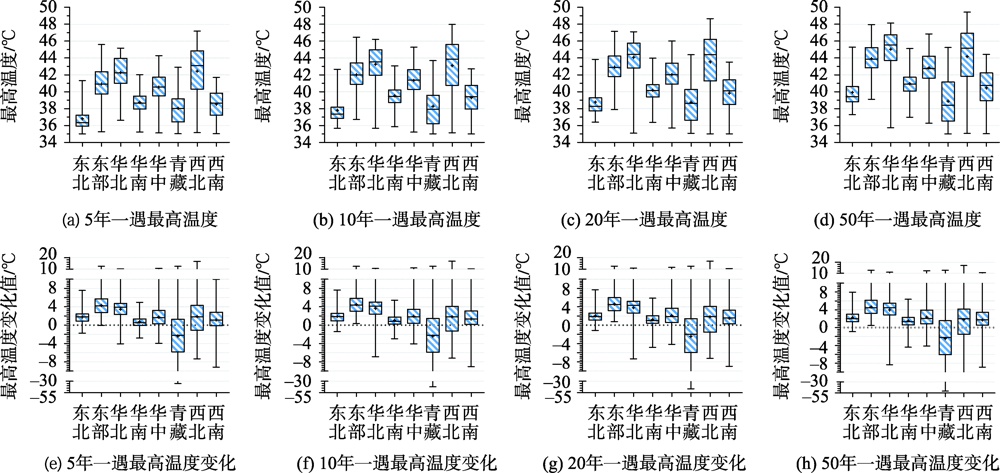
Fig. 7
Statistical diagram of the distribution and change of maximum temperature under the four return periods in the SSP2-4.5 scenario
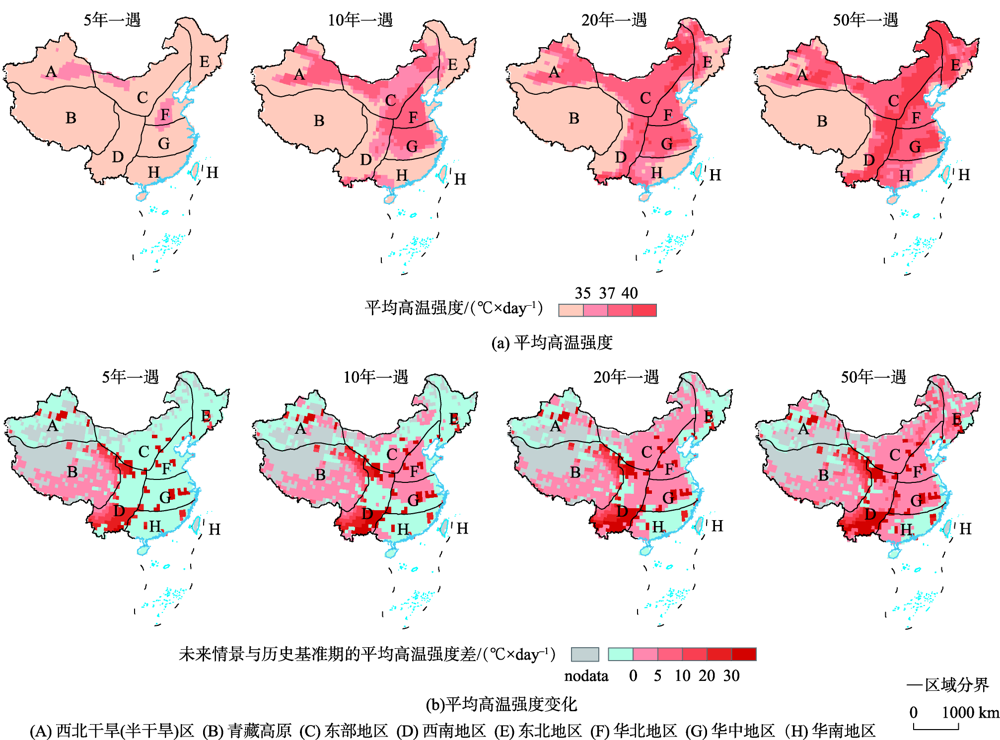
Fig. 8
Distribution map and change map of average high temperature intensity under the four return periods in the SSP2-4.5 scenario
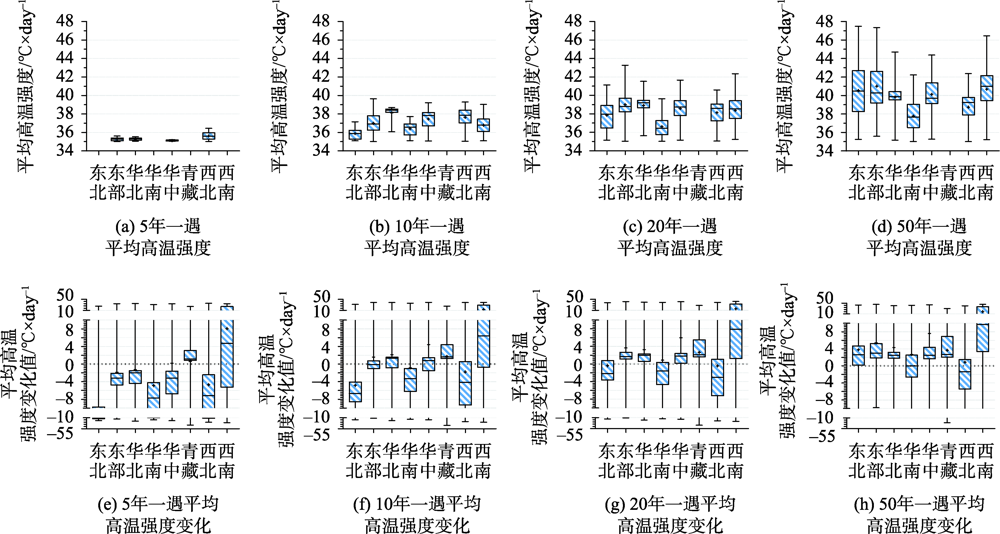
Fig. 9
Statistical diagram of the distribution and change of average high temperature intensity under the four return periods in the SSP2-4.5 scenario
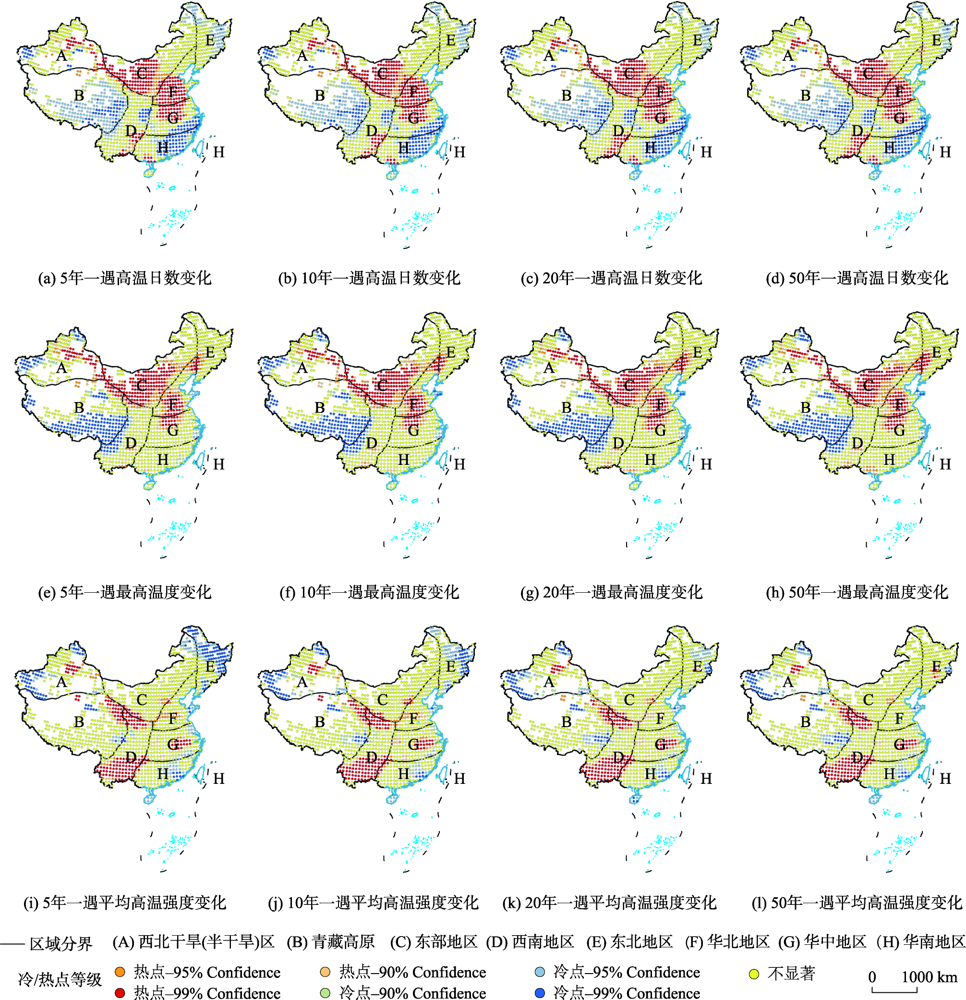
Fig. 10
Distribution map of cold/hot spots of the three high temperature index changes in the four return periods
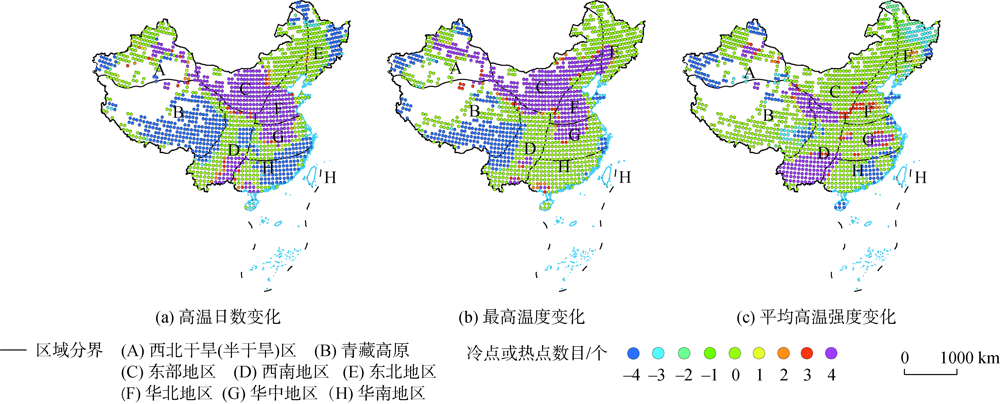
Fig. 11
Distribution map of the cumulative number of cold/hot spots of the three high temperature index changes in the four return periods
Tab. 2
Previous studies