×
模态框(Modal)标题
在这里添加一些文本
Close
Close
Submit
Cancel
Confirm
×
模态框(Modal)标题
×
Journal
Article
Figure
Search
EN
中文
Home
About Journal
Overview
Indexing
Awards
Editorial Board
Guide for Authors
Editorial Policies
Subscription
Contact Us
EN
中文
Figure/Table detail
Spatio-Temporal Evolution of PM
2.5
and Heterogeneity Analysis of Influencing Factors in Three Urban Agglomerations of the Yangtze River Economic Belt
ZHANG Keyi, XIAO Jia, FANG Jian
Journal of Geo-information Science
, 2025, 27(
6
): 1478-1498. DOI:
10.12082/dqxxkx.2025.240617
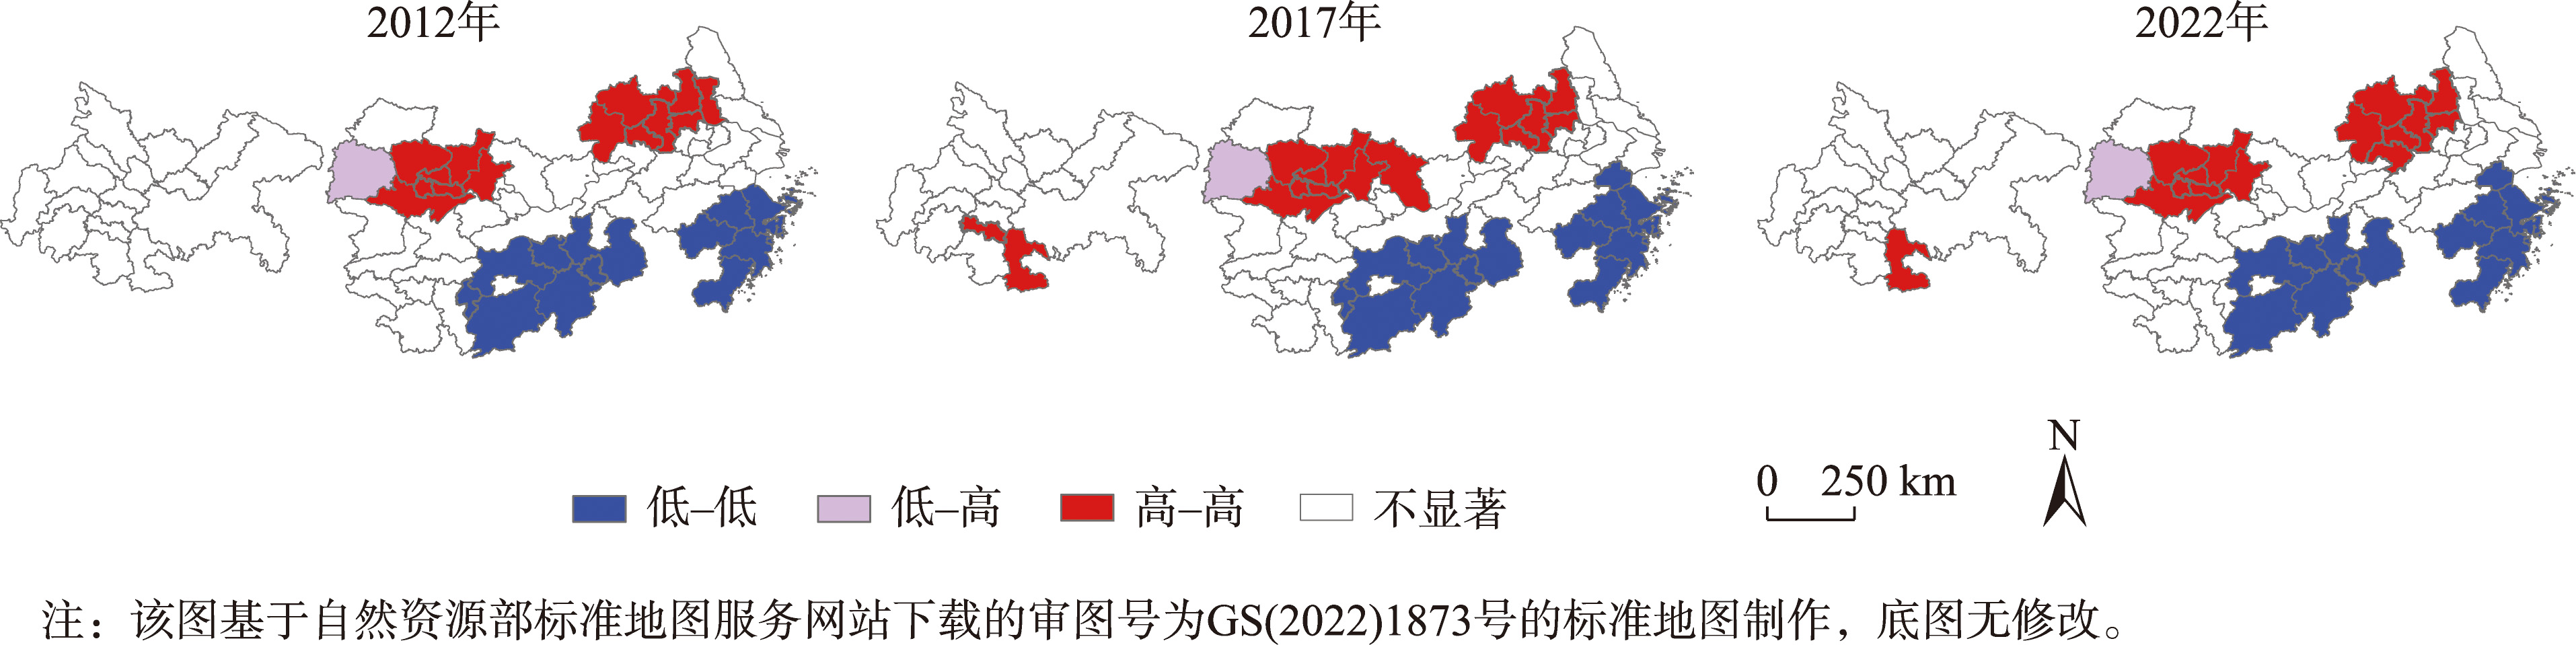
Fig. 10
Local spatial autocorrelation analysis results of PM
2.5
in the three urban agglomerations of the Yangtze River Economic Belt in 2012, 2017 and 2022
Other figure/table from this article
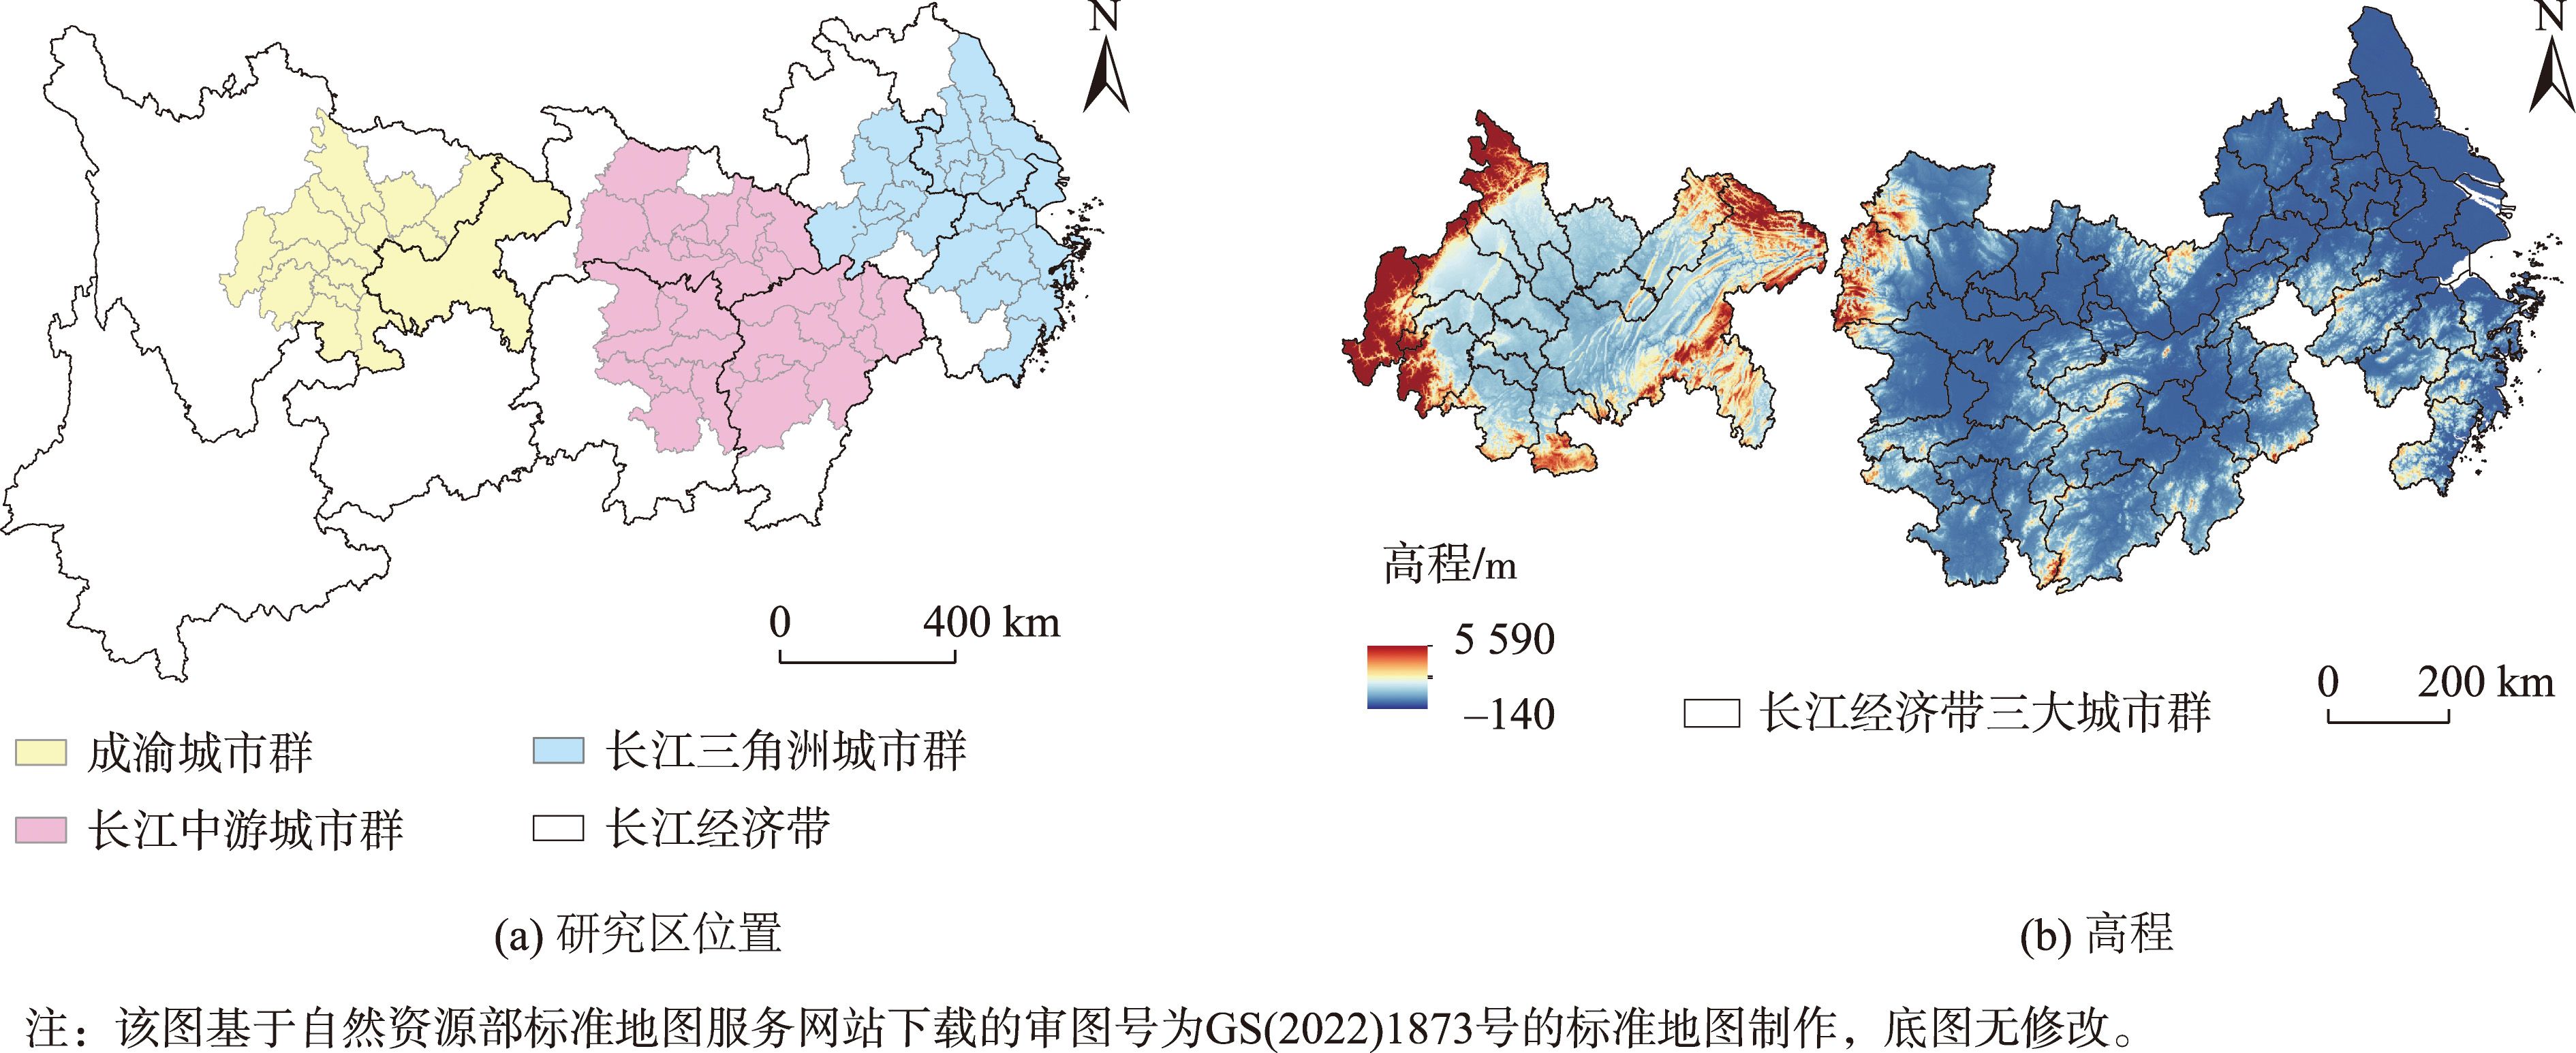
Fig. 1
Location and elevation of the study area
Tab. 1
Sources and introduction of influencing factors
Fig. 2
Analysis process of spatiotemporal evolution and influencing factors of PM
2.5
spatiotemporal heterogeneity
Fig. 3
Annual variation of PM
2.5
concentrations in the three urban agglomerations of the Yangtze River Economic Belt from 2012 to 2022
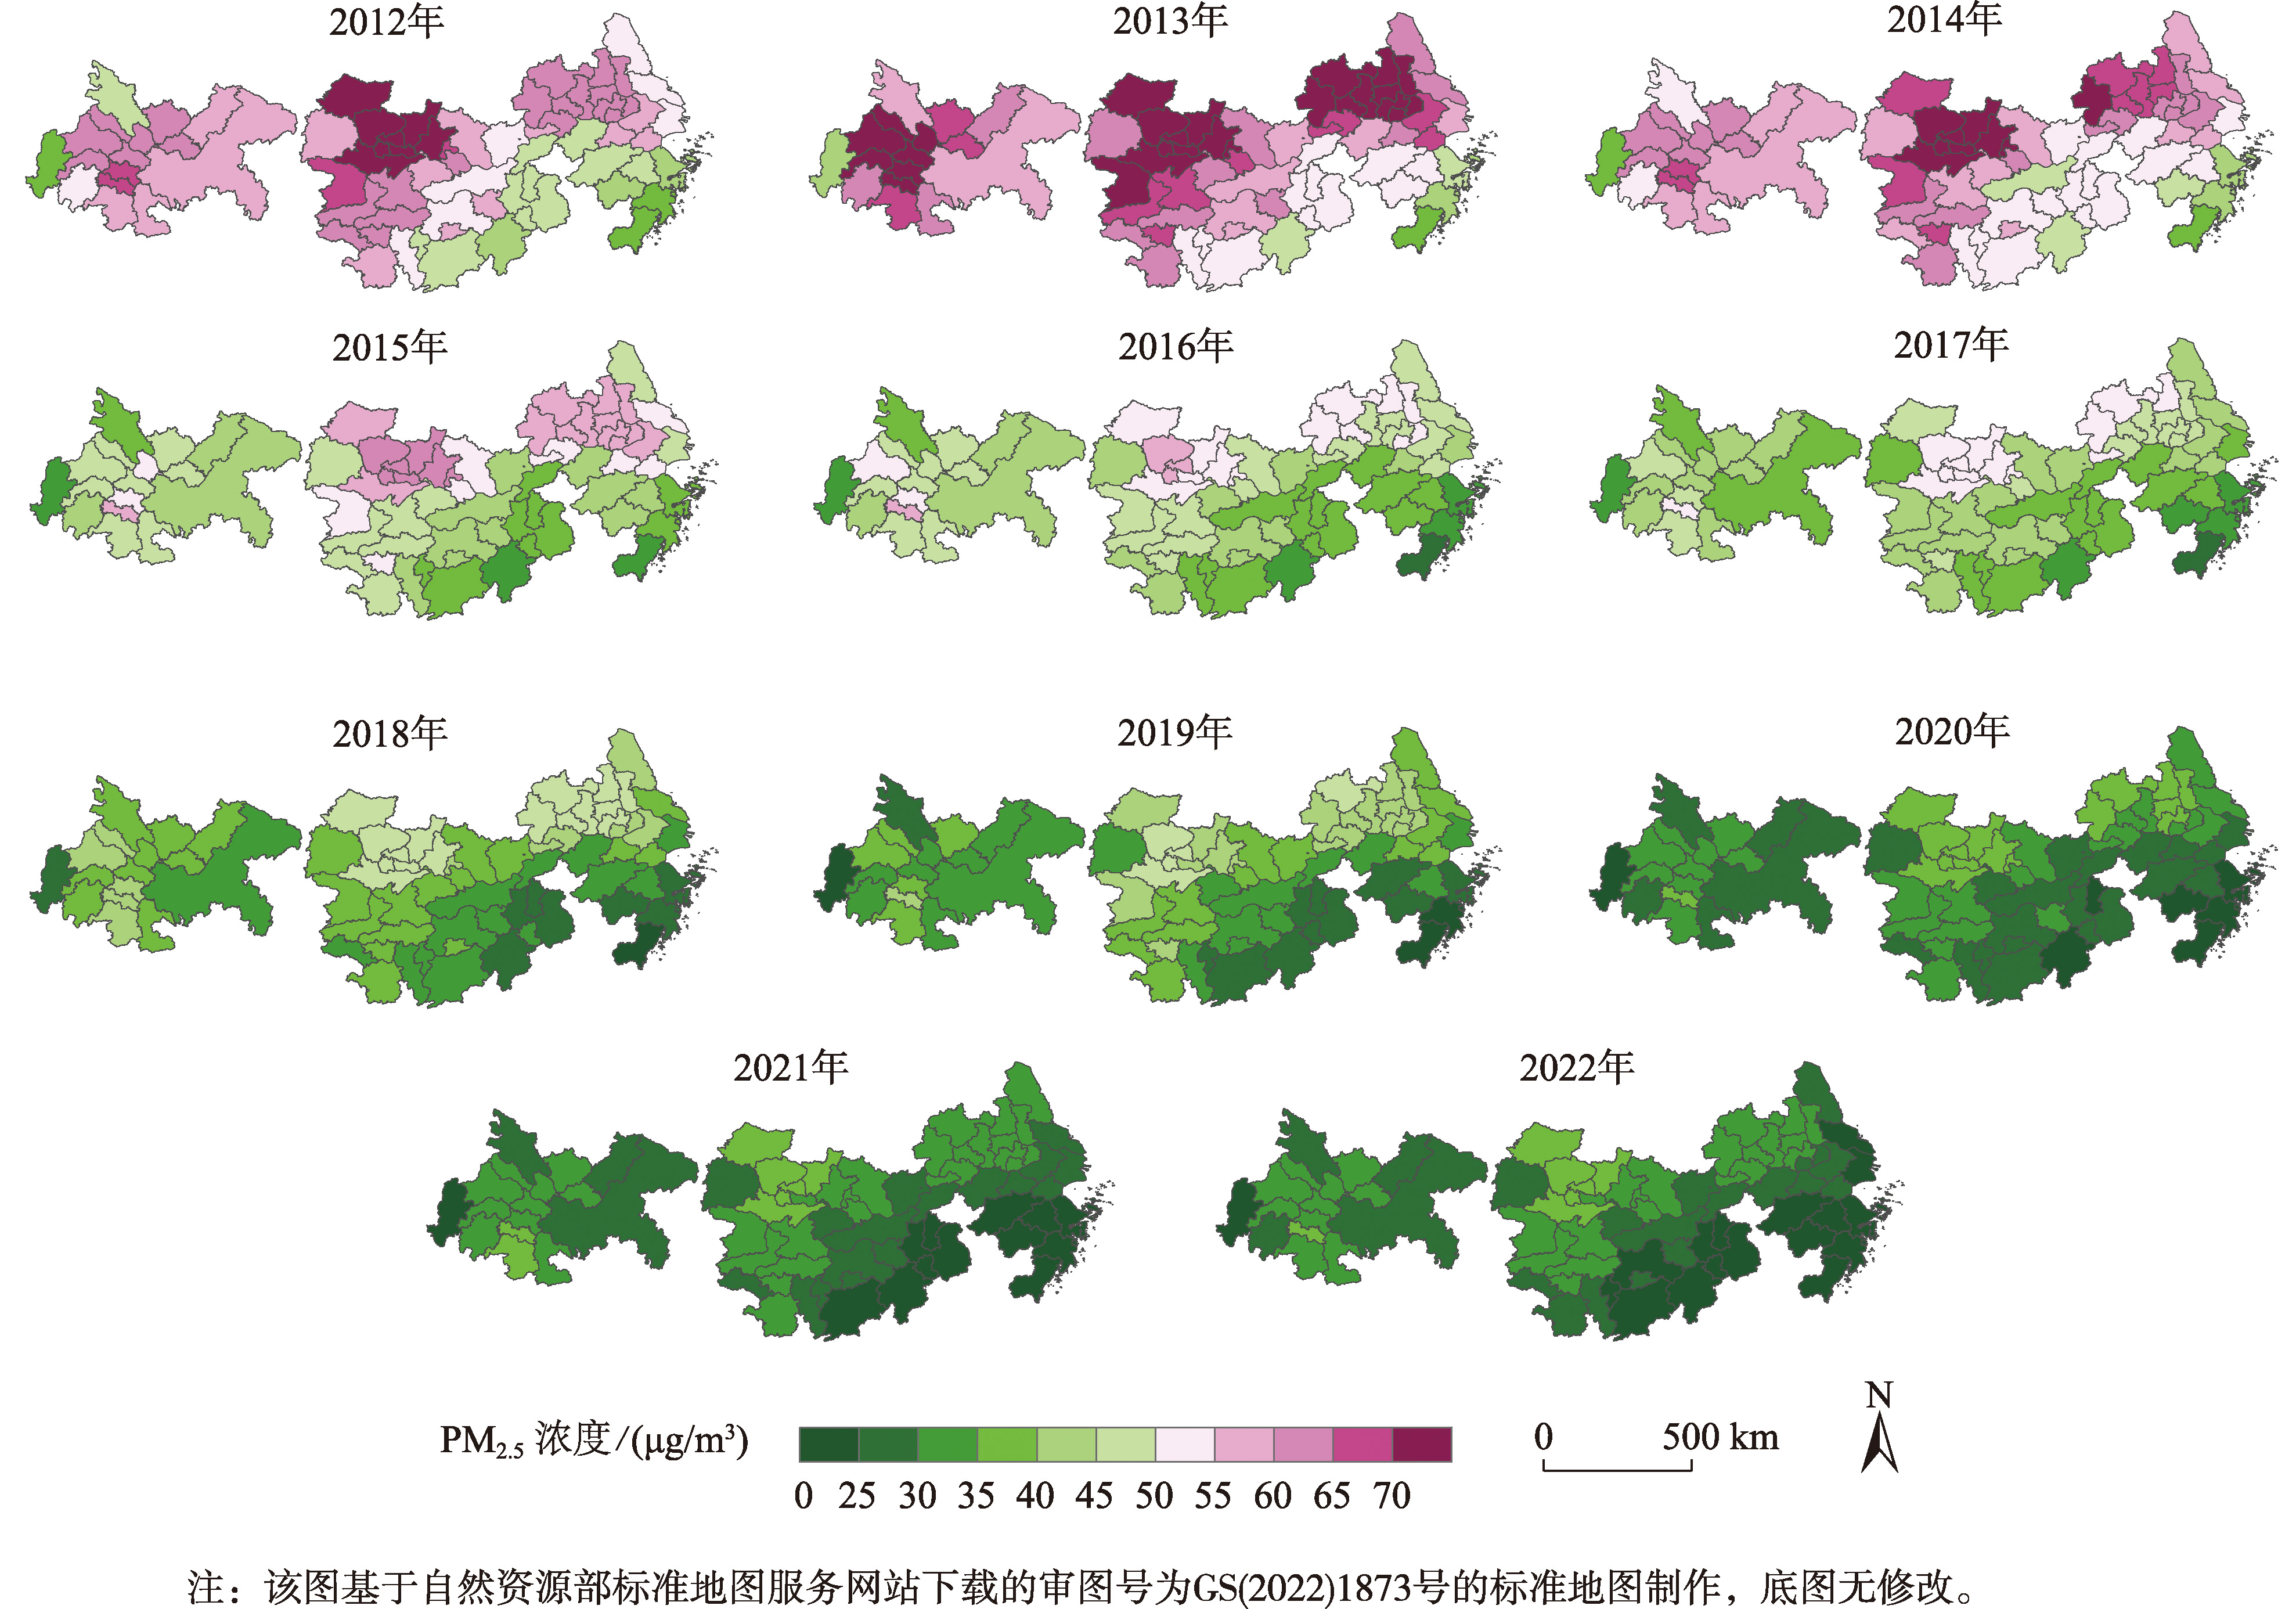
Fig. 4
Spatial distribution of annual average PM
2.5
concentrations in the three urban agglomerations of the Yangtze River Economic Belt from 2012 to 2022
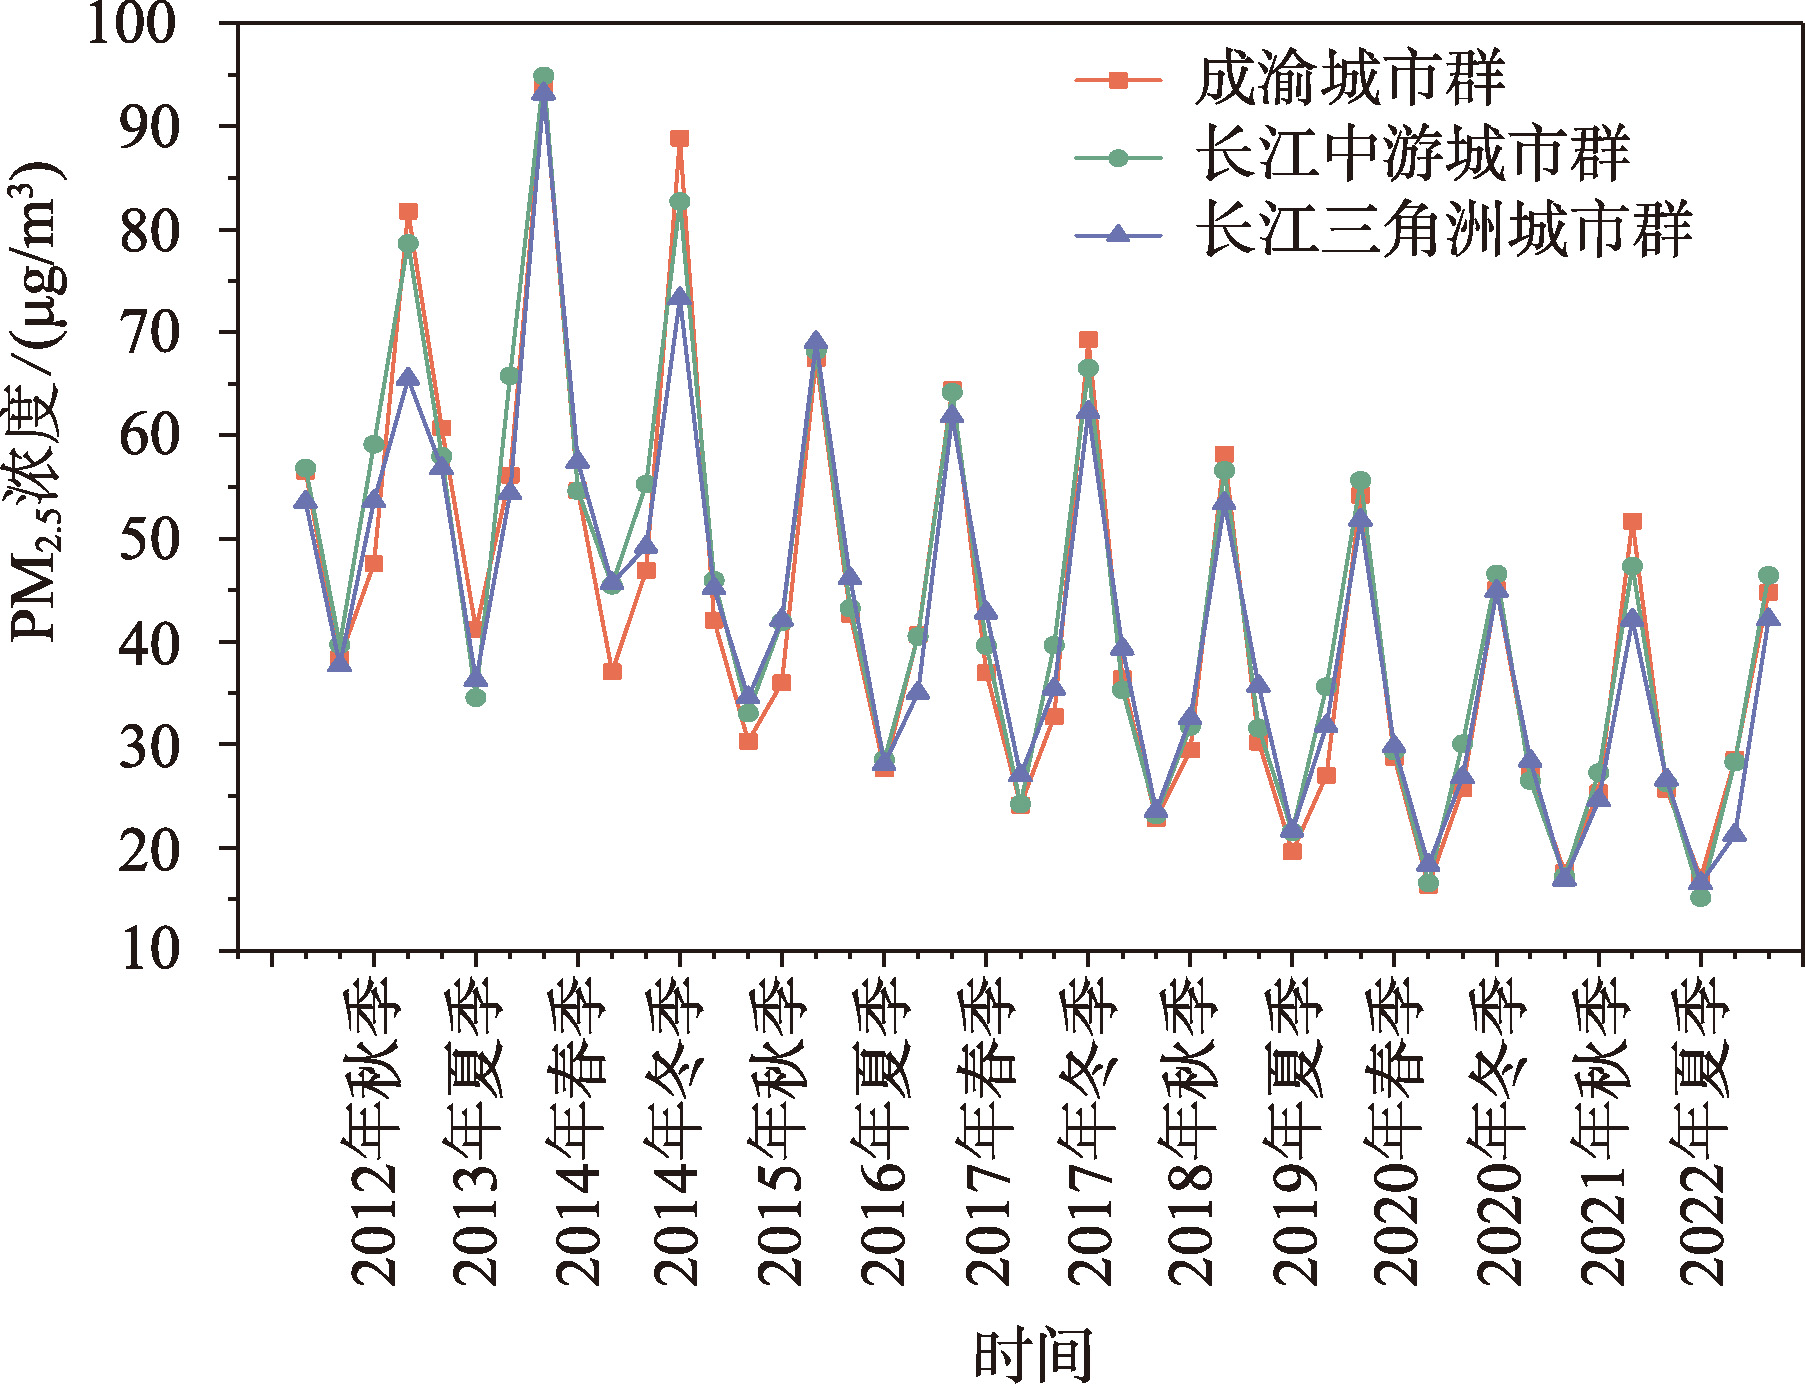
Fig. 5
Seasonal variation of PM
2.5
concentrations in the three urban agglomerations of the Yangtze River Economic Belt from 2012 to 2022
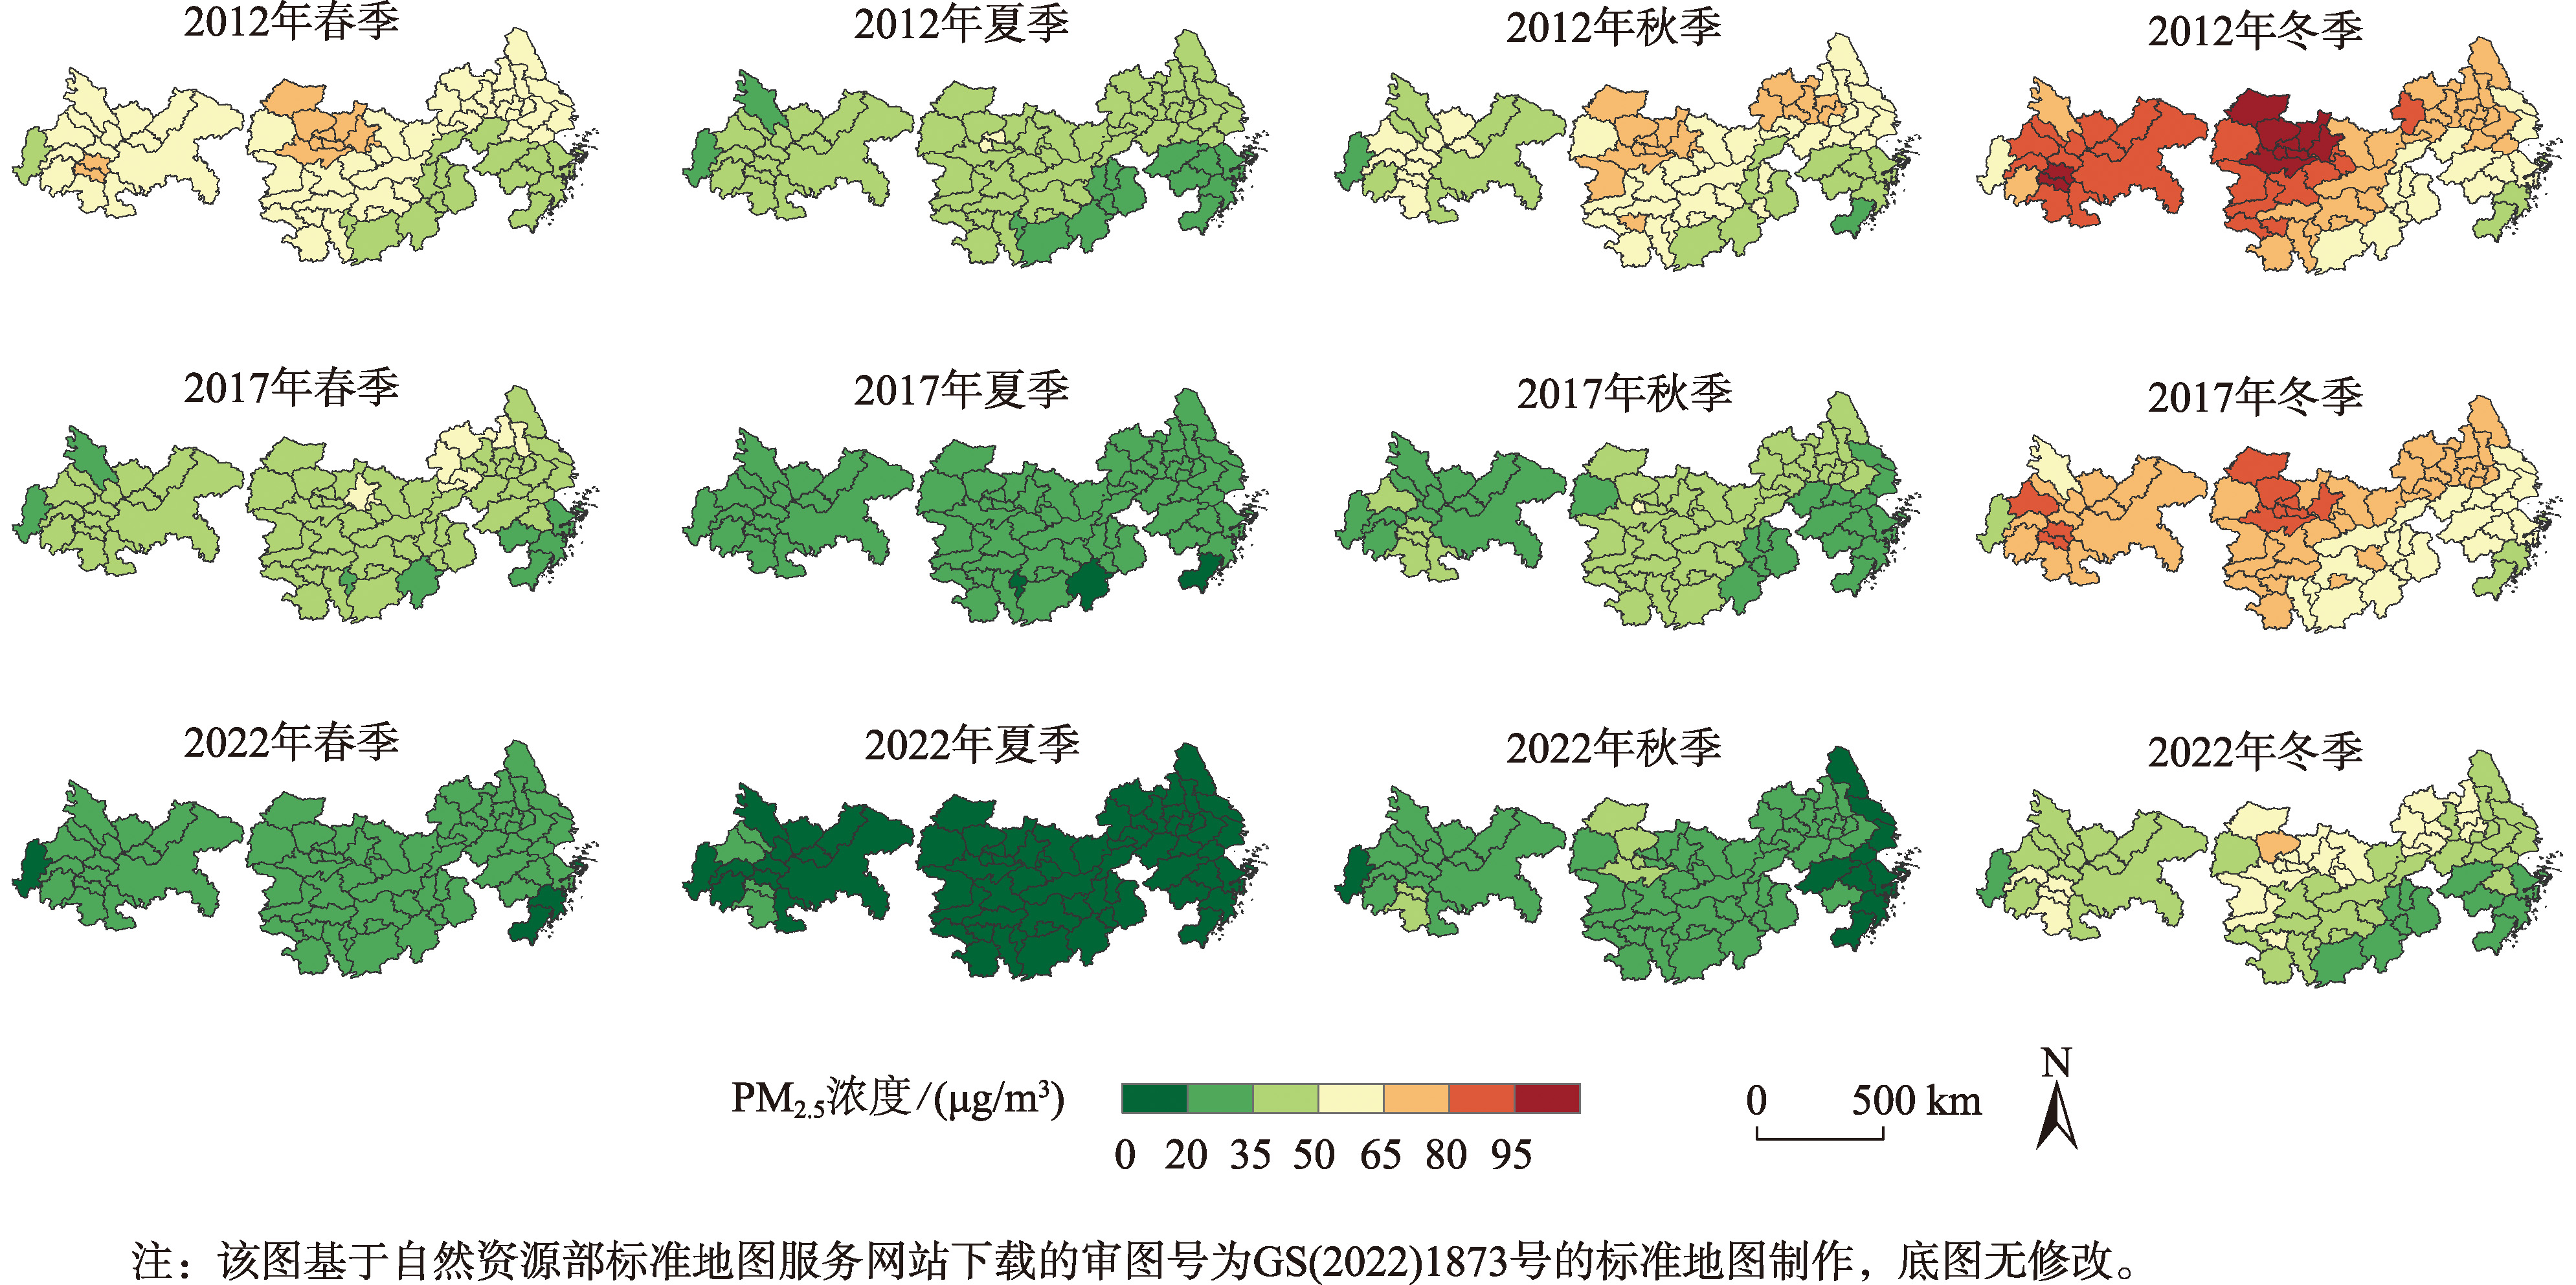
Fig. 6
Seasonal spatial distribution of PM
2.5
concentrations in the three urban agglomerations of the Yangtze River Economic Belt in 2012, 2017 and 2022
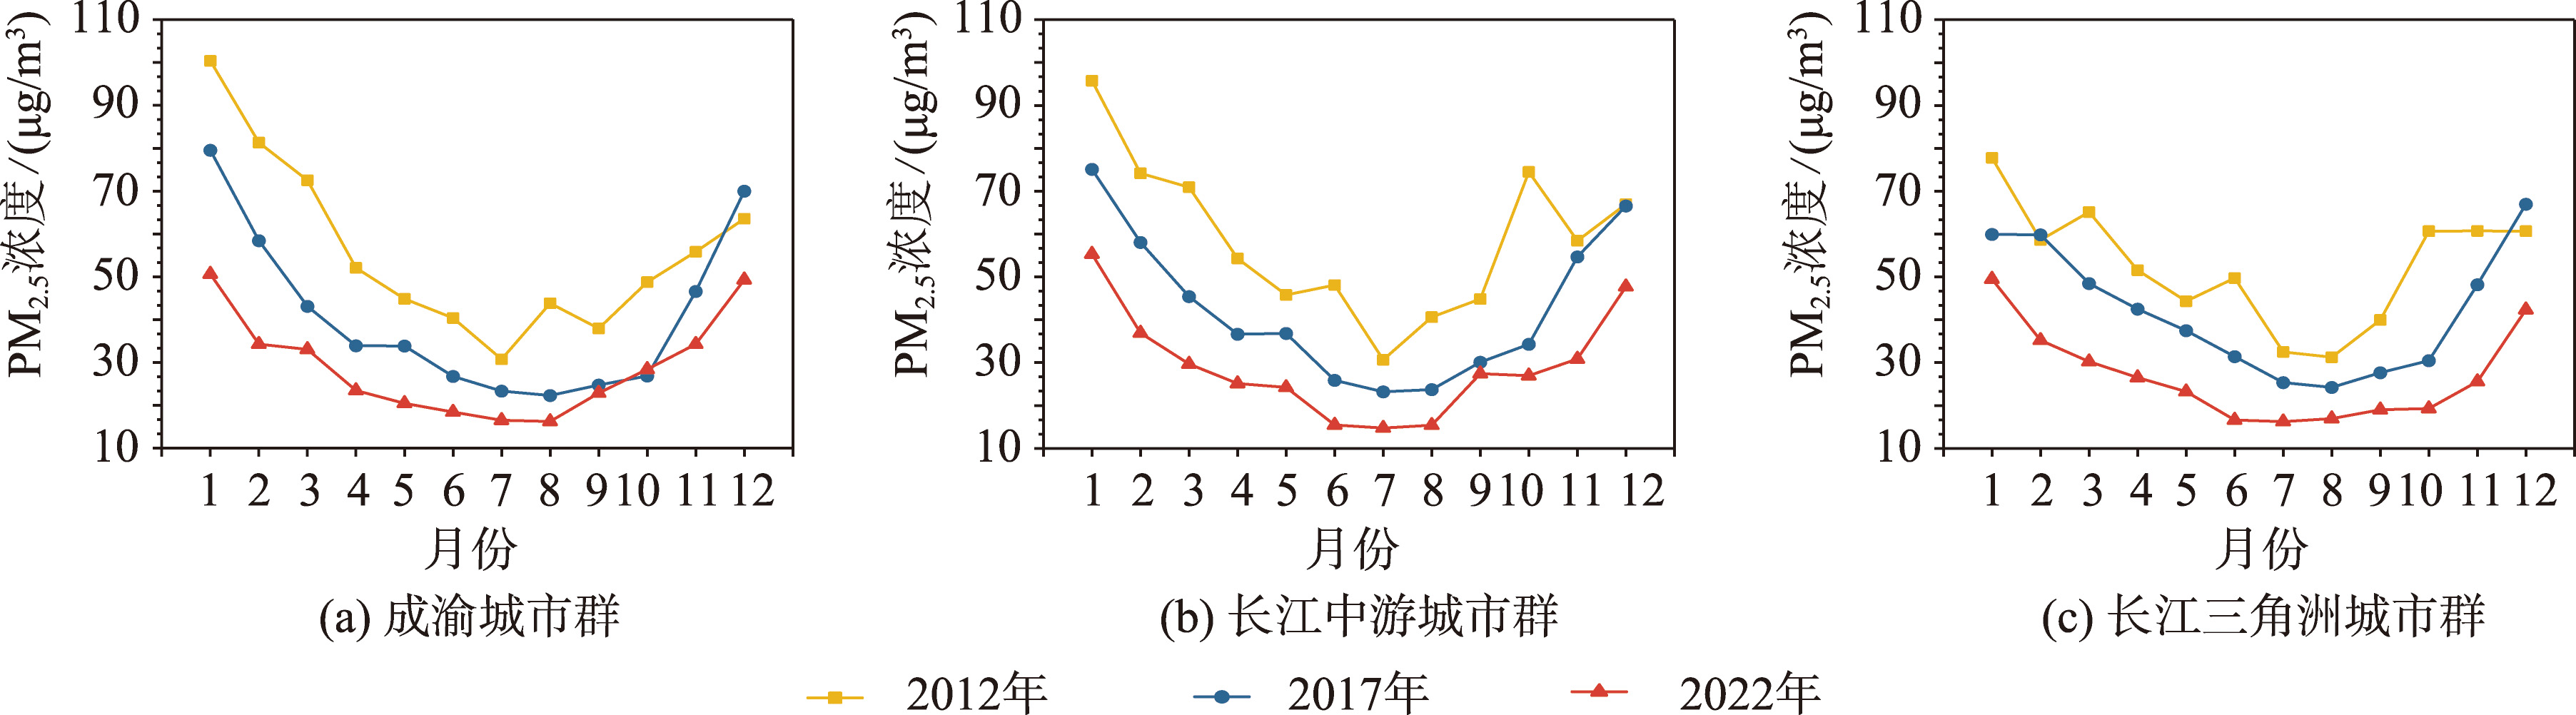
Fig. 7
Monthly variations of PM₂.₅ concentrations in the three urban agglomerations of the Yangtze River Economic Belt in 2012, 2017, and 2022
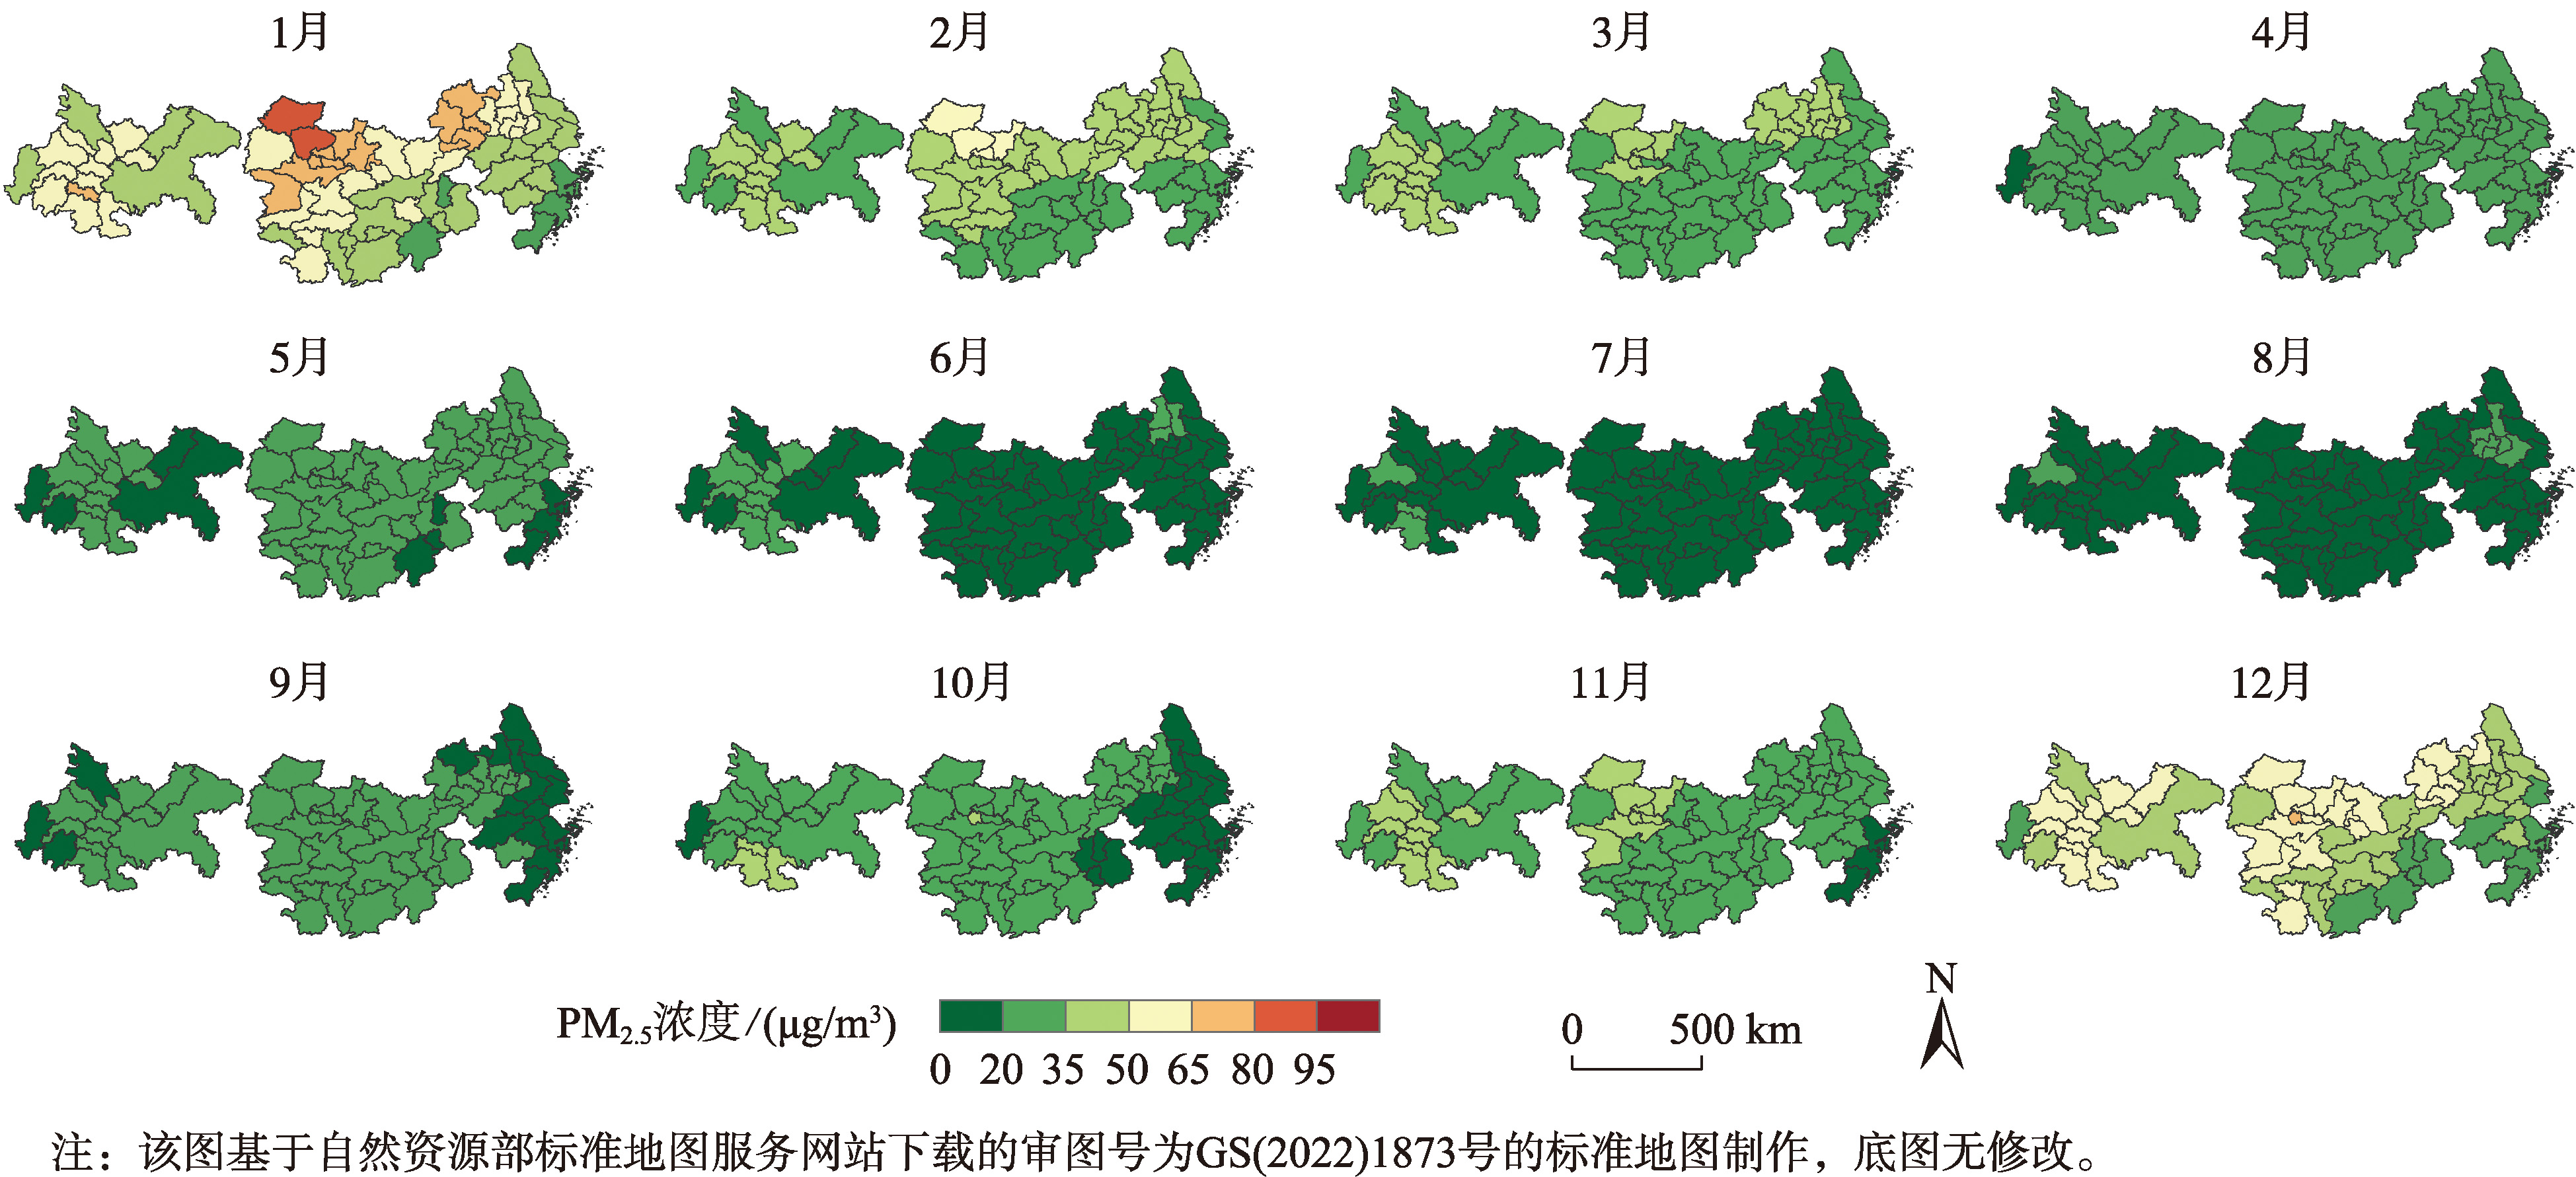
Fig. 8
Spatial distribution of monthly average PM
2.5
concentrations in the three urban agglomerations of the Yangtze River Economic Belt in 2012
Fig. 9
Spatial distribution of monthly average PM
2.5
concentrations in the three urban agglomerations of the Yangtze River Economic Belt in 2022
Tab.2
Moran Index of PM
2.5
about three urban agglomerations of the Yangtze River Economic Belt and its test
Tab. 3
VIF of influencing factors
Tab. 4
Factor detector analysis results
Tab. 5
Fitting results of the spatial regression model
Tab. 6
Temporal bandwidth and spatial bandwidth of the impact factor
Tab. 7
Regression coefficient results of the impact factor
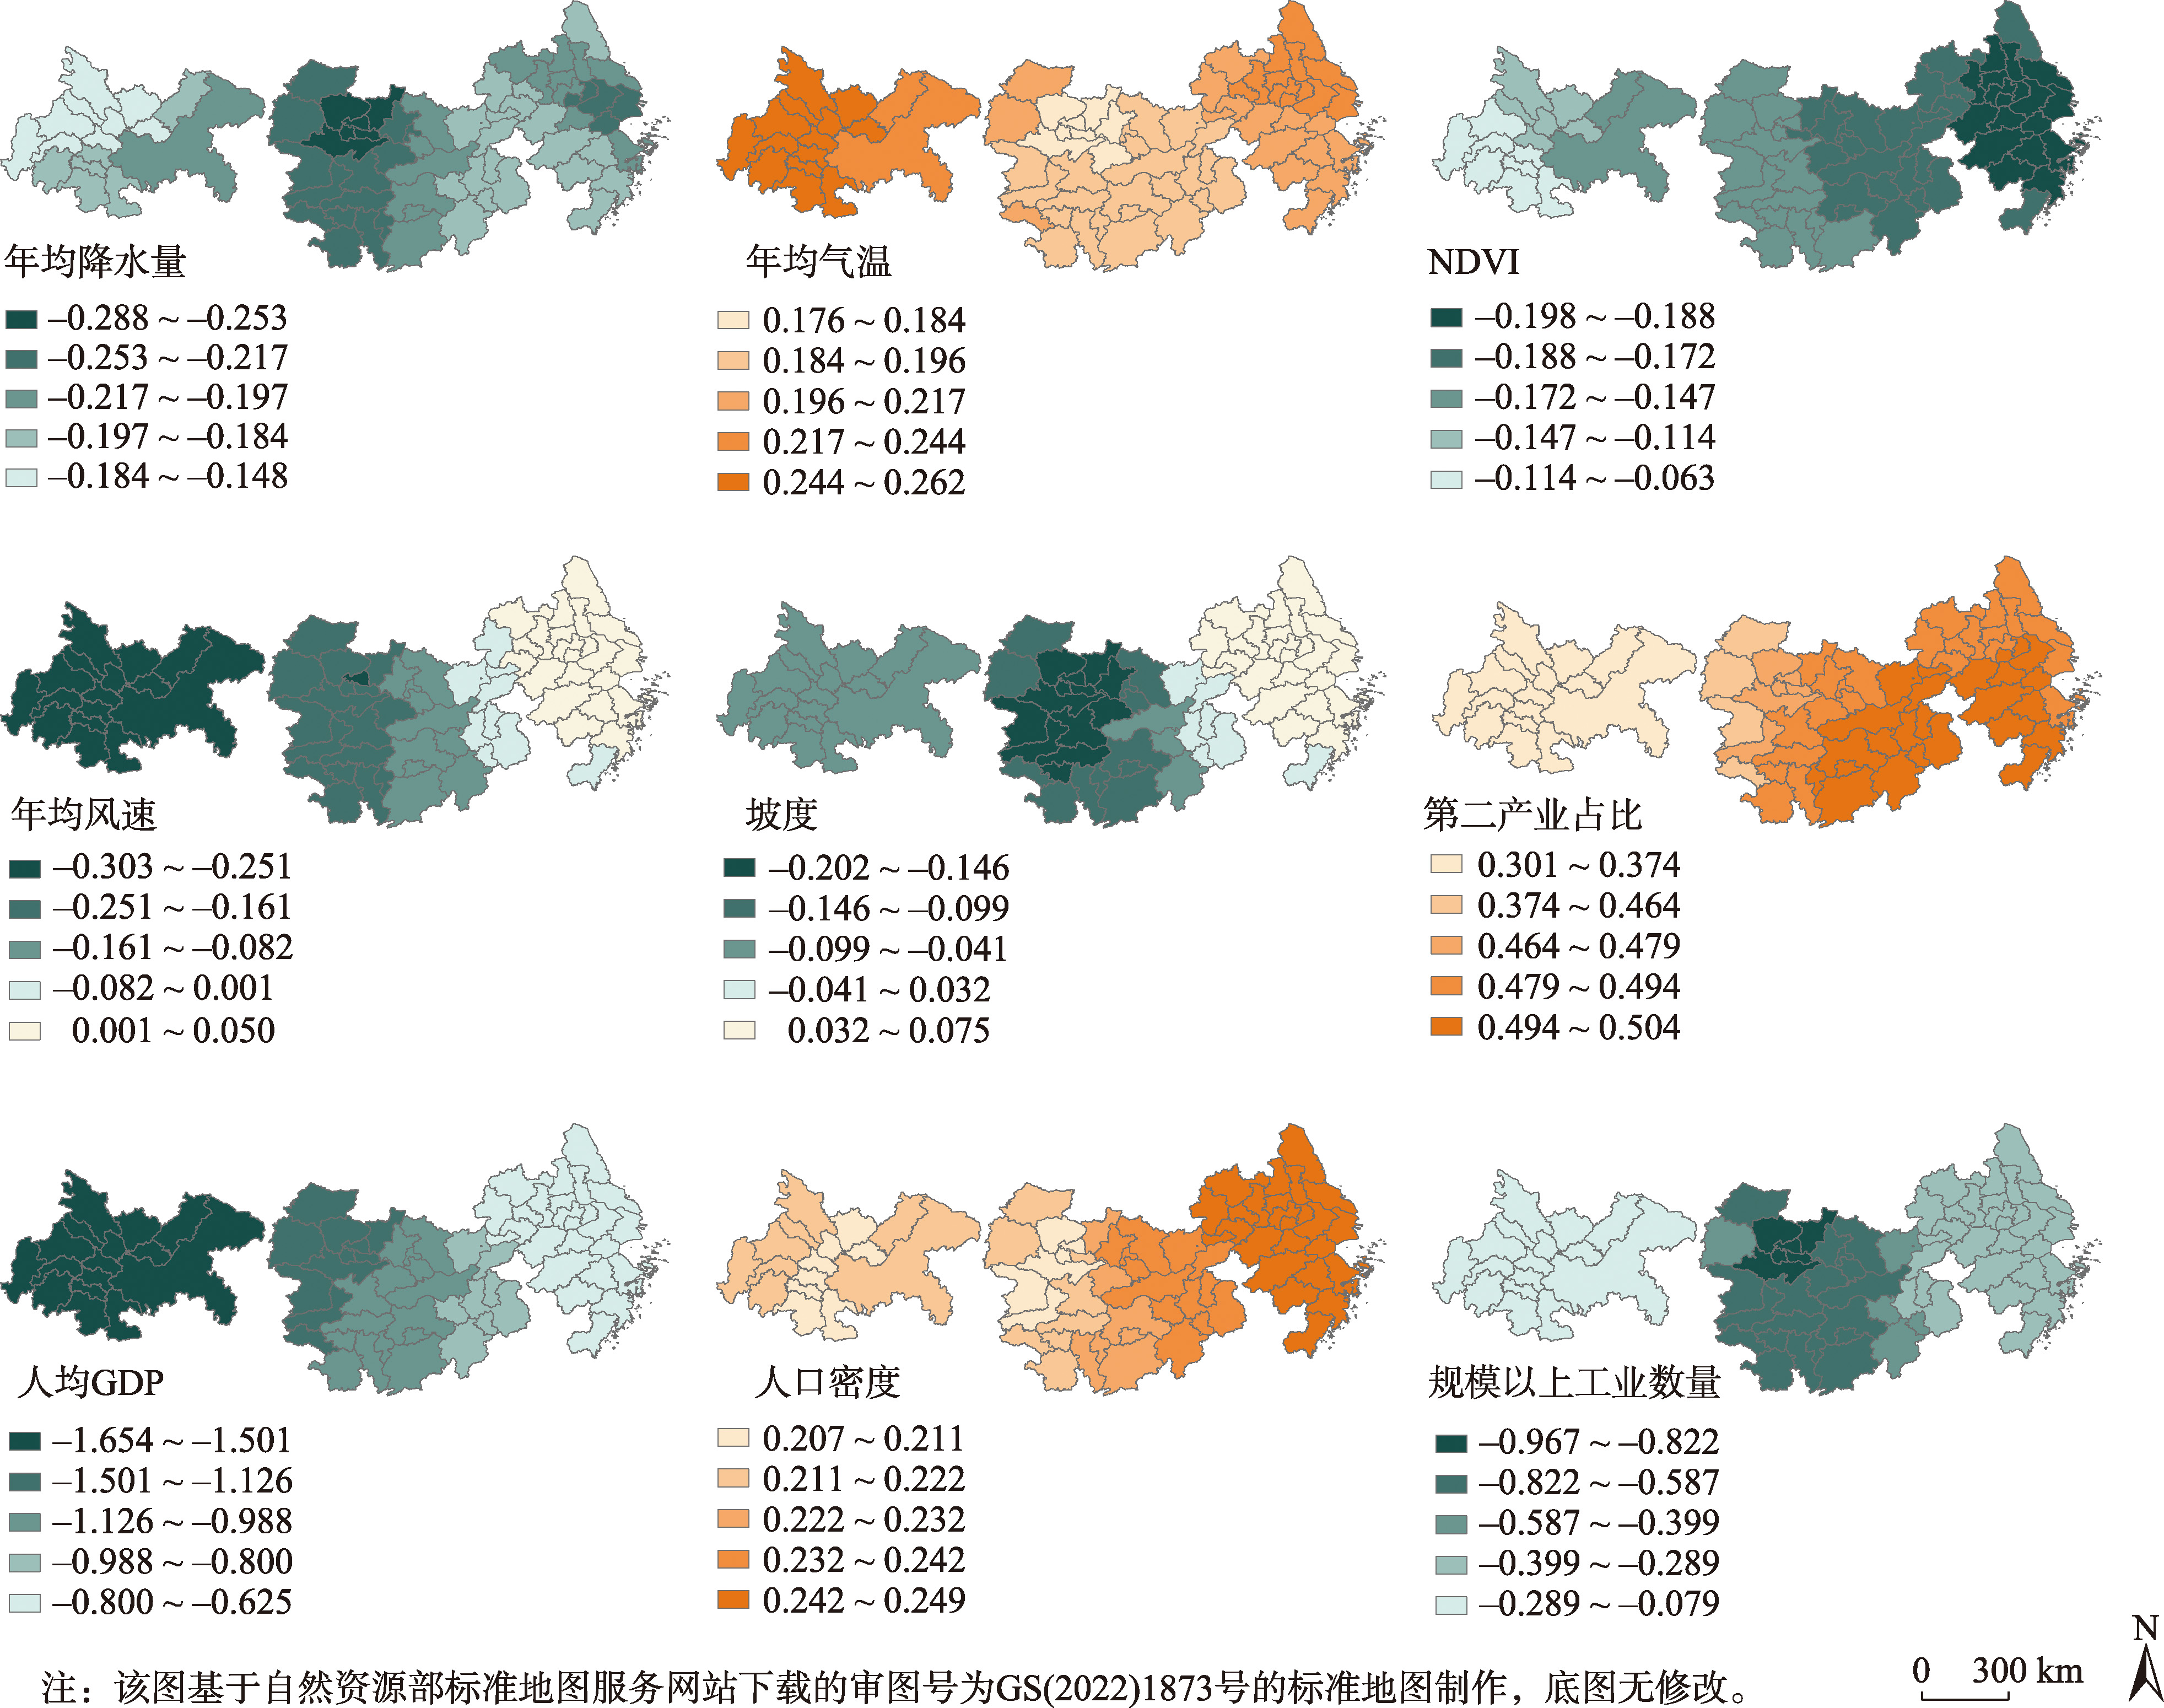
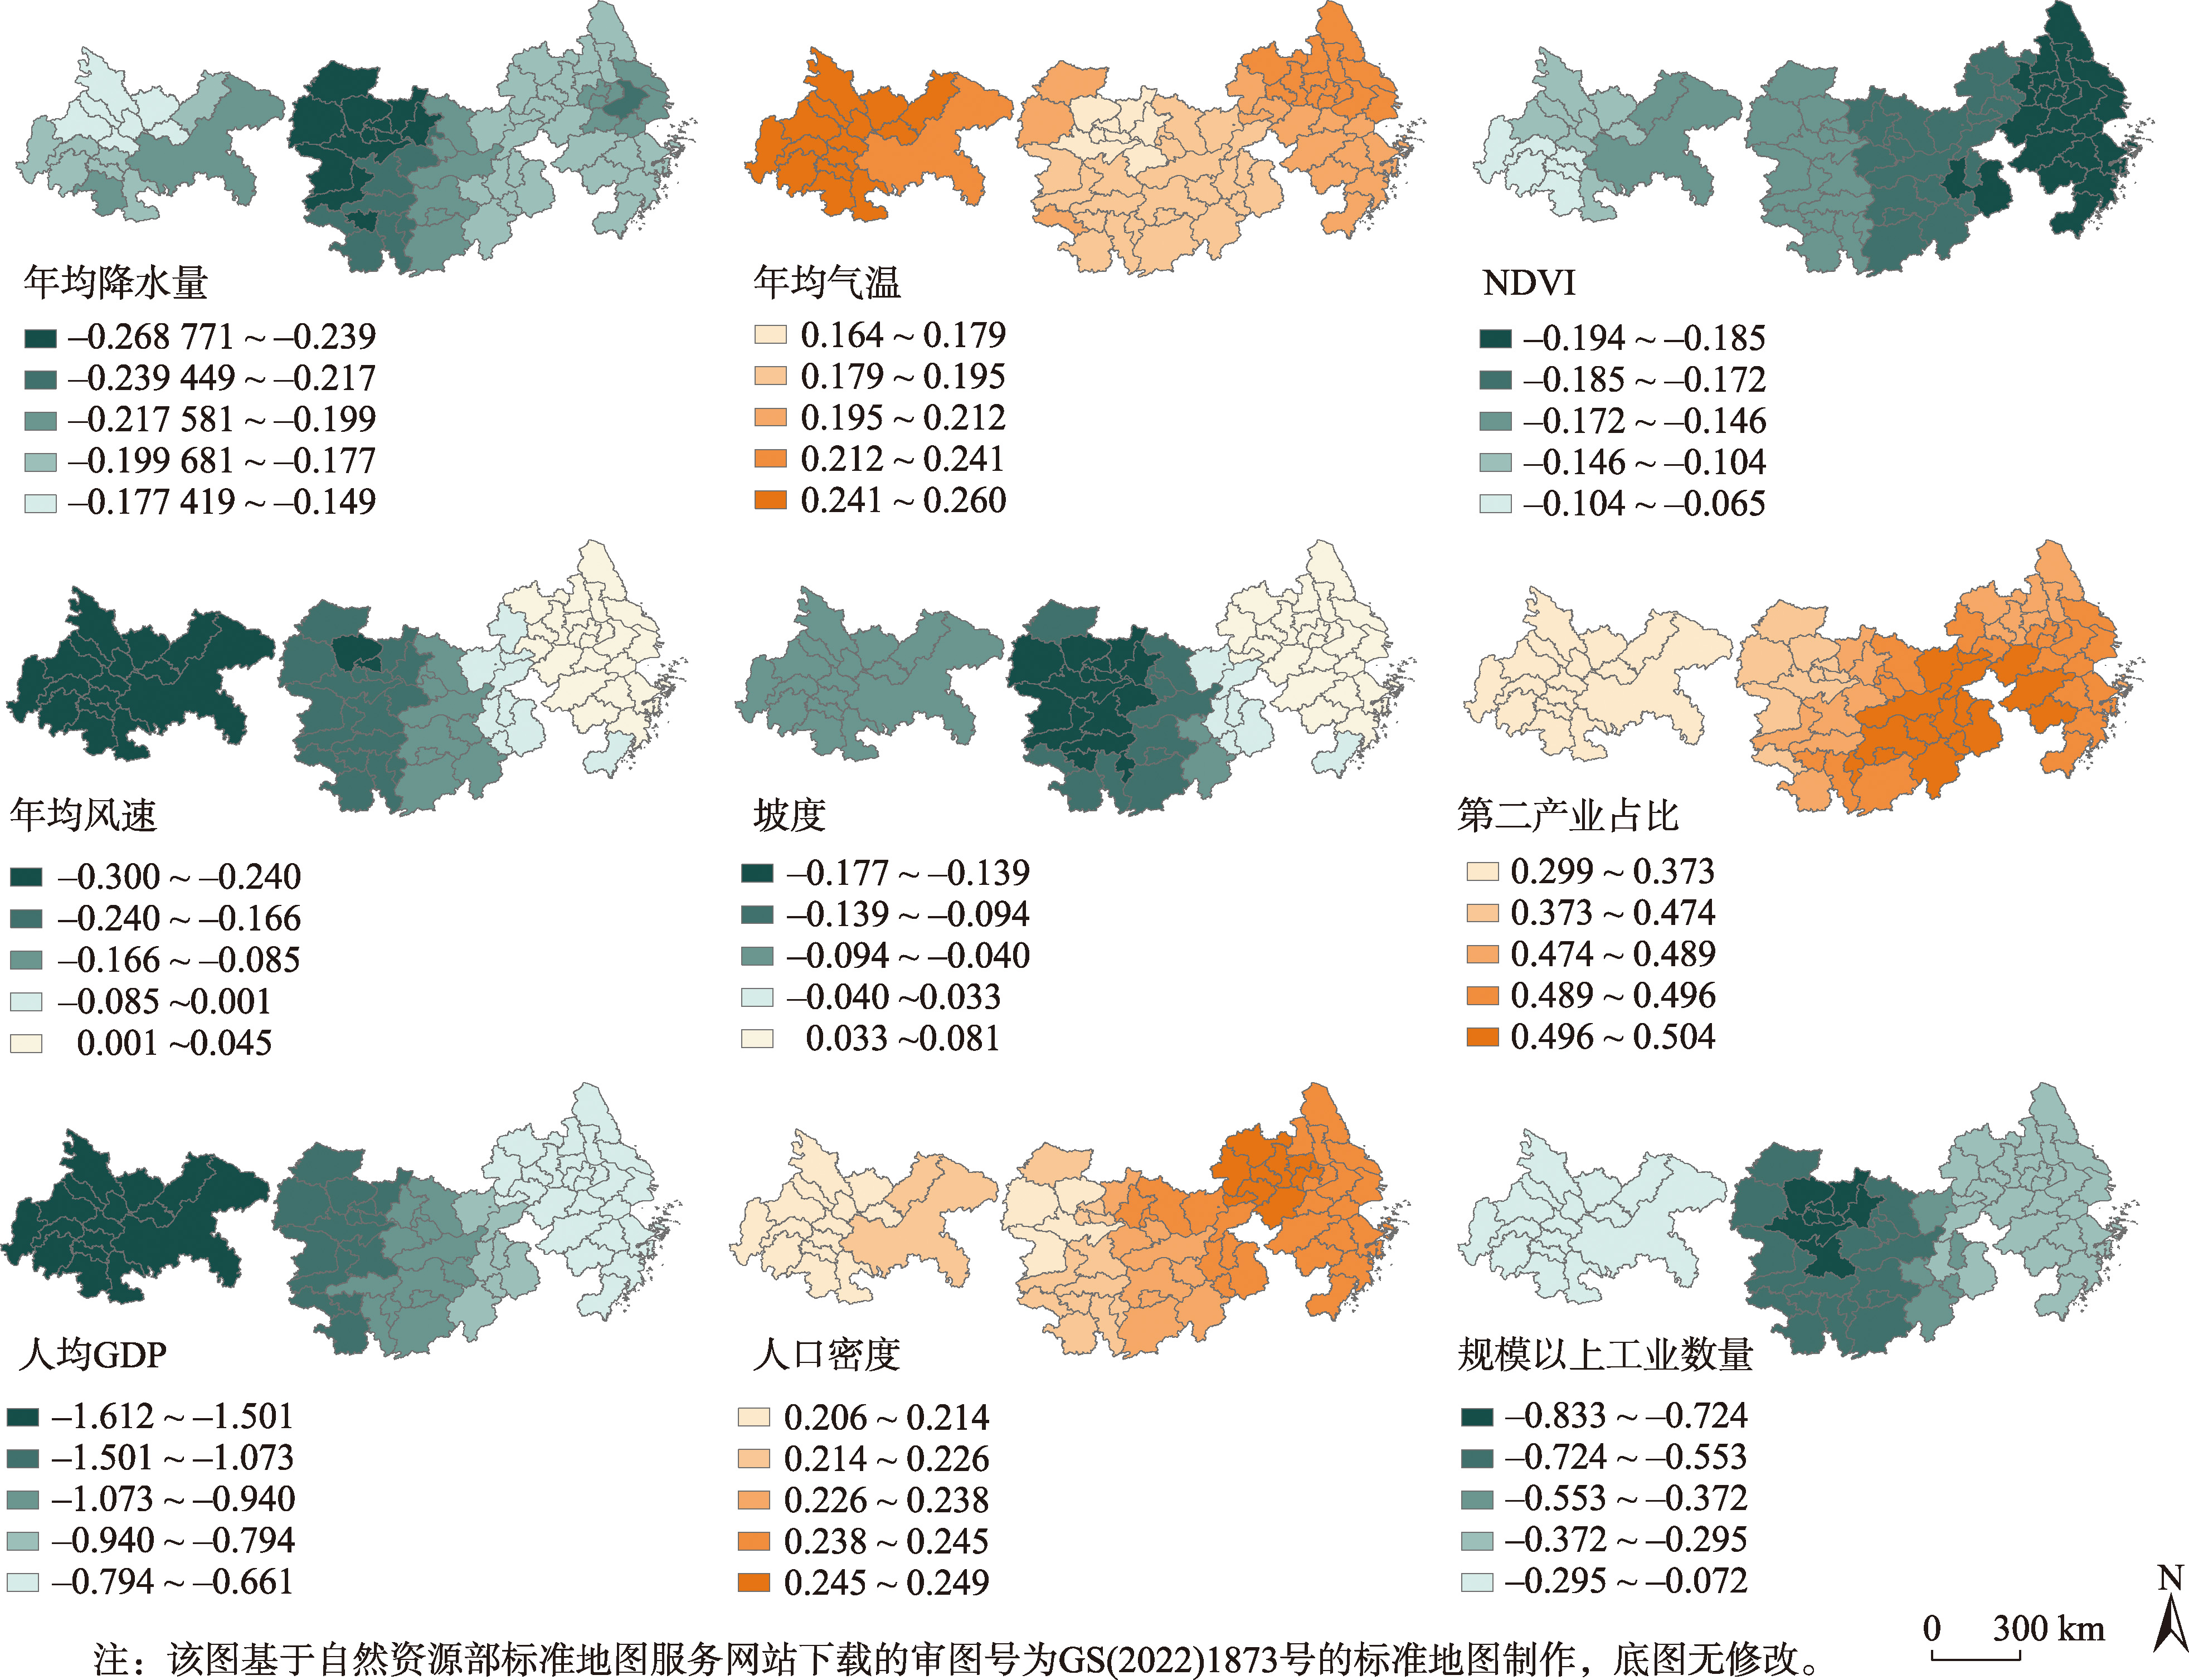
Fig. 11
Spatial distribution of regression coefficients of impact factors in 2012
Fig. 12
Spatial distribution of regression coefficients of impact factors in 2017
Fig. 13
Spatial distribution of regression coefficients of impact factors in 2022