

1 引言
20世纪70年代以来,随着全球化、信息化的推进和快速交通方式的变革,区域之间信息、资金、人口、科技等要素流动愈发频繁,各类流动的要素将不同城市连接为统一的整体,地域空间组织由静态的等级模式向动态的网络模式转变[1]。传统的城市等级规模理论显然无法较好地解释这一问题,学者们纷纷探索新的理论来解释这一现象。在这一背景下,学术界掀起了城市网络研究的热潮[2]。Friedmann[3]以总部企业机构和大银行的分布对世界城市等级体系进行了研究;Sassen[4]将城市间关系放在超越国家边界的全球视野中;Wheeler等[5]采用“优势流”法来计算节点的连通性;Castells[6]提出了“流空间理论”,强调了城市节点对网络体系塑造的价值作用,这些研究奠定了城市网络研究的早期基础。Taylor[7]实现了从企业联系到城市关系的转变,提出了连锁网络模型理论,推动城市体系研究由传统的中心地理论向网络化转变[8]。此后,学术界关于城市网络的研究如雨后春笋般涌现出来:在研究视 角上,采用信息流[9]、科技流[10-11]、交通流[12-13]、人口 流[14-15]、资金流[16-17]等不同类型的流数据构建城市 网络;在研究尺度上,涌现出全球尺度[18-19]、国家尺 度[20-21]和地方尺度[22-23]的城市网络研究成果;在研 究内容上,城市网络的拓扑结构[24]、地理空间结 构[25-26]、影响因素[27-28]、空间效应[29-30]等是关注的热点问题。这些研究极大地丰富了城市网络的基础理论和实证分析。
尽管研究视角和研究数据日趋多元,但由于城市网络的根本是城市间经济联系,而企业是城市间网络的关键作用者[7],基于企业视角的城市网络研究仍然是城市网络研究的主流学派[31]。从网络构建方法上来看,采用企业内部联系构建网络通常采取隶属网络模型、连锁网络模型等转译模型 方法[32],通过计算生产性服务业关系和总部—分支机构的关系,构建城市网络,分别构成了城市网络研究中的Sassen-Castells-Taylor传统和Hymer-Friedmann-Alderson传统[33]。从数据来源和类型来看,现有研究广泛采用高级生产性服务业[34]、独角兽企业[35]、高新技术企业[36]、物流企业[37]、文化 企业[38]、互联网企业[39]等开展了城市网络研究。从联系的方向和尺度来看,基于企业内部的联系视角是主流,近年来采用企业间联系的研究成果逐渐增加,如企业并购关系[40]、企业的供应关系[41]等。
梳理现有研究发现:在研究方法方面,基于企业视角的城市网络研究,大部分采用企业内部联系来构建城市网络,但这类研究建立在任意企业存在总部和分支机构的假设基础之上,且网络在转译过程存在信息损失的情况;在研究对象尺度方面,更多关注于全国城市网络的空间结构,对城市群多尺度的网络分析还不足;在研究时序方面,侧重于单一时间节点城市网络空间格局研究,对城市网络的时空演化研究不够。上市公司作为市场主体中最活跃、最具代表性和影响力的群体,其数量和规模一定程度上反映了区域的经济活力,而上市公司与其客户的贸易关系是城市贸易网络的重要组成部分。鉴于此,本文基于上市公司与其前五大企业客户的贸易流数据,将企业间贸易网络转化为城市联系网络,基于全国和城市群两个尺度分析城市网络的结构演变特征。
本文的创新点在于:① 采用企业间贸易流数据构建城市网络,避免了基于企业内部联系视角构建城市网络在转译过程中信息损失的问题;② 构建了多个年份的城市网络,能够更加深入地分析网络结构的空间演变规律。
2 数据来源及研究方法
2.1 数据来源及网络构建
本研究中只考虑A股上市公司与前五大客户的交易数据,共包括1818家,不将B股、港股和台股考虑在内。上市公司前五大客户数据来源于国泰安经济金融研究数据库上市公司关联交易数据(
图1
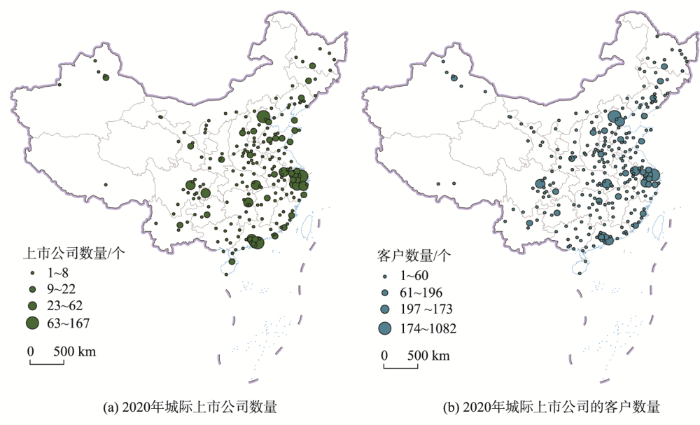
图1
2020年城际上市公司及其客户空间分布
注:该图基于自然资源部标准地图服务网站下载的审图号为GS(2019)1815号的标准地图制作,底图无修改。由于数据获取困难,本次研究不包括香港、澳门和台湾。
Fig. 1
Spatial distribution pattern of listed companies and their customers in 2020
2.2 研究设计与方法
2.1.1 研究设计
如图2所示,本研究的步骤如下:①梳理了基于企业联系视角的城际网络研究进展,并对基于企业内部联系构建城市网络的研究不足进行了分析;②基于A股上市公司及其前五大客户间的贸易流数据,构建了基于企业间联系的城际网络数据,形成本研究的基础数据库;③采用复杂网络、区域重心模型等方法,从全国尺度分析了网络的整体结构、节点结构、联边结构、社团结构的演变特征,从城市群尺度分析了城市群之间和主要城市群内部的网络结构演变特征。本研究有助于拓展基于企业间视角的城际网络分析,可以为优化国内大循环和统一大市场建设提供参考。
图2
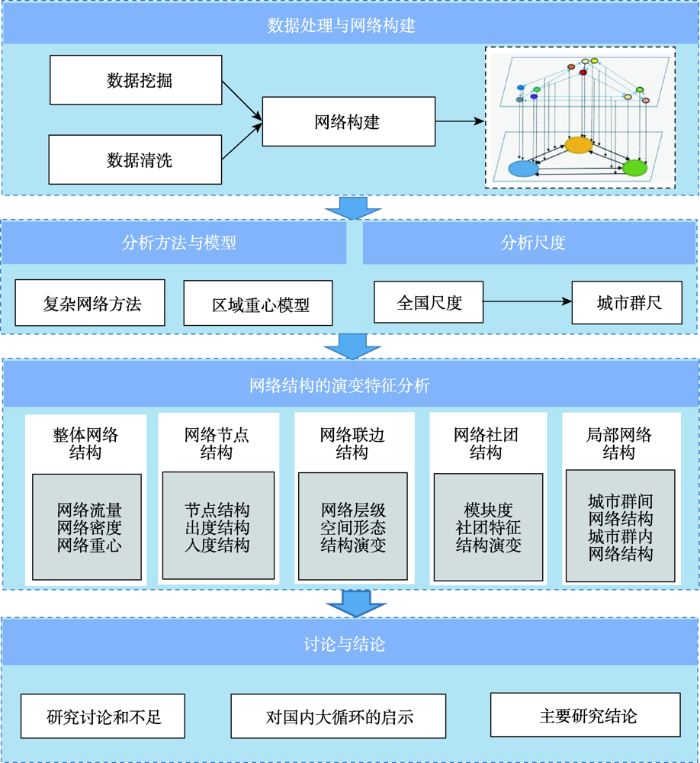
图2
上市公司与客户联系视角下的中国城际网络结构时空演化研究框架
Fig. 2
Research framework of spatial-temporal evolution of China's inter city network structure from the perspective of the relationship between listed companies and customers
2.1.2 研究方法
(1)网络密度。该指标反映网络中节点之间的联系程度[12]。网络密度越大,表明网络节点之间的关系越密切。其公式为:
式中:D为网络密度;n为城市节点数量;i、j为发生贸易往来关系的城市;di(i,j)为城市i与城市j间贸易金额;D数值介于0~1之间;网络密度D的值越接近1,表示网络中城市间的关系越紧密。
(2)网络节点度。节点度用来刻画节点在网络中的联系能力,节点度越大,节点在网络中承担的贸易流量越大。在有向网络中,节点度可分为点出度和点入度。点出度用以衡量节点的对外辐射能力,点入度衡量节点接受辐射的能力[12]。公式如下:
式中:
(3)网络社团结构。贸易流动网络社团结构判定模型是基于网络节点的关系模式,根据网络节点间的拓扑距离,把节点归组到不同社团[42]。社团结构能够很好地识别网络局部的集聚特性。模块度(Modularity Q)是衡量社区划分结果质量的标准,其表达式如下:
式中:Q是模块度;Q值越大,表明社团划分结果越优;Q值越低,则表明划分的社团结构特征不够显著;在实际的复杂网络分析中,Q值通常取值位于0.3~0.7之间;m为网络中边的总数;ki是节点i的度值;kj是节点j的度值;Aij为矩阵元素,若节点i与节点j相连,那么Aij=1,否则=0。函数
(4)区域重心模型。重心模型能够较为直观的分析研究对象的空间变迁规律,通过计量要素重心偏离几何中心的距离与方向,精准研判要素的空间分布规律和演变态势[43]。具体模型如下:
式中:X、Y分别表示总区域网络重心经度和纬度数值;Xi、Yi分别表示节点i的重心经度和纬度数值,即地理重心坐标;n表示研究单元的总个数;Mi是节点i的权重,用加权度表示。
3 结果及分析
3.1 整体网络规模演变
3.1.1 网络流量和节点数量呈现先增后减的特征
图3报告了2010—2020年基于上市公司与客户贸易关系的城际网络流量规模与城市节点数量的演化情况。从贸易总量上来看,整体上呈现出快速扩张到缓慢下降的变化趋势,其中,2010—2016年,贸易流量快速增长,由3397.8亿元增长到6706.9亿元,这一时期我国经济位于中高速增长阶段,上市公司发展势头良好;2017—2020年呈现缓慢下降的趋势,从6223.3亿元下降到4581.9亿元,这与同期我国GDP增速由2010年的10.3%下降至2020年的2.3%具有一致性,上市公司发展面临一定的压力。从节点数量来看,呈现出先增加后缓慢减少的态势,由2010年的207个增长到2013年的304个,2014—2020年节点数量相对稳定,贸易节点保持在250~280之间。2020年,受新冠疫情的影响,网络贸易总量呈现明显下滑,较2019年下降了15.9%,但贸易节点数量并未出现大幅度下滑,较2019年仅减少了10个,表明新冠疫情对整体网络流量产生了较大冲击,但并未对网络节点数量产生大的影响,整体贸易网络框架相对稳定。
图3
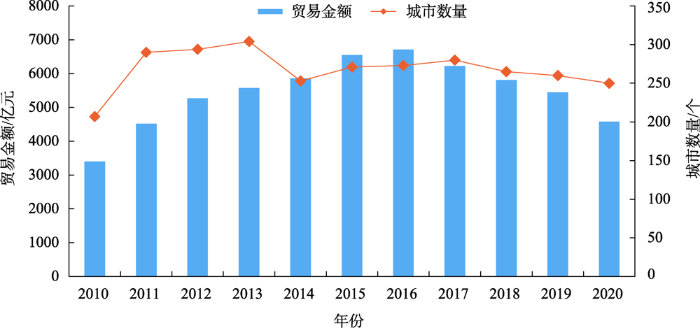
图3
2010—2020年中国城际贸易流量与节点数量变化
Fig. 3
Changes of China's inter city trade flow and node number from 2010 to 2020
3.1.2 网络密度先升后降,网络小世界特征显著
如表1所示,2010—2020年城际网络密度不高,位于0.014~0.018之间,呈现波动变化的特征,从2010年0.016增长到2015年0.018,进而下降到2019年的0.015。网络度中心性方面,平均联系的城市数量从2010年的4.25个增长到2015年的4.82个,而后下降到2019年的3.76个,表明网络呈现出先快速增长,后缓慢降低的特征。网络平均路径长度均保持在2.85~3.17之间,明显小于6,相当于只需要经过不到4个中介城市即可连接任意城市,符合“六度分离理论”,说明城际网络呈现明显的小世界特征,贸易流动效率较高。
表1 2010—2020年中国城际网络复杂性特征量统计
Tab. 1
| 年份 | 网络规模 | 小世界性 平均路径长度 | 度中心性 平均度 | |
|---|---|---|---|---|
| 网络密度 | 网络直径 | |||
| 2010年 | 0.016 | 7 | 3.05 | 4.25 |
| 2011年 | 0.016 | 7 | 2.9 | 4.55 |
| 2012年 | 0.017 | 7 | 2.85 | 4.58 |
| 2013年 | 0.016 | 6 | 2.87 | 4.92 |
| 2014年 | 0.015 | 7 | 3.16 | 3.39 |
| 2015年 | 0.018 | 8 | 2.91 | 4.82 |
| 2016年 | 0.017 | 8 | 2.93 | 4.76 |
| 2017年 | 0.015 | 6 | 2.96 | 4.12 |
| 2018年 | 0.014 | 7 | 3.05 | 3.76 |
| 2019年 | 0.015 | 8 | 3.09 | 3.76 |
| 2020年 | 0.014 | 7 | 3.01 | 3.48 |
3.1.3 网络重心整体呈现向南转移的特征
从总体上看,网络重心由“秦岭-淮河”一线向南转移至大别山区域(图4),重心演变路径整体上呈现出“S”形轨迹变化特征,先自东南向西北方向转移,然后从西北向东南转移,再由东往西变化的特征。2010—2013年初期网络重心位于“秦岭-淮河”一线即我国南北两大经济次区域的分界线上,这一结果与张涛等[44]的研究具有一致性,这一阶段网络重心由安徽的亳州市向西北迁移至河南的安阳市,而2013—2020年,网络重心由河南的安阳市向南迁移至信阳市,其中2018—2020年,网络重心由信阳市的东部迁移到信阳市的西部。网络重心轨迹变迁与近年来经济发展南北差距扩大的现象具有一致性。而近三年呈现出的东西变化特征,这与成渝城市群、长江中游城市群的快速发展密切相关。
图4
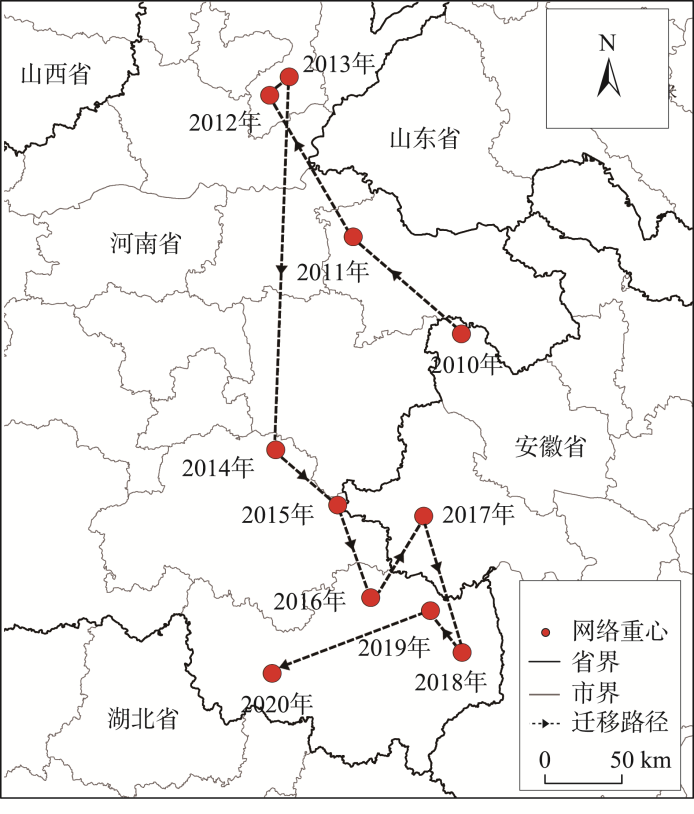
图4
2010—2020年中国城际网络重心年度变化趋势
注:该图基于自然资源部标准地图服务网站下载的审图号为GS(2019)1815号的标准地图制作,底图无修改。由于数据获取困难,本次研究不包括香港、澳门和台湾。
Fig. 4
Annual change trend of China's urban network center from 2010 to 2020
3.2 网络节点结构演变
3.2.1 具有明显幂律分布规律,网络流量集中于少数枢纽城市
从2010、2015、2019、2020年城市的中心性位序—规模分布来看,均具有明显的“长尾分布”特点(图5),进一步分析中,对各地加权入度和加权出度中心性及其位序取对数,并进行线性拟合。如图6(a)所示,2010、2015、2019、2020年各城市加权出度线性拟合优度(R2)分别达到了0.77、0.82、0.77、0.74,具有较好的线性拟合关系;如图6(b)所示,各地加权入度线性拟合优度(R2)分别达到了0.80、0.91、0.81、0.79,同样具有较好的线性拟合关系,表明各地加权入度和加权出度符合幂律分布规律,网络呈现明显的“金字塔结构”特征,即只有少数的城市作为网络主要节点,绝大多数城市贸易流动吸纳能力较弱。
图5
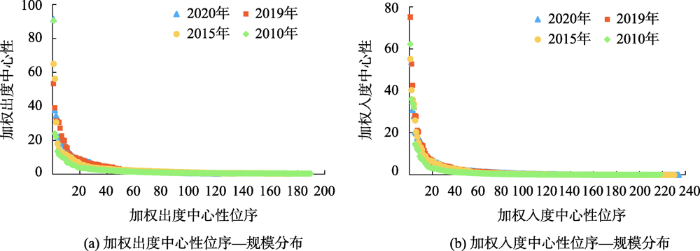
图5
2010—2020年城市加权入度和加权出度中心性位序-规模分布
Fig. 5
Changes in weighted in and weighted out central rank scale distribution of cities from 2010 to 2020
图6
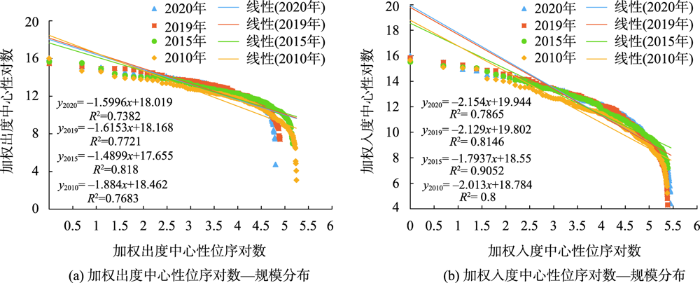
图6
2010—2020年城市加权入度和加权出度中心性双对数位序—规模分布
Fig. 6
Changes in weighted in degree and weighted out degree central two pair digit order
scale distribution of cities from 2010 to 2020
3.2.2 呈现明显的极化现象,资金流入与流出不均衡
2010—2020年,上市公司与前五大客户城际资金流入和流出总额为11.98万亿元,排名前20城市贸易总额为达到了8.6万亿元,占贸易总额的71.9%。其中北京和上海贸易总额分别为1.68万亿元和0.94万亿元,位居前两位,占贸易总额的14%和7.9%,充分显示了两大中心城市对网络的控制力。如表2所示,在加权中心度排名前20城市中,北京一直处于第一位,上海一直处于第二位,杭州、武汉、深圳、广州、成都、苏州、南京、长沙等城市均在前20以内,这些城市经济发展水平较高,上市公司数量较多,企业间贸易额较大。少数像唐山、潍坊、佛山等城市制造业水平较高,拥有大型上市公司,企业跨城贸易流量也较大。
表2 2010—2020年城际网络加权中心度排名前20城市
Tab. 2
| 排序 | 2010年 | 2015年 | 2019年 | 2020年 | |||||||
|---|---|---|---|---|---|---|---|---|---|---|---|
| 城市 | 中心度 | 城市 | 中心度 | 城市 | 中心度 | 城市 | 中心度 | ||||
| 1 | 北京 | 1520 | 北京 | 894 | 北京 | 954 | 北京 | 1269 | |||
| 2 | 上海 | 597 | 上海 | 659 | 上海 | 902 | 上海 | 1217 | |||
| 3 | 杭州 | 417 | 杭州 | 632 | 深圳 | 625 | 武汉 | 543 | |||
| 4 | 广州 | 372 | 济南 | 535 | 武汉 | 582 | 苏州 | 361 | |||
| 5 | 潍坊 | 228 | 南昌 | 419 | 长沙 | 526 | 广州 | 308 | |||
| 6 | 石家庄 | 221 | 泰安 | 391 | 南京 | 499 | 深圳 | 299 | |||
| 7 | 济南 | 219 | 深圳 | 383 | 济南 | 471 | 哈尔滨 | 279 | |||
| 8 | 深圳 | 217 | 西安 | 238 | 杭州 | 399 | 长春 | 276 | |||
| 9 | 成都 | 174 | 武汉 | 224 | 天津 | 351 | 南京 | 260 | |||
| 10 | 唐山 | 166 | 南京 | 200 | 兰州 | 312 | 济南 | 228 | |||
| 11 | 沈阳 | 151 | 长春 | 196 | 贵阳 | 274 | 石家庄 | 206 | |||
| 12 | 南京 | 128 | 成都 | 182 | 佛山 | 243 | 成都 | 203 | |||
| 13 | 西安 | 125 | 天津 | 173 | 成都 | 229 | 福州 | 202 | |||
| 14 | 太原 | 112 | 广州 | 171 | 长治 | 221 | 银川 | 197 | |||
| 15 | 武汉 | 109 | 大连 | 154 | 太原 | 221 | 乐山 | 196 | |||
| 16 | 天津 | 101 | 银川 | 141 | 宁波 | 214 | 南通 | 193 | |||
| 17 | 昆明 | 86 | 青岛 | 125 | 广州 | 193 | 佛山 | 192 | |||
| 18 | 长春 | 83 | 长沙 | 123 | 苏州 | 167 | 南昌 | 191 | |||
| 19 | 重庆 | 80 | 苏州 | 119 | 南宁 | 158 | 烟台 | 185 | |||
| 20 | 郑州 | 69 | 兰州 | 118 | 沈阳 | 145 | 天津 | 167 | |||
注:由于数据获取困难,本次研究不包括香港、澳门和台湾。
为反映资金的流入和流出情况,进一步计算不同年份网络加权入度和加权出度。2010、2015、2019和2020年有资金流出的城市分别有107、190、176、135、123个,有资金流入的城市数量分别为218、231、220、215个,反映了城市资金流入和流出空间不均衡。加权出度方面,如表3所示,北京一直处于前两位,上海在2020年位列第一位,2010年位列第二位,杭州在2015年位列为一位,济南、成都、深圳、兰州、西安等城市表现突出,这些城市上市公司数量较多,有更大的概率产生跨市贸易,此外潍坊、鄂尔多斯、佛山、南通、宿迁、茂名等城市加权出度进入前20,这些城市有的资源丰富,有的制造业基础良好,拥有一定数量和规模的上市公司,具有较强的生产能力或供应能力。加权入度方面,如表3所示,北京在2010年和2020年位居第一位,上海在2015年和2019年位居第一位,广州、深圳、济南、武汉等大城市位列前20,这些城市人口众多,产业需求和消费能力较强,推动了企业间的跨城交易活动。2019—2020年武汉市加权入度位列第二位,这是由于武汉是我国重要的重工业基地,所需的原材料均需要从外地进口。
表3 2010—2020年城际网络加权入度和加权出度排名前20城市
Tab. 3
| 排名 | 加权出度 | 加权入度 | ||||||||||||||||||||
|---|---|---|---|---|---|---|---|---|---|---|---|---|---|---|---|---|---|---|---|---|---|---|
| 2010年 | 2015年 | 2019年 | 2020年 | 2010年 | 2015年 | 2019年 | 2020年 | |||||||||||||||
| 城市 | 值 | 城市 | 值 | 城市 | 值 | 城市 | 值 | 城市 | 值 | 城市 | 值 | 城市 | 值 | 城市 | 值 | |||||||
| 1 | 北京 | 898 | 杭州 | 645 | 北京 | 527 | 上海 | 907 | 北京 | 622 | 上海 | 552 | 上海 | 751 | 北京 | 895 | ||||||
| 2 | 上海 | 236 | 北京 | 557 | 长沙 | 386 | 北京 | 374 | 上海 | 361 | 南昌 | 403 | 武汉 | 528 | 武汉 | 536 | ||||||
| 3 | 潍坊 | 216 | 泰安 | 302 | 天津 | 309 | 苏州 | 341 | 广州 | 340 | 济南 | 358 | 北京 | 427 | 上海 | 310 | ||||||
| 4 | 济南 | 130 | 济南 | 177 | 兰州 | 307 | 长春 | 218 | 杭州 | 319 | 北京 | 337 | 深圳 | 324 | 哈尔滨 | 279 | ||||||
| 5 | 成都 | 110 | 南京 | 146 | 深圳 | 301 | 深圳 | 213 | 沈阳 | 146 | 深圳 | 259 | 杭州 | 282 | 广州 | 205 | ||||||
| 6 | 石家庄 | 108 | 大连 | 124 | 济南 | 266 | 南通 | 183 | 唐山 | 138 | 武汉 | 205 | 南京 | 277 | 福州 | 199 | ||||||
| 7 | 杭州 | 97 | 深圳 | 124 | 南京 | 221 | 济南 | 179 | 深圳 | 122 | 长春 | 182 | 贵阳 | 211 | 南昌 | 177 | ||||||
| 8 | 深圳 | 95 | 西安 | 119 | 佛山 | 198 | 佛山 | 179 | 石家庄 | 113 | 杭州 | 153 | 济南 | 205 | 银川 | 176 | ||||||
| 9 | 南京 | 88 | 成都 | 115 | 宁波 | 192 | 烟台 | 169 | 济南 | 89 | 广州 | 133 | 南宁 | 157 | 乐山 | 169 | ||||||
| 10 | 太原 | 85 | 兰州 | 113 | 成都 | 157 | 兰州 | 160 | 西安 | 77 | 银川 | 131 | 太原 | 143 | 天津 | 139 | ||||||
| 11 | 天津 | 63 | 上海 | 107 | 上海 | 151 | 长治 | 141 | 武汉 | 74 | 西安 | 119 | 长沙 | 140 | 玉溪 | 126 | ||||||
| 12 | 鄂尔多斯 | 63 | 长沙 | 102 | 杭州 | 117 | 南京 | 136 | 长春 | 73 | 青岛 | 96 | 长治 | 137 | 南京 | 124 | ||||||
| 13 | 龙岩 | 62 | 北海 | 96 | 茂名 | 109 | 石家庄 | 118 | 成都 | 64 | 泰安 | 88 | 广州 | 116 | 成都 | 105 | ||||||
| 14 | 昆明 | 53 | 宿迁 | 94 | 哈尔滨 | 98 | 咸阳 | 114 | 重庆 | 53 | 天津 | 88 | 伊春 | 101 | 东营 | 94 | ||||||
| 15 | 大同 | 50 | 天津 | 85 | 岳阳 | 96 | 广州 | 104 | 郑州 | 51 | 苏州 | 76 | 安庆 | 90 | 海口 | 89 | ||||||
| 16 | 西安 | 49 | 茂名 | 79 | 苏州 | 94 | 成都 | 98 | 南京 | 40 | 沈阳 | 70 | 石家庄 | 84 | 石家庄 | 89 | ||||||
| 17 | 苏州 | 48 | 南通 | 74 | 昆明 | 94 | 齐齐哈尔 | 93 | 天津 | 38 | 厦门 | 69 | 郑州 | 78 | 深圳 | 86 | ||||||
| 18 | 烟台 | 41 | 昆明 | 68 | 洛阳 | 87 | 贵港 | 91 | 合肥 | 36 | 黄山 | 68 | 苏州 | 73 | 延安 | 73 | ||||||
| 19 | 无锡 | 36 | 郑州 | 67 | 沈阳 | 87 | 无锡 | 86 | 昆明 | 33 | 成都 | 67 | 成都 | 72 | 长沙 | 71 | ||||||
| 20 | 武汉 | 35 | 海门 | 60 | 长治 | 85 | 乌鲁木齐 | 85 | 嘉兴 | 31 | 重庆 | 65 | 百色 | 67 | 杭州 | 67 | ||||||
注:由于数据获取困难,本次研究不包括香港、澳门和台湾。
3.3 网络联边结构演变
3.3.1 网络联边空间结构由沿海向“T”形结构转变
如图7所示,从联系的空间分布来看,中西部地区贸易网络密度和强度明显偏低,主要的贸易流动路线均分布在“胡焕庸线”的东南一侧,反映了我国经济贸易活动的经向性特征。从联系的流向上来看,呈现以沿海为主轴的格局逐渐转向“T”形结构特征。2010年北京与上海、广州的互动格局特征显著;2015年北京与吉林、北京与上海、上海与深圳、上海与南昌贸易关系密切,东中部地区联系强度开始加强;2019年东西联系进一步密切,呈现出核心城市之间、省会城市之间、城市群之间的强联系特征,京津冀、长江三角洲、长江中游、珠江三角洲等城市群成为贸易联系的集聚区;2020年长江三角洲和长江中游城市群贸易互动关系明显增强。
图7
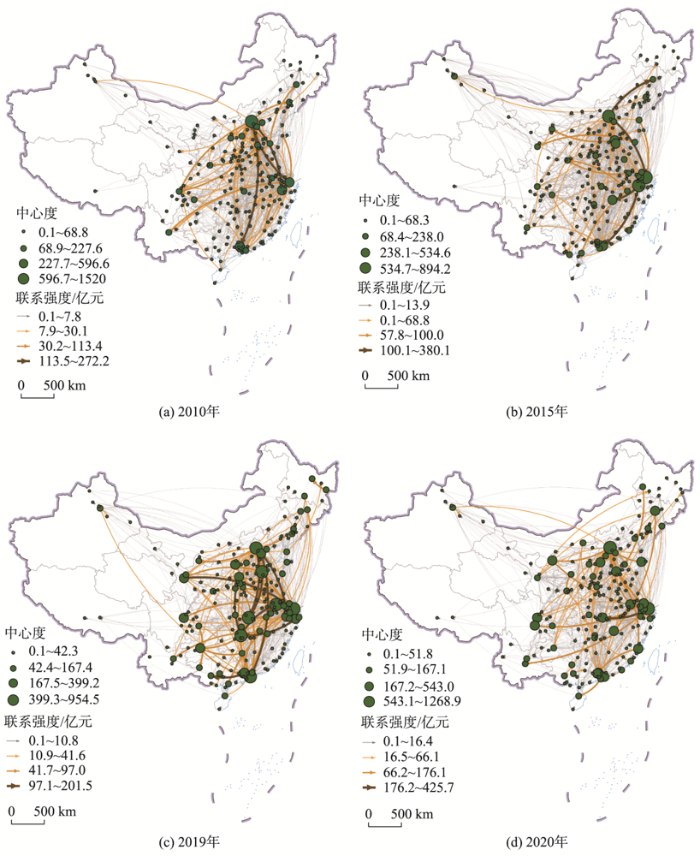
图7
2010—2020年中国城际网络演化格局
注:该图基于自然资源部标准地图服务网站下载的图号为GS(2019)1815号的标准地图制作,底图无修改。由于数据获取困难,本次研究不包括香港、澳门和台湾。
Fig. 7
Evolution pattern of China's urban network from 2010 to 2020
从联系骨架来看,联系骨架数量持续增加。2010年主要网络骨架为北京→广州、北京→杭州、上海→北京,集中在北京、上海、杭州、深圳4个城市;2015年主要网络骨架为北京→上海、上海→南昌、上海→深圳;2019年主要网络骨架为北京→深圳、北京→杭州、北京→长沙、北京→武汉、上海→兰州、杭州→长沙,中部的长沙、武汉参与形成核心网络骨架;2020年受新冠疫情的影响,城市间网络骨架呈现萎缩的趋势,城市间的联系强度下降趋势显著。总的来看核心城市间的强链信息印证了中国城际网络关系更多地发生在经济规模较大、政治资源丰富的城市之间[33]的观点。
3.3.2 网络联边层级结构呈现高等级集聚的特征
从联系层级来看,2010—2019年高等级贸易联边数量持续增长。如表4所示,170亿以上贸易联边数从2010年的2条增长到5条,所占比重由0.17%提升到0.53%; 60~170亿以上贸易联边数从3条增长到20条,所占比重从0.26%增长到2.12%;15~60亿元贸易联边数从36条增长到67条,所占比重从3.14%增长到7.1%。而低等级贸易联边数量减少,15亿以下的贸易连变数从1104条减少到852条,所占比重从96.42%降低到90.25%,这说明中国城际“贸易流”呈现明显的高等级集聚化的倾向。2020年高等级贸易联边数明显减少,与2019年相比,170亿以上贸易联边数下降为2条,占比仅为0.22%,60~170亿以上的下降为15条,占比下降到了1.68%,这表明新冠疫情明显削弱了城际网络联系强度。
表4 2010—2020年中国城际网络联系规模分等级统计
Tab. 4
| 流量等级 /亿元 | 2010年 | 2015年 | 2019年 | 2020年 | |||||||
|---|---|---|---|---|---|---|---|---|---|---|---|
| 城市对/对 | 所占比重/% | 城市对/对 | 所占比重/% | 城市对/对 | 所占比重/% | 城市对/对 | 所占比重/% | ||||
| >170 | 2 | 0.17 | 3 | 0.23 | 5 | 0.53 | 2 | 0.22 | |||
| 60~170 | 3 | 0.26 | 8 | 0.61 | 20 | 2.12 | 15 | 1.68 | |||
| 15~60 | 36 | 3.14 | 52 | 3.99 | 67 | 7.10 | 62 | 6.94 | |||
| <15 | 1104 | 96.42 | 1240 | 95.17 | 852 | 90.25 | 814 | 91.15 | |||
| 总计 | 1145 | 100.00 | 1303 | 100.00 | 944 | 100.00 | 893 | 100.00 | |||
3.4 网络社团结构演变
通过计算,网络模块度位于0.38~0.62之间,其中2010、2015、2019年的网络模块度分别是0.41、0.54、0.55、0.625,符合Q值取值要求,且呈现出社团划分更加明显的趋势。如图8所示:2010年,贸易网络分为北京—上海、深圳—广州、杭州、厦门、长沙、西安等社团,其中北京—上海社团规模最大,城市数量达65个;2015年,随着贸易网络的不断壮大,北京、上海分化成为独立的社团核心,其中北京社团城市数量最多,有42个,上海社团城市数量紧随其后,有34个;2019年,北京、上海社团的绝对优势更加显著,贸易网络分为北京、上海、深圳、南京、天津等社团,北京、上海社团的城市数量进步增加,分别为47和43个。2020年,新冠疫情影响下,贸易网络社团进一步分化重构,广州—深圳社团明显增强,城市数量达到53个,超越北京社团的47个,上海社团的城市数量减少至24个。
图8
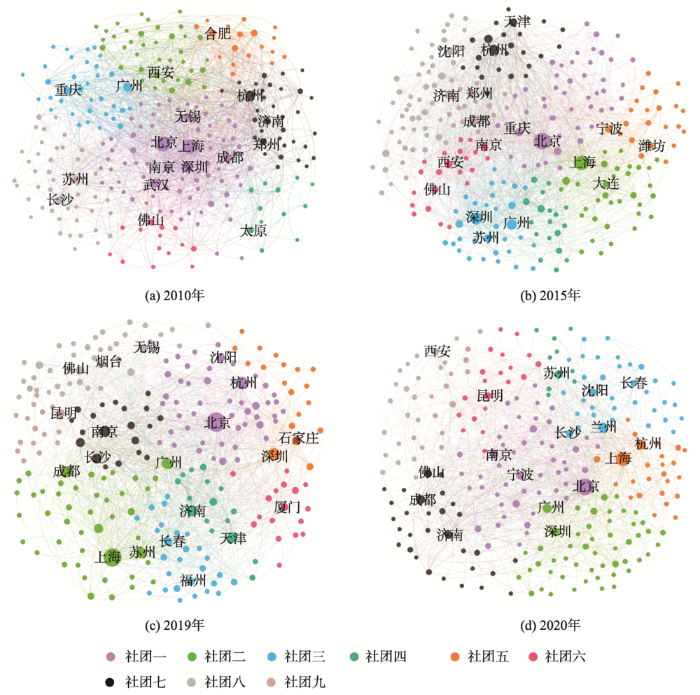
图8
2010—2020年中国城际网络社团结构演化
注:图中用从小到大的圆圈表示从低中心度到高中心度。由于数据获取困难,本次研究不包括香港、 澳门和台湾。。
Fig. 8
Evolution of China's urban network cluster structure from 2010 to 2020
3.5 局部网络结构演变
3.5.1 城市群间网络密度先升后降,网络中心性明显增加
为进一步探析网络局部特征,对重点城市群间网络进行分析。根据国家“十四五”规划所明确的19个主要城市群,构建城市群之间的贸易网络。从网络核心边缘特征来看,京津冀、长江三角洲、珠江三角洲三大城市群的核心地位较为稳固,长江中游、成渝、关中等城市群的节点地位明显提升,网络多中心性有明显提升。2020年整体网络有所退化,第二层次网络核心节点数量减少,网络联系度下降(图9)。从整体网络密度来看,网络密度由2010年的0.571上升到2015年的0.632,而后下降至2019年的0.584,呈现先上升后降低的特征,意味着部分城市群间联系出现了链接中断,如中原城市群与兰西城市群的单向贸易往来关系中断。而平均加权度由2010年的144.6增长到2019年的221.2,印证了网络贸易联系越来越集中在少数核心城市群之间的观点。2020年,网络密度进一步下降至0.531,网络平均加权度下降至9.632,说明新冠疫情对我国城市群间的网络密度和强度均有明显的削弱作用。
图9
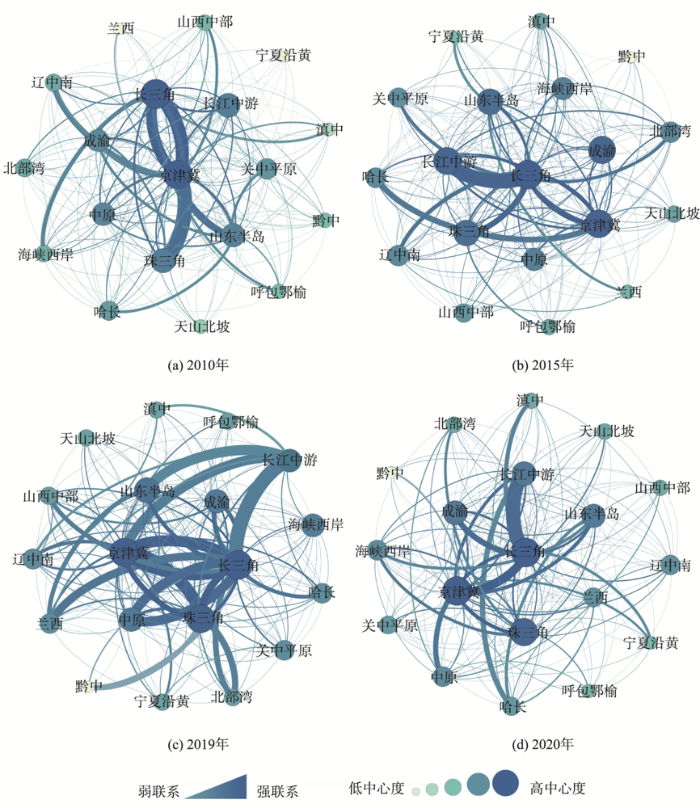
图9
2010—2020年城市群尺度贸易拓扑网络演化
注:由于数据获取困难,本次研究不包括香港、澳门和台湾。
Fig. 9
Evolution of trade topology network at the scale of urban agglomeration from 2010 to 2020
3.5.2 城市群内部网络差异显著,呈现网络分化特征
进一步对京津冀、长江三角洲、珠江三角洲、长江中游、成渝五大城市群内部网络结构进行分析。如表5所示,五大城市群贸易网络密度同样呈现先升后降的趋势,与整体网络密度一致。五大城市群贸易网络密度最高的为珠江三角洲城市群,位于0.324~0.334之间,因其城市数量较少,距离较近,发生贸易可能性更大,长江中游城市群最低,仅位于0.104~0.123之间。从贸易总流量来看,长江三角洲贸易总流量最大,2019年达到了783.5亿元,是第二名珠江三角洲的3倍多,反映了城市群规模差异显著,从平均流量来看,珠江三角洲城市群平均贸易流量达到17.2亿元,位居第一,长江中游城市群和成渝城市群总流量和平均流量均较低。从网络平均度来看,长江三角洲城市群平均度最高,位于6.96~11.24之间,珠江三角洲和京津冀位列第二、三位,长江中游城市群和成渝城市群最低。从核心城市数量来看,总体上呈现由单中心向多中心转化的特征,2010年城市群核心城市均只有1个,2019年核心城市数量均有明显增加,其中长江三角洲增加到5个,这与各城市群区域发展空间结构具有一致性。整体来看,2020年的新冠疫情对城市群内部网络结构产生较大的影响,网络各项指标均呈现不同程度的降低,其中长江中游城市群下降趋势最为明显,贸易总流量下降了近70%,2020年初武汉及其周边城市是疫情的中心区域,疫情的封控对企业间的跨城贸易产生了明显影响。
表5 2010—2020年主要城市群内部网络 复杂性特征统计指标
Tab. 5
| 城市群 | 年份 | 平均度 | 平均加权度 | 网络密度 |
|---|---|---|---|---|
| 长三角城市群 | 2010 | 6.96 | 82 883 | 0.152 |
| 2015 | 8.71 | 194 413 | 0.161 | |
| 2019 | 11.24 | 213 053 | 0.224 | |
| 2020 | 8.21 | 156 421 | 0.145 | |
| 京津冀城市群 | 2010 | 2.74 | 77 570 | 0.256 |
| 2015 | 4.43 | 202 247 | 0.257 | |
| 2019 | 4.17 | 327 493 | 0.278 | |
| 2020 | 4.28 | 274 561 | 0.241 | |
| 珠三角城市群 | 2010 | 5.34 | 59 914 | 0.332 |
| 2015 | 5.13 | 210 280 | 0.324 | |
| 2019 | 5.24 | 345 636 | 0.334 | |
| 2020 | 5.21 | 234 523 | 0.325 | |
| 长江中游城 市群 | 2010 | 2.90 | 17 434 | 0.108 |
| 2015 | 3.44 | 108 360 | 0.112 | |
| 2019 | 3.59 | 245 360 | 0.123 | |
| 2020 | 3.13 | 84 561 | 0.104 | |
| 成渝城市群 | 2010 | 2.38 | 25 878 | 0.151 |
| 2015 | 3.57 | 56 229 | 0.223 | |
| 2019 | 4.42 | 113 041 | 0.244 | |
| 2020 | 3.28 | 43 215 | 0.192 |
4 讨论
城市连锁网络模型是当前基于企业视角的城市网络研究中最具影响力的模型,基于这模型转译的企业内部网并非完全真实的网络联系,当前基于企业内部联系视角的城市网络研究更多关注于对网络转译方法的改进[45]。基于企业内部的垂直联系侧重于反映企业的投资关系和区位选择,无法较好地反映出区域之间的产业关联和贸易协作,城市网络功能的内涵具有差异性。本文基于企业间联系的城际网络骨架呈现出从南北联系向“T”形结构转变的空间特征,不同于绝大部分基于企业内部联系的城市网络所表现出的“菱形”空间结构[33,35-36],这说明基于不同数据来源和不同方法所构建的城市功能网络的结构具有差异性,未来要加强对基于企业间视角的城市网络研究。
企业间的要素流动网络是国内大循环的重要组成部分,本研究对优化国内大循环有如下政策启示:① 推动国内大循环多中心网络发展,要加快推动区域要素向城市群集聚,构建结构合理的城市群贸易网络结构,以城市群统一大市场建设为抓手推动国内大循环多中心网络结构发展,要重点培育长江中游城市群、成渝城市群,带动关中、中原、哈长、辽中南、北部湾等城市群的发展;② 打造多层次国内大循环核心城市,优化核心城市的产业链、供应链,重点推动北京、上海、广州、深圳等一线城市的核心带动作用,率先通过市场化改革,重点推动创新要素和生产性服务要素的跨区域流动,推动商品的在更大范围的自由流动,构建国内大循环核心增长极,大力推动杭州、厦门、武汉、成都、重庆等龙头企业集聚的城市开展更大范围的跨区域贸易合作;③ 促进外围中小城市融入国内大循环,中西部地区中小城市、边缘城市要积极融入国内产业链、价值链,发挥资源优势、农业优势和生态优势,瞄准发达地区消费市场,找准自身定位,走出一条融入国内大循环的差异化的发展路径,城市群周边及外围地区中小城市要加快承接中心城市产业与生产要素转移,提升区域内分工与合作深度,精准对接大城市消费市场需要,加大与城市群中心城市的贸易联系。
尽管本文所采用的数据量较大,但企业之间的联系还包括非上市公司之间的联系,这类联系是区域联系的重要组成部分,因此本研究还无法完全反映出城市之间的联系,未来要加强对非上市公司之间的城际网络研究。此外,基于不同行业的企业间的城际网络空间结构势必会有差异性,未来将加强对不同行业间企业联系网络的研究。
5 结论
本文基于上市公司与其前五大企业客户交易数据,将企业间贸易网络转化为城市联系网络,采用复杂网络、重心模型等方法,从全国和城市群两个尺度系统分析2010—2020年我国城市网络结构的时空演变特征,研究发现:
(1) 2010—2020年我国城际贸易总量和节点数量呈先增后降的变化趋势,整体网络密度位于0.014~0.018之间,网络呈现出先快速增长,后缓慢降低的特征;网络平均路径长度均保持在2.85~3.17之间,整体呈现出小世界特征;网络重心演变路径呈现出“S”形轨迹变化特征,整体呈现出向南移动的特征,网络联边结构呈现出沿海结构向“T”形结构转变的特征。
(2)资金流入和流出具有明显的不均衡性,集中在少数城市,资金流入和流出总额排名前20的城市交易额占交易总额的71.9%;北京、上海始终处于网络的核心地位,广州、深圳、武汉、杭州等城市处于次核心地位,佛山、南通、齐齐哈尔等制造业水平较高的城市也表现出一定的网络地位;网络社团中北京社团、上海社团核心地位日趋稳固,广州-深圳社团明显增强,说明广州、深圳产生了较强的强强组合效应。
(3)城市群间网络密度先升后降,网络中心性明显增加,贸易流量集中于少数核心城市群之间的联系;五大城市群中,珠江三角洲城市群城际贸易网络的连通性最好,网络密度位于0.32~0.33之间,长江三角洲贸易总流量最高,达到了780.5亿元,而珠江三角洲平均贸易流量最高,长江中游城市群和成渝城市群网络密度和贸易流量均较低,要进一步加大对中西部城市群的扶持力度。
(4)新冠疫情对城际贸易网络流量产生了较大影响,整体网络的流量、城市群间和内部的网络流量都呈现明显的下滑,其中整体网络流量下降了15.9%;受新冠疫情的影响,网络节点度的差异明显扩大,上海、北京节点中心度明显增强,均超过了1200,其他城市呈现不同程度的下降;网络骨架呈现萎缩的趋势,第一层及和第二层级联边数量较2019年分别减少了3条和5条。未来要加强对省会城市和地级市间贸易网络的“修复”力度,强化省会城市之间以及地级市之间的联系,加大对中西部城市群上市公司培育力度,增强其内外部网络联系,提升城际网络韧性。
参考文献
World-city network: A new metageography?
[J].
基于企业股权关联的城市网络研究——以长三角地区为例
[J].
DOI:10.13249/j.cnki.sgs.2019.11.010
[本文引用: 1]

选取全行业企业的投资数据,通过逐一计算海量企业股权联系的所有可能链接路径,提出了利用企业之间联系研究城市网络的新思路。对长三角地区进行实证研究,结果表明:有向网络中,上海、杭州与合肥是区域资本集散中心。其中,上海是整个区域的链接枢纽,对江苏的辐射影响尤为突出。无向网络中,上海与杭州的核心地位明显,但淮北、衢州等边缘性节点的网络层级也大幅提升。上海、杭州与合肥加速了整个区域的一体化进程,南京的网络地位有较大的提升空间。
Mapping urban network through inter-firm investment relationship: A case study of Yangtze River Delta
[J].Currently, existing articles about urban network from the perspective of firm relationship mainly use frims’ spatial and organizational structure to quantify intra-firm linkages, and then to study connections between cities. However, such research method neglects inter-firm linkages, especially those linkages among different-industry firms, resulting in thelack of authenticity in establishing urban network. Investment linkages between enterprises often bring the flow of institutions, knowledge and talents, which opens a new window for the study of inter-firm linkages. Therefore, this study uses investment data of all-industry enterprises published by ‘Tian Yan Cha’ website to propose an alternative way for establishing urban network. The data of ‘Tian Yan Cha’ website are authorized by the State Administration of Industry and Commerce, and have been widely used in business investigation and economic research. Through digging out all possible investment linkage routes between each two firms from massive data, this study chooses the Yangtze River Delta as the empirical strudy area in order to discover some new characteristics of urban network in node hierarchy and link under the support of real enterprises’ investment behavior. The study results show that in directed urban network, Shanghai, Hangzhou and Hefei are regional capital distribution centers. Among these cities, Shanghai is the linkage hub of the whole region, while Hangzhou and Hefei dominate their provincial cities respectively. One interesting phenomenon is that Shanghai produces strong effects on cities of Jiangsu Province, which indirectly weakens Nanjing’s network status. Nanjing's disadvantaged status is also related to its insufficient amount of data involved in the analysis, which implies that Nanjing’s firms prefer investing outside the Yangtze River Delta. In undirected urban network, cities’ intermediary effect vary dramatically, the strength of Shanghai and Hangzhou becomes more obvious. At the same time, the network status of some peripheral cities including Huaibei and Quzhou has been significantly promoted, and the former city has an energy tycoon firm producing large amount of investment linkages and the latter city is famous for its ‘family firms’. As the intermediary hub, Shanghai stimulates the integration process of the Yangtze River Delta while Hangzhou and Hefei mainly play the role of ‘bridge’ in connecting their provincial cities and Shanghai. There are nearly none prominent intermediary nodes in Jiangsu Province, which demonstrates that there is great room for Nanjing to improve its network status. There are 3 research topics deserve further attention. The first is the investment amount is more accurate in quantifying urban linkages than investment frequency. Secondly is study on single-industry firm investment may explain why gap exists between some city’s network status and their economic status. The last is that the massive firm investment data inevitably lead to magnitude differences, how to eliminate the influence of data quantity on the basis of guaranteeing network characteristics remains to be explored.
The world city hypothesis
[J].
Information flows among major metropolitan areas in the United States
[J].
Specification of the world city network
[J].
中国城市体系网络化研究
[J].
DOI:10.11821/dlxb201904005
[本文引用: 1]
当前,学者普遍认同城市体系研究的重心从等级范式向网络范式转向。在大量的文献梳理基础上,阐述20世纪80年代以来中国城市体系研究范式的转向过程,并进一步梳理中国城市网络研究的进展、问题与关注重点。结果表明:2010年之后,网络成为中国城市体系研究的主流范式,等级体系文献数量呈波动递减趋势,全国和长三角成为热点关注区域;属性数据一定程度上弥补了早期城市网络研究中数据匮乏的状况,关系数据应成为未来研究的侧重点;不同研究视角及其所应用的数据存在着一定的局限性,多元视角的综合研究成为趋势。在此基础上,提出城市网络研究未来可能的突破点,包括:调整国家城市网络的研究框架、超越交通数据直接考察城市间的实体联系、测度企业外部的横向联系、有向加权网络分析和可视化、增加研究中的地理“意味”等。
Research progress of networking of urban systems in China
[J].At present, there is a consistency that the focus of urban system research has shifted from the hierarchical to network paradigm. Based on an extensive review of existing studies, this paper investigates the shift of paradigm of China's urban system research since the 1980s, and discusses the development situation, main problems, and key topics of related research on urban network. The results show that: (1) After 2010, the amount of literature about urban network has increased dramatically and become the mainstream of urban system research, while the number of studies on the hierarchy system decreased. And the existing studies mainly focus on the urban system at national level and in the Yangtze River Delta. (2) The attribute data to a certain extent compensate for the lack of data in the early urban network research. Meanwhile, although the gravity model was widely used in these studies, its suitability is gradually decreasing. (3) In contrast, the relationship data have attracted scholars' attention, which is mainly applied to the urban system research from three perspectives: enterprise organization, traffic flow and information flow. However, due to the limitations of different perspectives, a comprehensive research on multiple perspectives has gradually become imperative. (4) The identification analysis has been the dominant theme of urban network research. Visualization analysis and design for urban system is mainly supported by directed unprivileged networks and undirected weighted networks. (5) Five important aspects of urban network research in future include adjusting the research framework of national urban network, examining the physical connections between cities directly without traffic data, measuring the horizontal linkages between the outside enterprises, analyzing and visualizing the directed weighted network research, and intensifying the geospatial characteristics of urban network research.
中国城市信息网络结构演变特征及驱动因素分析
[J].
DOI:10.3969/j.issn.1004-9479.2020.04.2019284
[本文引用: 1]
信息流能够客观反映城市社会经济联系,对城市网络研究具有重要价值。基于2011、2014和2017年中国城市间信息关注度数据,利用社会网络分析法,从网络密度、中心度、城市联系等方面分析中国城市网络结构的演变特征及其驱动因素,研究表明:1)城市信息网络结构明显拓展但网络总体联系强度仍较低;省域内部信息联系强度高于跨区域联系,信息联系仍受行政区划的影响较大。2)网络节点中心度显著提高,热点区主要集中在东部沿海三大城市群;中西部部分区域核心城市如重庆、成都、郑州等成长为全国性核心城市,但中西部地区城市信息发展仍与东部地区差距较大。3)信息联系层级分布特征明显,并呈现局部区域联系紧密、区域一体化特征;核心网络由以北京、上海为核心的“轴-辐”结构演变为以“北京-上海-广深-成渝”为核心的“菱形”结构。4)信息化水平、经济发展基础、城市职能等互补性因素,网络营销、大事件效应等介入性因素及信息技术变革、城市群建设等高效性因素相互作用,共同促进信息网络结构优化重组。
Analysis on the evolution characteristics and driving factors of urban information network structure in China
[J].Information flow can objectively reflect the social and economic linkages of cities, and is of great value to the study of urban networks. Based on the 2011, 2014 and 2017 intercity information attention data, we analyze the evolution characteristics and driving factors of urban network structure in China from the aspects of network density, centrality, urban linkages by the social network analysis method. It shows that:1) The structure of urban information network has been significantly expanded, but the overall strength of the network linkages is still low. The strength of urban linkages within provinces is far higher than that of cross-region, it is still heavily influenced by administrative territorial entity.2) The centrality of information network nodes has been significantly improved. The hot spots are mainly concentrated in the three major urban agglomerations along the eastern seaboard. Some central and western regional core cities such as Chongqing, Chengdu and Zhengzhou have grown into national core cities, but there is still a big gap between the mid-western and the eastern region of information development.3) The hierarchical distribution of urban information network is obvious, and it presents the characteristics of local area close connection and regional integration. The core network evolved from "axis-spoke" structure with Beijing and Shanghai as its core to a diamond structure with Beijing-Shanghai-Guangzhou,Shenzhen-Chengdu, Chongqing as its core.4) Complementary factors such as information level, the basis of economic development, urban functions, and the intervening factors of network marketing, and big event effect, as well as high-efficiency factors such as information technology reform, urban agglomeration construction are interacted to promote the optimization and reorganization of information network structure.
知识流动空间的城市关系建构与创新网络模拟
[J].
DOI:10.11821/dlxb202004004
[本文引用: 1]
知识经济时代城市间的创新关系是新时代城市间相互作用关系的新内涵,研究者尝试采用各种方法探索城市间创新关系及其网络特征。然而,如何从理论上建构知识流动空间的城市间创新关系?如何设计更加合理的城市间创新网络模拟方法?这些问题却少有专门探讨。基于相关研究,本文提出了城市间创新关系构建的理论框架,认为城市间创新网络本质上是区别于“硬网络”的“软网络”,是一种主观的关系建构过程,需要经过异城创新主体间的点—点关系向城—城之间关系的尺度转换,这一转换过程容易发生夸大或偏离城市间客观存在的创新关系,对结果的精确度产生很大影响,应对关系建构给予充分理论论证;本文论述了4种城市间创新关系建构和网络模拟方法,包括科技成果异城合作的城市间无向网络构建方法、科技成果转让转移的城市间有向网络构建方法、高端人才跨城移动的城市间创新网络建构方法和创新企业机构多城分布的城市间创新网络建构方法,并运用相关数据进行了模拟试验与结果展示,来反映城市间创新关系的不同方面。本研究有助于推动从城市地理学视角和城市关系的维度探讨全球/区域的创新空间格局,为城市间创新网络研究提供理论和方法支撑。
The theoretical construction and network simulation of intercity innovative relationships in knowledge flow space
[J].The interactive relationships between cities in the knowledge economy era have attracted much attention. Researchers have applied a range of methods to explore intercity innovative relationships and associated network characteristics. It nevertheless remains unclear just how intercity innovative relationships can be theoretically constructed based on knowledge flow space and how further scientific simulation methods can be designed. Research questions in this area have rarely been explored in detail, an issue which has inevitably placed obstacles on further exploration. A framework for the theoretical construction of intercity innovative relationships is presented in this study; the basis for this research is that an intercity innovation network is essentially a 'soft network', distinct from a 'hard network'. These interconnections are founded on a subjective relationship construction process and therefore necessitate scale transformation from 'point-point' connections between innovative subjects in different cities with respect to 'city-city' interactions. At the same time, this transformation process is prone to exaggerations and deviations from objective intercity innovative relationships and therefore exerts considerable influence on the accuracy of results such that constructions must be entirely theoretical. Four construction methods for intercity innovative relationships and network simulation are summarized in this study, including an intercity undirected network based on cross-city co-operations between scientific and technological achievements, an intercity directed network based on the cross-city transfer of scientific and technological achievements, an intercity innovation network based on the cross-city flow of high-end talents, and an intercity innovation network based on the multi-city distribution of innovative enterprises and institutions. Simulation tests were then undertaken using relevant data to reflect aspects of these relationships. The results of this analysis are conducive to further exploration of global and regional innovative spatial patterns from the perspective of urban geography and intercity relationships and provide a theoretical and methodological foundation for further research on intercity innovation networks.
Knowledge polycentricity and the evolving Yangtze River Delta megalopolis
[J].
“流空间”视角下高速公路交通流网络结构特征及其形成机制——以广东省为例
[J].
DOI:10.11821/dlyj020210050
[本文引用: 3]
交通流是城市经济联系最显性的表现,为更清晰地识别城市网络结构提供了新视角。本研究采用高速公路联网收费数据作为交通流“关系数据”,综合图论、社会网络分析法(SNA)和GIS空间分析,以广东省为研究区域探索高速公路交通流网络空间结构特征,并利用QAP回归法探究影响网络形成的因素。结果表明:① 广东省高速公路已形成典型的网络式空间结构,具有“小世界”网络效应。其节点度值服从幂律无标度分布,交通出入量基本平衡,节点重要性自区域中心向外围递减;网络有向边权值等级差异显著,优势交通流具有“向心指向”特征和距离依赖性。② GDP、常住人口、社会消费品零售总额、县区间行驶距离等已成为影响广东省高速公路交通流网络形成的重要因素。其中人口因素是影响城市间交通流动的主要因素,网络形成受制于距离因素,消费因素逐渐成为刺激城市间交通流动的强大动力。③ 广东省高速公路交通流动模式分为邻近指向型、中心指向型和等级指向型三种,以邻近指向型为典型模式。研究结果对于揭示交通流动规律,丰富城市网络理论,推动道路合理规划和区域协调发展具有重要理论和实践意义。
Spatial structure and formation mechanism of expressway traffic flow network based on space of flows: A case study of Guangdong Province
[J].Traffic flow is the most powerful indicator to map urban economic connections, which provides a new perspective to identify urban network spatial structure clearly. This study uses Guangdong's data to explore the spatial structure of expressway network based on theory of synthesized graph, social network analysis (SNA) and GIS spatial analysis. QAP regression method is used to explore the factors which influence the network characteristics. The results show that: (1) The Guangdong's expressway forms a typical network spatial structure with “small world” network effect. The out-degree and in-degree values of network nodes follow the power law scale-free distribution, traffic volume is basically balanced, and the importance of nodes decreases from regional center to periphery. There are significant differences in the weights of directed edges, and the dominant traffic flows have the characteristics of “centripetal direction” and “distance dependence”. (2) The results of QAP regression show that the character of Guangdong's expressway traffic flow network is significantly affected by GDP, resident population, total retail sales of consumer goods, and the distance. Population is the most powerful factor which affects inter-city traffic flows, the formation of network is restricted by distance, and the consumption factor is gradually becoming a powerful driving force to stimulate the inter-city traffic flows. (3) The traffic flow patterns of expressway in Guangdong are divided into three types, namely, proximity-oriented, central-oriented and hierarchical-oriented. The proximity-oriented traffic flow is typical, which is widely distributed in the province; the central-oriented traffic flow is concentrated in the Pearl River Delta urban agglomeration; and the hierarchical-oriented traffic flow is mainly distributed between Guangzhou and Qingyuan, and between Shenzhen and Shantou. The research results have important theoretical and practical significance for revealing the laws of traffic flow, and enriching urban network theory. Furthermore, it provides theoretical support for scientific road planning and coordinated regional development.
Connetivity of intercity passenger transportation in China: A multi-modal and network approach
[J].
基于腾讯迁徙大数据的中国城市网络研究
[J].
DOI:10.11821/dlxb202104006
[本文引用: 1]
随着经济全球化和区域一体化的快速发展,城市间的交流日益密切,要素的流动性和互赖性促进了城市网络的形成,并成为一种新的区域组织模式和空间结构。本文基于2018年腾讯人口迁徙数据,构建了372×372关系数据矩阵,并从不同交通方式出发,系统刻画了中国城市网络格局。研究表明:① 网络关联度高的城市主要集中在胡焕庸线以东区域,尤其是长三角、珠三角、京津冀、成渝等城市群地区的聚集程度最高,成为中国城市网络格局的主控力量;而西北半壁的城市处于被支配地位。② 依据迁徙量,将中国城市网络划分为国家级、大区级、区域级、地方级和基座级网络。城市网络结构随交通方式而变化,当网络等级下移时,节点城市趋于增多,网络密度加大,但网络范围趋于缩小,网络等级与迁徙路径存在着密切的关联性,国家级网络与空运相关,区域级网络与铁路运输相呼应,地方级网络与汽车运输相关。③ 不同运输方式的经济时空距离决定了网络结构,是引致网络随路径不同而产生分异的基本因素。
China's City network based on Tencent's migration big data
[J].With the rapid development of economic globalization and regional integration, the connection between cities is increasingly close. The mobility and interdependence of elements have promoted the formation of city network and become a new regional organization model and spatial structure. Based on Tencent's migration data, this paper constructs a 372×372 relational data matrix, and systematically depicts the city network pattern in China from different modes of transportation. The results show that cities with high network correlation degree are mainly concentrated in the area east of the Hu Huanyong Line, especially in the Yangtze River Delta, Pearl River Delta, Beijing-Tianjin-Hebei region, Chengdu-Chongqing region and other urban agglomeration areas, which have the highest concentration and become the main control power of China's city network pattern; and the cities in the northwest half are at a disadvantage status. According to the amount of migration, the Chinese city network is divided into national, large regional, regional, local and pedestal networks. The city network structure changes with the mode of transportation. When the network level moves down, the number of node cities tends to increase and the network density increases, but the network range tends to shrink. There is a close correlation between the network level and the migration path. National-level network related to air transportation, regional network related to railway transportation, and local network are relevant to automobile transportation. The economic space-time distance of different transportation modes determines the network structure, which is the basic factor that causes the network to differentiate with different paths.
基于百度迁徙数据的中国城市网络结构特征研究
[J].
DOI:10.12082/dqxxkx.2021.210223
[本文引用: 1]
迁徙流作为互联网时代的新产物,信息流、资本流、交通流等流空间的基本载体,能客观地反映城市间地理行为关系,对于刻画城市网络结构具有重要意义。基于地级以上城市的百度迁徙大数据,本文尝试从全域和净迁徙的视角探索研究中国城市网络结构特征,对其网络的层级、关联关系和影响因素等进行挖掘提取。研究发现:① 全国城市网络呈现出稳定的、层级明确的三棱锥四顶点“钻石型”结构,与主要城市群的经济规模空间分布相吻合;② 区域网络表现出向高级别行政中心集聚的“核心—外围”放射状结构;③ 以省会城市为核心的典型小世界特征比较凸出,小世界网络的可达性和连通性较高;周口、阜阳、赣州、上饶、重庆等作为主要劳动力输出型城市,深圳、东莞、广州、北京、上海等城市成为了主要的外来人口聚集地,并形成了对应的人口就近输送网络关系;④ 城市的行政地位、经济规模、交通枢纽建设、劳动力资源等因素都对其网络控制力和影响力起到了决定性作用。最后,研究结合中国城市网络结构特征及其主要影响因素,提出相关政策建议,以期为中国城市网络结构均衡发展与建设提供借鉴依据。
Research on the characteristics of urban network structure in China based on Baidu migration data
[J].
中国异地投资网络结构演化及影响因素研究
[J].
DOI:10.18306/dlkxjz.2021.08.001
[本文引用: 1]
随着城市间经济联系日益密切,资本跨区域流动逐渐成为影响区域发展的关键因素,企业异地投资是资本流动的微观体现,探讨企业异地投资特征对于区域发展具有重要意义。为此,论文以1998—2018年中国上市企业异地投资数据为研究对象,构建中国异地投资网络,从全国和东中西3大地区角度分析异地投资网络的空间演化特征及影响因素。研究发现:全国和3大地区异地投资网络节点中心性空间集聚特征明显,主要集中在5大城市群地区;异地投资网络空间上表现出明显的层级结构、空间集聚性、路径依赖等特征;投资净流入和净流出城市仍主要位于东部地区,但投资活动存在向中部和西部发展的趋势;城市的经济发展水平、产业结构、金融环境等均对全国和东中西3大地区呈现差异化的影响。
Change and influencing factors of China's cross-regional investment network structure
[J].
中国城市间投融资网络结构及其影响因素
[J].
DOI:10.3969/j.issn.1004-9479.2020.02.2019044
[本文引用: 1]
基于企业网络联系构建城市网络研究是近年来的研究热点。以往研究多运用企业总部与分支机构的空间位置关系建立企业内部联系,以构建城市网络,缺少从企业间实际联系层面对城市网络的研究。本文利用企业间跨城市投融资关系建立城市联系并探究其驱动机制,为中国城市网络研究提供了新的思路。研究发现:①2013—2016年全国企业间跨城市资本流动数量不断增加,全国范围内投融资覆盖面越来越广,资本越发集中于大城市。②中国资本流动城市网络基本形成了以京津冀、长三角、珠三角、成渝地区以及武汉等城市为重要节点相互联系的空间结构,京深、京沪和深沪是网络中最重要的城市联系对。③长三角城市群内部联系最为密切,形成的城市网络最为复杂,资本活跃程度高;京津冀、珠三角城市群内部城市间联系相对较弱,“核心-边缘”结构分化较为严重。④中国城市网络嵌入在独特的制度环境中,市场和政府作用共同导致了城市网络空间结构演化。
Spatial structure and influencing factors of urban investment and financing network in China
[J].In recent years, it has been an increasing number of studies on the construction of urban networks based on network of firms, in particular, using intra-firm links established by spatial location of headquarters and branches to build urban networks. Different from previous researches, the article builds interurban capital flow network based on the inter-city investment and financing relationship of companies, and finds that:1) The number of interurban capital flows among enterprises increases from 2013 to 2016, and the cover range of investment and financing is becoming wider. Capital is increasingly concentrated in large cities.2) Beijing-Tianjin-Hebei Region, Yangtze River Delta, Pearl River Delta, Chengdu-Chongqing area and Wuhan area stand out in the urban networks shaped by China’s capital flows. The capital flows among Beijing, Shanghai and Shenzhen are the most important connections in the network.3) Compared with the Beijing-Tianjin-Hebei Region and the Pearl River Delta, the internal links of the Yangtze River Delta are more complex and stronger, with a higher level of activity of capital.4) The interurban capital flow is embedded in China's unique institutional environment. The market and the government have influenced the evolution of spatial structure of urban network together.
Change in the world city network,2000-2012
[J].
World Cities of scientific knowledge: Systems, networks and potential dynamics. an analysis based on bibliometric indicators
[J].
基于“蜂鸣—管道”模型的中国城市知识合作模式及其对知识产出的影响
[J].
DOI:10.11821/dlxb202204013
[本文引用: 1]
知识经济与网络社会时代,知识合作网络成为理解城市创新过程的重要视角。在知识合作网络中,存在两种不同类型的合作模式,即“本地蜂鸣”和“全球管道”。本文以“蜂鸣—管道”模型的逻辑思想和理论假设为基础,探讨区域内和跨区域两种不同城市知识合作模式的特征及其对城市知识产出的影响。首先提出了蜂鸣与管道的测度方法;然后以“Web of Science”数据库为基础构建了中国20个城市群的知识合作网络,考察了网络中蜂鸣和管道的演化路径和组合特征,归纳出城市知识合作模式的不同类型;最后,通过计量模型揭示了蜂鸣和管道对城市知识产出的影响。结果显示:① 中国城市知识合作网络中的蜂鸣与管道表现出渐进积累和自我强化的空间演化特征;② 根据蜂鸣和管道的组合特征,可将城市划分为“网络型”“外向型”“孤岛型”“内向型”4类,不同类型的城市在知识网络中的空间分布规律和发展演进路径存在差异;③ 根据负二项回归模型发现,蜂鸣与城市知识产出呈倒“U”型关系;管道与城市知识产出显著正相关;此外,两种合作模式在促进城市知识生产的过程中存在互补效应。
Knowledge collaboration patterns of Chinese cities and their impacts on knowledge output: An empirical study based the “buzz-and-pipelines” model
[J].
Structure of Chinese City network as driven by technological knowledge flows
[J].
基于铁路客流的湖北省城市网络关联与空间组织结构特征
[J].
DOI:10.12082/dqxxkx.2020.190539
[本文引用: 1]
以湖北省为研究对象,基于铁路客流的动态关系数据,采用城市网络连锁模型,以城市之间铁路客流的流动性和集聚性为研究切入点,辨析省域城市的网络关联强度和空间组织结构特征。研究表明:① 湖北省域城市网络结构初步形成,整体呈现“东强西弱,北低南高”的态势,省域“单中心”网络格局特征突出,武汉是链接鄂东、鄂中、鄂西三大区域的核心枢纽;② 中心城市指向性和地域邻近指向性特征明显,整体受省域中心城市武汉的影响较大,与之紧密联系的周边城市是构成武汉“1+8”都市圈的主体;③ 交通轴线是客流联系的主要方向,以“十堰—襄阳—荆门—武汉”、“恩施—宜昌—荆州—武汉”等城市为主体的“>”型城市带,其空间组织结构联系较为紧密,是推动湖北省经济发展和实施城镇化战略的重要载体,同时襄阳、宜昌在鄂西地区的枢纽作用日益凸显。最后基于实证研究结论,为省域空间规划的要义、趋势和取向提出了若干探讨。
Research on the characteristics of urban network assocoation and spatial organization structure based on railway passenger flow in Hubei Province
[J].
京津冀科技合作网络的演变特征及影响因素
[J].
DOI:10.11821/dlxb202206005
[本文引用: 1]
构建层次分明、结构合理的科技合作网络对于推动京津冀协同创新具有非常重要的作用。本文从基于知识创新的科研合作网络和基于技术创新的技术合作网络的角度,使用合作论文和合作专利数据,采用社会网络分析法对2013—2018年京津冀地区地级及以上城市之间科技合作网络的演变特征进行了分析,并基于半参数估计和面板计量模型实证检验了影响京津冀78个城市对之间科技合作的主要因素。主要结论为:① 京津冀科研合作网络快速成长,呈现北京与天津双核引领,以京津为主轴、京保石为次轴的空间结构。② 京津冀逐渐形成了以北京为主中心,天津、石家庄为次中心,廊坊、保定、沧州为三级枢纽,其他城市为节点的技术合作网络结构。③ 空间距离越近的城市之间越容易产生科技合作,高铁开通带来的时空距离压缩可以减弱科技合作的空间衰减系数;相对于科研合作,技术合作对于空间距离更为敏感;技术邻近性是促进城市间科技合作的主要驱动因子,尤其是对技术合作的促进效应更为明显;经济发展差距越小的城市之间相对容易产生技术合作。
Evolutionary characteristics of science and technology cooperation network of Beijing-Tianjin-Hebei region and its influencing factors
[J].Building a hierarchical and reasonable structured science and technology cooperation network plays a very important role in promoting collaborative innovation in Beijing-Tianjin-Hebei region (BTH). This paper analyzes the evolutionary characteristics of the science and technology cooperation network between cities in the BTH during 2013-2018 from two perspectives: the research cooperation network based on knowledge innovation and the technology cooperation network based on technology innovation. This paper uses micro data of collaborative papers and collaborative patents and applies social network analysis to examine the evolutionary characteristics of the science and technology cooperation network between cities in the BTH from 2013-2018, and empirically tests the influence of 78 pairs of city in the study area on the science and technology cooperation based on panel econometric model factors. The main conclusions can be drawn as follows. First of all, the rapid growth of the research cooperation network of the BTH presents a spatial structure characterized as the twin cores of Beijing and Tianjin, with Beijing-Tianjin as the main axis and Beijing-Baoding-Shijiazhuang as the secondary axis. Second, the BTH gradually formed a technical cooperation network structure with Beijing as the main center, Tianjin and Shijiazhuang as secondary centers, Langfang, Baoding and Cangzhou as tertiary hubs, and other cities as nodes. Finally, small distance plays a positive role in science and technology cooperation between cities, and the compression of spatial and temporal distance brought by the operation of high-speed rail can weaken the spatial attenuation coefficient of science and technology cooperation. Compared with research cooperation, technical cooperation is more sensitive to spatial distance. Technological proximity is the main driving factor for promoting science and technology cooperation between cities, especially the promoting effect on technological cooperation is more obvious. The smaller the gap of economic development, the easier it is to generate science and technology cooperation cooperation between cities.
中国地级及以上城市网络结构韧性测度
[J].
DOI:10.11821/dlxb202106006
[本文引用: 1]
随着城市间关系趋向于网络化发展以及外部急性冲击和慢性压力的增加,城市网络结构韧性作为衡量区域韧性的重要手段,致力于评估城市网络系统在面对突发故障或扰动时,能够抵御、吸收和恢复原有网络特征和重要功能的能力。以中国346个地级及以上城市为研究对象,采用2017年百度指数、腾讯人口迁徙大数据等,在构建信息、交通、经济和综合城市联系网络的基础上,从城市节点和网络层面对其层级性和匹配性进行测度,并对中断场景下网络的传输性和多样性进行分析,进而针对各网络从不同视角提出网络结构优化策略和建议。结果表明:① 2017年中国346个地级及以上城市的信息、交通、经济和综合联系网络整体上呈现以“胡焕庸线”为界的“东密西疏”的分布格局,但空间结构各有特点。② 信息、交通和经济三大网络的层级性排名依次为经济>信息>交通网络。大城市及省会城市因其信息技术的快速创新与传播、产业经济的高度发展与集聚及交通基础设施的快速配备与完善在网络中具有更高的层级。③ 信息、交通、经济三大网络均具有异配性特征。信息网络中高权重节点与低权重节点间的跨区域交流机会更多,因而具有最高的异配韧性。④ 信息网络的传输与多样韧性稍高于经济网络,远高于交通网络。同一城市节点的故障或中断在影响网络传输性的同时,也会累及网络的多样性。
Network structure resilience of cities at the prefecture level and above in China
[J].With the rapid development of information technology, the interweaving physical infrastructure and virtual urban networks show more abundant connotations. As one of the most effective indicators to measure regional resilience, urban network structure resilience focuses on the capacity of the urban network system to restore, maintain, or improve the original network characteristics and important functions when faced with external acute shock and chronic pressure. Therefore, evaluating the resilience of the urban network structure is of great significance for recognizing and understanding regional resilience. Taking 346 cities of China at the prefecture level and above as the research objects, this study constructed information, transportation, economic, and comprehensive connection networks based on the Baidu index, Tencent location services, and social statistics data. The resilience of the urban network was then measured and evaluated in four aspects: hierarchy, heterogeneity, transmissibility, and diversity. The last two properties are in interrupting simulation scenarios. Accordingly, the optimization strategies and suggestions for the network structure were put forward. Based on the results, the following conclusions can be drawn: (1) Although China's information, transportation, economic, and comprehensive networks among the 346 prefecture-level cities and above in 2017 presented a spatial pattern of "dense in the east and sparse in the west" with "Hu Huanyong Line" as the boundary, their spatial structures exhibit their own characteristics. (2) The hierarchy of information, transportation, and economic networks from strong to weak is in the following order: economic network > information network > transportation network. Large cities and provincial capital cities have a higher hierarchy in a network because of the rapid innovation and dissemination of information technology, the high development and agglomeration of industrial economy, and the rapid allocation and improvement of traffic infrastructures. (3) The three major networks of information, transportation, and economy are all heterogeneous. In the information network, there are more opportunities for cross-regional communication between high-weighted and low-weighted nodes, thereby exhibiting the highest heterogeneous resilience. (4) The transmissibility and diversity resilience of information network was slightly higher than those of the economic network and much higher than those of the transportation network. Failures or perturbations of a city have almost the same impact on network transmissibility and diversity. Cities that have a great impact on the resilience of China's urban network structure typically exhibit high centrality and control power. These cities not only have a higher level of economic development and a relatively sound transportation hub, but also exhibit superiority with regard to their geographical conditions and distribution of natural resources.
长三角城市创新网络凝聚子群发育机制研究——基于多值ERGM
[J].
Development mechanism of cohesive Subgroups' urban innovation networks in the Yangtze River Delta:Based on the valued ERGM
[J].
流空间视角下中国城市群网络结构特征比较——基于铁路客运班次的分析
[J].
DOI:10.12082/dqxxkx.2022.210309
[本文引用: 1]
铁路客流是城市群内经济社会联系的重要反映,也是区域流空间的关键体现。本文依据流空间理论,采用复杂网络方法和2018年中国铁路班次OD数据,从全国尺度分析城市群社区结构特征,并从城市群尺度比较分析了5个主要城市群的空间结构、规模结构和网络节点结构。结果显示,从铁路客运班次联系来看,城市组团片区与国家规划方案中的城市群在范围上存在一定的空间错位。5个主要城市群具有不同的局部特征:① 长江三角洲城市群呈网络状的空间形态和相对集聚的规模分布,主要问题为局部节点的枢纽作用与规模的匹配性有待提高;② 珠江三角洲城市群呈放射状的空间形态和相对集聚的规模分布,主要问题为与全国其他城市群的联系相对薄弱;③ 京津冀城市群呈放射状的空间形态和相对集聚的规模分布,主要问题为存在边缘化的节点;④ 长江中游城市群呈组团状的空间形态和相对分散的规模分布,主要问题为内部结构较为松散;⑤ 成渝城市群呈哑铃状的空间形态和相对集聚的规模分布,主要问题为与全国其他城市群的联系薄弱。随着区域一体化进程,需要根据不同城市群网络结构发展阶段的差异,补足城市群内和城市群间的联系短板,促进规模位序结构与网络结构的耦合协调,推动建设层次分明、枢纽协作、网络化发展的客运服务网络,支撑城市群一体化发展。
Comparison of network structure patterns of urban agglomerations in China from the perspective of space of flows: Analysis based on railway schedule
[J].
基于人口流动的城市内部空间结构特征及其影响因素分析——以南京市为例
[J].
DOI:10.11821/dlyj020210597
[本文引用: 1]
当前,“流”空间视角的城市网络结构研究方兴未艾,而城市内部急需寻找到稳定的网络结构分析框架与形成机制模型。在此背景下,本文聚焦通勤和休闲两类有向人流网络,以南京为研究对象,利用中心性与控制力、社区划分、改进重力模型等方法,解析南京内部的人流网络结构特征及其影响因素。结果显示:① 对空间尺度的分解可以有效识别全域-局域两个层次的空间结构。南京江南主城的“单极化”发展态势明显,主要表现为江南主城是通勤流与休闲流的密集流入地,且集中了各类型引力中心,兼具地方服务和区域服务功能。② 改进重力模型对全域人口流动强度的拟合效果较好,人口数量和空间距离在很大程度上影响着人口流动,职住比和人均POI数量分别是通勤流、休闲流的方向调节器。重力模型低估了浦口区、高淳区等政策重点倾斜地区的人流集散能力。
Analysis of urban internal spatial structure characteristics and its influencing factors based on population flow: A case study of Nanjing
[J].At present, the research on urban network structure from the perspective of “flow space” is in the ascendant. Compared with the fruitful results at the regional scale, the stable network analysis framework and formation mechanism model of city-group have not yet been built. It is urgent to comprehensively use the urban regional network analysis method and expand it at the microscopic scale. At the same time, more and more attention has been paid to the city hierarchy and assortativity in the network context. In this research context, focusing on two types of directed flow of people: commute and recreation, this paper takes Nanjing as the study area, and uses the methods of centrality and control, community division and improved gravity model to analyze the characteristics and influencing factors of urban network association from the city-local level. The results show that: (1) The decomposition of spatial scale can effectively identify the city-local structure of commute and recreation. Nanjing presents a “unipolar” development trend of the main city to the south of the Yangtze River. The main performance is that the main city to the south of the Yangtze River attracts intensive commute and recreation flows, and it has all types of centers, providing both local and regional service. (2) The results show that the improved gravity model has a good fitting effect on the real flow of people in the whole area, and the number of residents and spatial distance limit affect the flow of residents to a great extent. The occupation residence ratio and per capita POI amount are the direction regulators of commuting flow and leisure flow respectively. The difference of functional energy levels of township streets determines the interpretation of gravity model to local pedestrian network. The gravity model underestimates the distribution capacity of people flows in Pukou district, Gaochun district and other key policy inclined areas.
基于多维要素流视角的城市群网络结构及影响因素分析——以武汉城市圈为例
[J].
Analysis on the network structure of urban agglomeration and its influencing factors based on the perspective of multi-dimensional feature flow: Taking Wuhan urban agglomeration as an example
[J].
Power and position in the world city system
[J].
Struggles and strategies of rural regions in the age of the ‘urban triumph’
[J].A bourgeoning literature is stressing the crucial importance of agglomeration economies provided by large cities for personal, business and territorial development. One of the main reasons for the economic, demographic and social struggles of rural regions is exactly the lack of such agglomeration benefits. This paper explores the question of which broad strategies can make rural economies more competitive in the age of the 'urban triumph' by organising the presence of a higher level of agglomeration benefits in rural regions. Theoretically, three strategies are discerned: a) 'borrowing size' in infrastructural, transport and organisational networks to lap into' some of the benefits of surrounding or other metropolitan areas; b) urban concentration to develop a single, more attractive urban center in the rural region; and c) the formation of a strongly integrated network of complementary towns and cities in the rural region. The implementation of these strategies is often complicated, as we document for the rural province of Zeeland in the Netherlands. From an overarching perspective, it has been particularly internal fragmentation that has led to further marginalisation, peripheralisation and the missing of many opportunities to 'borrow size'. The strategies defined here show that rural regions are not unfortunate victims of the tendencies leading to the 'urban triumph', but have the potential to reap the benefits of agglomeration themselves.
基于企业视角的城市网络研究进展、思考和展望
[J].
Progress, thoughts, and prospect of urban network research based on enterprise perspective
[J].
基于企业网络视角的城市网络研究进展与展望
[J].
Progress and prospect of urban networks research through the lens of corporate networks
[J].
中国城市的网络地位及影响因素研究——基于上市公司500强企业网络视角
[J].
DOI:10.13249/j.cnki.sgs.2020.05.008
[本文引用: 3]
利用2016年中国上市公司500强企业网络数据和隶属联系方法构建城市网络,解析了中国城市的网络地位分异格局,并定量测度了城市网络地位的影响因素,在城市网络“行为-结构-绩效”分析框架下解释了地位分异的动力机制。研究发现:正则等价性模型识别的15个正则等价块分化为首位者、经纪人、接收者和孤立者4个地位类型;地位间关系呈现“核心-半边缘-边缘”结构特征,其中首位者地位的正则等价块形成凝聚子群并占据网络权力的核心,经纪人和接收者地位的块位于半边缘位置,孤立者地位的块处于网络权力的边缘;市场潜力、政治资源、知识资本、区位条件和发展基础是中国城市网络地位的关键影响因素;规模偏好、择优选择、地理临近和路径依赖构成了城市网络地位分异的动力机制。城市网络的发展倾向于扩大城市间发展差距,中国城市化政策和城市治理体系需要做出相应调整。
Network position and underlying factors of cities in China: A study from corporate networks of the largest 500 public companies
[J].This article aims to analyze the spatial structure and its determinants of network positions of cities to serve the purposes of developing urban network theory and improving urbanization policy in China in the new era. Data on headquarter and branch locations of the largest 500 listed companies in China in 2016 are subjected to ownership linkage model to approximate the urban network, and regular equivalence block techniques are employed to generalizing about the configuration of position of cities in the system, leading to 15 blocks and 4 positions, i.e. primacy, broker, snob and isolates. Then the influence factors are examined by using 2 broad types of econometric models, i.e. ordinal logit model and multinomial logit model, and the mechanism is explored under the “behavior-structure-performance” conceptual framework of urban network growth. 4 main findings are concluded. First, the 15 blocks identified from applying the regular equivalent criterion can be allocated to 4 positions: 3 blocks occupy what Burt terms the primacy position, 5 blocks occupy the broker position, 3 blocks occupy the snob position, the rest 4 blocks are in the isolation position. Second, the image matrix resulting from the density criterion to the block-model density table reveals that the relationship among the blocks presents a core-peri periphery-periphery characteristics, in which the primacy blocks are located in the core, forming a high densely clique and playing the role of “headquarter cities”, the broker and snob blocks are located in the outskirt, while the isolation blocks are in the periphery, playing the role of “branch plant cities”. Third, market potential, key resources, location conditions and development basis are the key factors affecting the position of China's urban network. The improvement of economic scale, population size, political power, knowledge capital and network facilities will greatly enhance the network position in China, increasing the odds of cities being in the primacy position while decreasing the probability in the snob and isolate position. Fourth, the expansion of urban network space in China is a process of preferential attachment, geographical proximity and path dependence, which will further strengthen the power of cities with traditional advantages such as larger economic scale, rich political resources, etc. Under the environment of network development, China’s urbanization policy and urban governance system need to be adjusted accordingly. The Chinese government must actively respond to the possibly increasing gap between cities under the network environment and promote the cooperation between cities on a larger spatial scale.
长江经济带城际生产性服务业网络联系的边界效应及多维机制
[J].
Boundary effect and multi-dimensional mechanism of inter-city producer services network in Yangtze River economic belt
[J].
独角兽企业内部联系视角下中国城市创新网络空间结构研究
[J].
DOI:10.18306/dlkxjz.2020.10.006
[本文引用: 2]
独角兽企业是新经济时代不同形式创新的集中组织和整合,其内部联系及空间组织反映了区域创新网络的格局和特征。论文基于独角兽企业内部联系,通过总部—分支机构联系模型构建中国城市创新网络,运用社会网络分析方法从网络层级、关联模式、网络节点3个层面探究新经济时代中国城市创新网络的空间结构和特征。研究表明:① 独角兽企业内部联系视角下中国城市创新网络呈现“1+3+N”的核心城市驱动发展格局,“北上杭深”组合领跑全局,空间极化现象明显;② 中国城市创新网络的空间结构整体呈菱形结构,且明显呈东强西弱的格局;强联系主要发生在核心节点城市之间,其他城市通过与重要节点城市连接进入网络,网络核心—边缘结构突出;③ 重要的节点城市在城市创新网络中展示出较强的权力和威望,但在网络中发挥的作用有一定差异。研究可为新时代中国城市创新网络的研究提供新的视角,文中构建的独角兽指数亦可为城市创新综合实力评估研究提供参考。
Spatial structure of urban innovation network based on the Chinese unicorn company network
[J].Unicorn company, a new term in today's business climate, is the integration of different types of innovations in the new era, and its internal relations and spatial organization reflect the pattern and characteristics of regional innovation networks. Consistent with the emerging entrepreneurship and the rapid development of the Internet, increasingly more unicorn companies appear in China, which provides an opportunity for us to catch a glimpse of China's innovation development through a new perspective. In this study, we used the ownership linkage model to map China's urban innovation network based on 164 Chinese unicorn companies' internal relations, and analyzed the spatial structure through the following social network analysis perspectives: urban hierarchy, association pattern, and city nodes. The "unicorn index" was developed as an indicator to evaluate the development and magnitude of a city's unicorn companies as well as its innovation environment and position in the network. Cities of high unicorn index values rank high in the urban innovation network hierarchy, which constitutes four tiers in a pyramid-shaped structure with 253 cities, only nine of which are in the top three tiers. Among them, Beijing, Shanghai, Hangzhou, and Shenzhen show their innovative activity and advanced development in the unicorn entrepreneurship. To analyze the association pattern, we calculated the network density, assortativity coefficient, and the degree correlation for the network. The results show that most cities are not closely linked with each other in this generally loose-association urban innovation network, while intensive connections only happen between the cities with high unicorn index, highlighting an intensive-connection diamond-shaped structure. To further examine each city node, we regard outdegree as its innovative influence and "power", indegree as its innovative attraction and "prestige", and eigenvector centrality as its connectivity. We found that Beijing and Shanghai still play leading roles in the innovation network, but Nanjing and Wuhan start to exhibit innovative attraction and potential. In conclusion, the development of urban innovation network is driven by four leading cities—Beijing, Shanghai, Hangzhou, and Shenzhen, showing a spatial polarization character. The network pattern highlights a diamond structure whose activity weakens from the east to the west. Cities having high unicorn index are strongly linked to each other and playing important roles while other cities enter the network by establishing links to those cities, shaping the core-periphery network structure. Moreover, those important cities enjoy power and prestige and have various influences in the innovation network. This study provides a new look into China's urban innovation network and some insights for policymakers to promote urban innovation. Also, the unicorn index can be considered in city innovation evaluation.
基于千强高新技术企业的中国城市创新网络研究
[J].
DOI:10.3969/j.issn.1004-9479.2021.05.2020071
[本文引用: 2]
在我国创新驱动发展战略的背景下,城市发展中的创新要素变得空前重要,基于创新型企业联系数据研究城市创新网络成为当今城市发展的重要议题。选取2018年中国创新能力1000强的高新技术企业总部和分支机构信息,基于核密度分析法和连锁网络模型,对企业布局和城市创新网络结构进行研究。研究表明:(1)高新技术企业主要聚集于中国三大沿海城市群及部分中西部中心城市;(2)中国城市创新网络大致呈现出菱形结构,城市创新能力差异显著且具有等级性,城市间的创新联系主要通过等级扩散形成;(3)不同行业视角下的城市创新网络结构差异性显著,依据行业属性可将创新型城市划分为科技创新型城市、工业创新型城市和服务创新型城市。研究以期推动传统产业转型升级,实现城市创新发展,为创新型城市制定针对性发展模式提供科学参考。
high tech - nology enterprises
基于物流企业数据的2007—2017年年中国城市网络空间特征及演化
[J].
DOI:10.13249/j.cnki.sgs.2020.05.010
[本文引用: 1]
采用2007、2012和2017年中国百强物流企业网络数据,运用世界城市网络研究的链锁网络模型方法,分析中国城市网络的等级结构、空间分异、空间联系及其演变特征。研究表明:基于物流企业数据的中国城市网络具有明显的层级特征,并呈现“两主多中心”的区域空间结构,网络联系的离散水平逐渐降低,其稳定性和均衡性有所增加,等级结构趋于合理;各节点城市组织能力空间分异明显,京津冀、长三角、珠三角的组织能力和介中心性始终处于较高水平,城市间物流联系逐渐增强,并有协同发展的趋势;城市网络联系中,长江沿线城市物流网络联系地位上升,上海为中心的T字型空间结构替代以北京为中心的核心网络结构,在全国尺度形成以胡焕庸线为界线,物流联系网络呈中东部密集、西部相对稀疏的空间格局,其演变过程呈现由等级网络联系特征向等级性与空间近邻性网络联系特征转变趋势。
The spatial characteristics and evolution of Chinese urban network based on logistics enterprise data in 2007-2017
[J].Urban system and network are the hot topics of worldwide urban and regional research. There is a plenthora of literature on the urban network from the perspective of passenger, information and business flow. But there is a big gap in the urban network from the perspective freight flow. This article analyzed the hierarchical structure, spatial differentiation, spatial connection and evolution characteristics of Chinese urban networks using the interlocking network model, which is established by the theory of global urban networks. The network data of China's top 100 logistics enterprises in 2007, 2012 and 2017 is introduced into the model. Results indicated that the urban network of China based on logistics enterprise data was hierarchically characterized obviously. And presented a regional spatial structure of ‘two main and multi-center’. The discrete level of network connection was in gradually decreasing, its stability and balance were increasing, and the hierarchical structure tended to be reasonable. The spatial differentiation of organizational capacity of each node city was obvious, and the organizational capacity of Beijing-Tianjin-Hebei Region, the Yangtze River Delta and the Pearl River Delta were continuously at a high level in comparison. There was a trend of synergistic development among cities. In terms of urban network connection abd the linkage status of urban logistics networks along the Yangtze River rises, Shanghai, as the center of the T type space structure, is replaced with Beijing as the center of the core network structure. Taking Hu Line as the boundary, a dense spatial pattern in the East and relatively sparse in the west part had been formed. And it concluded that the spatial pattern evolved from hierarchical network connection to hierarchical and spatial proximity network connection.
基于文化产业企业网络视角的中国城市网络空间结构研究
[J].
DOI:10.18306/dlkxjz.2020.01.008
[本文引用: 1]
论文通过对230家“新三板”文化产业挂牌企业总部—分支机构关联数据的收集、整理和分析,对文化产业视角下中国城市网络的空间结构特征进行研究,比较文化产业城市网络与其他类型城市网络的差异性,并探索影响文化产业城市网络空间格局的经济社会因素。结果表明:① 中国文化产业挂牌企业地理分布呈现出地域分散但数量集中的特点,城市网络空间分布高度不均衡,并未表现出常见的“菱形结构”;② 网络核心节点以东中部发达城市以及少数具有特殊资源的城市为主,多数城市的对外输出能力有限;③ 城市网络扩散以核心节点城市间的等级扩散为主,邻近城市间的扩散效应不明显,同时本地网络(即城市内部网络)对文化企业组织结构的贡献度低于跨地域网络;④ 不同类型文化产业在网络结构上表现出较为明显的差异,反映其市场需求和发展条件的不同;⑤ 地方政府作用和城市产业结构是影响中国文化产业企业布局和网络格局形成的重要因素,其他社会经济因素的作用则较为不明显,反映出中国文化产业的独特性。
Spatial structure of urban networks in China based on the perspective of cultural industry enterprise networks
[J].In recent years, urban networks have become a focus of research in geography, urban studies, and other related disciplines. While previous research has examined the urban networks in China from different perspectives, the networks generated by cultural industries have remained a largely unexplored area. This article aims to fill this gap by presenting a comprehensive analysis of the spatial structures of the cultural industry-generated urban networks in China's mainland and compares the disparities between these networks and the urban networks created by other types of economic activities. Data of the headquarter-affiliation connections of 230 NEEQ (National Equities Exchange and Quotations)-listed cultural firms in 2017 were collected and analyzed using social network analysis method. In addition, the article also explores the economic and social factors that shape the formation of the spatial patterns of China's cultural industry urban networks drawing on the method of multiple linear regression (MLR). The outcomes reveal that: First, shaped by both market mechanisms and the interventions of local governments, the distribution of the NEEQ-listed cultural firms demonstrates a geographically dispersive, but quantitatively concentrated pattern in China. The spatial structure of the cultural industry urban networks is highly uneven, with most inter-city connections concentrated in the eastern part of the country. The cultural industry urban networks do not exhibit the typical diamond-shaped structure that has been observed in many other urban networks in China. Second, the core nodes of the cultural industry urban networks are mainly economically advanced metropolises in the eastern and central areas, as well as a few minor cities that possess some special local assets, including large film and television studios, unque natural or humanistic environment, and preferential tax policies. Most cities are receivers instead of exporters of cultural industry functions. Third, the expansion of the cultural industry urban networks is mainly between the core nodes of different hierarchies instead of between geographically proximate cities. The contribution of local (intra-urban) networks to the formation of intra-firm relationships of cultural industries is weaker than that of trans-local networks, which indicates that, compared with the advantages of geographical proximity, the complementarity of market or resources is the primary factor considered by cultural firms during their expansion. Fourth, the urban networks of different subsets of cultural industries have rather diverse spatial structures, which reflect the varied market demands and development conditions of different cultural industry activities. Fifth, according to the outcome of MLR analysis, the function of local governments and urban industrial structure are two important factors that shape the location strategy of cultural firms and the pattern of cultural industry urban networks in China, whereas the impacts of other economic and social factors are not significant. The article enriches our understanding of the spatial organization of cultural industries and the diversity of modern urban networks. It also sheds light on cultural industry development policies in the Chinese context.
中国互联网企业空间演化与城市网络特征研究
[J].
Spatial evolution of China's Internet enterprises and the characteristics of city network
[J].
基于企业并购联系视角的中国城市网络演变研究
[J].
Research on evolution of China's urban network based on merger and acquisition linkages
[J].
基于汽车产业供应链体系的中国城市网络特征研究
[J].
DOI:10.11821/dlyj020190060
[本文引用: 1]
结构特征与权力等级是城市网络的重要要素。基于“产业-区位”视角,通过对2012年中国汽车产业供应链体系分析,凝炼中国城市网络特征。研究发现:① 基于汽车产业供应链体系的中国城市网络表现出明显的“低密度-多核心、高聚类-少趋同”的结构特征。② 城市网络的结构特征与权力等级存在显著“悖论”,即城市节点的网络地位不仅取决于链接城市的数量,还需考虑关联网络的空间属性和资本容量。③ 城市网络权力等级中既包括上海、重庆等领导核心城市,也包括广州、芜湖等中心集约城市和苏州、成都等权力门户城市,说明转变中心性与转变控制力不仅能有效揭示中国城市网络节点的真实权力属性,也更符合经济现象的地理空间非均衡规律。④ 重庆、上海、天津、长春、北京、十堰等领导核心城市并未完全锁定中国六大汽车产业集聚区,其中长三角地区网络权力最突出,珠三角地区网络权力最弱。
The characteristics of China's urban network based on the supply chain system of automobile industry
[J].Structural characteristics and power hierarchy are important elements of urban networks. This paper studied the selection of China's automobile industry supply chain system in 2012 by using "China automobile industry enterprise information Daquan", "China industrial enterprise database" and "China automobile supplier network", and analyzed the characteristics of China's urban network from the perspective of "industry-location". The results showed that: Firstly, based on the supply chain system of automobile industry, China's urban network showed obvious structural characteristics of "low density, multi-core, high clustering, less convergence". Secondly, there existed a "paradox" between the structural characteristics and power levels of cities in the urban network, which means that the network status depended not only on the number of linked cities, but also on the spatial attributes and capital capacity of the associated networks. Thirdly, the urban network power level included not only the leading core cities such as Shanghai and Chongqing, but also the central intensive cities such as Guangzhou and Wuhu, and the power gateway cities such as Suzhou and Chengdu. The result suggested that the "alter-based centrality" and "alter-based power" could not only effectively reveal the real power attribute of China's urban network nodes, but also kept more in line with the unbalanced law of geographical space of economic phenomena. Fourth, leading core cities, including Chongqing, Shanghai, Tianjin, Changchun, Beijing, Shiyan, etc., did not completely take over the six major automotive agglomerations in China, among which Yangtze River Delta region was at the highest level in the power hierarchy whereas the Pearl River Delta region was at the bottom. Finally, it should be noted that the supply chain system of automobile industry was only a special situation between "urban agents", and its research conclusions could not be infinitely copied and promoted, and could not replace the relevant conclusions of other factor flows.
全球人才流动网络复杂性的时空演化——基于全球高校留学生流动数据
[J].
DOI:10.11821/dlyj020181156
[本文引用: 1]
高质量的人才跨越地理的流动影响和驱动着全球范围内的创新活动,正在重塑世界经济格局。研究基于全球高校留学生流动数据,构建加权有向网络模型,对2001—2015年全球人才流动网络复杂性时空演化进行全面刻画。主要结论如下:① 全球人才流动网络规模迅速扩大,网络发育具有明显的小世界性,两级分化显著。② 全球人才流动网络呈典型“金字塔结构”特征,基本呈“东向西,南到北”的地理格局,新兴国家作为人才吸纳国的角色逐渐上升。③ 全球人才流动网络核心-边缘结构显著,核心国家间存在较强的关系流,边缘国家间联系较弱,其人才主要流向了核心国家和半边缘国家。④ 全球人才流动网络分化成美国社团、欧盟社团、中国社团、南美和南非社团、马来西亚社团、独联体社团等6个凝聚子群。
Spatiotemporal evolution of global talent mobility network based on the data of international student mobility
[J].High-quality talents are reshaping the world economic landscape by transcending geographic flows and driving global innovative activities. Based on the data of international student mobility, this paper draws on complex network theory to construct a multidimensional weighted directed network heterogeneity model. This model uses the GIS spatial analysis method to study spatiotemporal evolution of global talent mobility network complexity from 2001 to 2015. The results are as follows. First, the scale of the global talent mobility network is expanding rapidly, and the relationship is becoming closer and closer. In the network, both the number of talents and the choices of overseas routines are mounting. The network development has obvious small-world characteristics. However, the two levels of network differentiation are significant, and the difference is decreasing year by year. Second, the rank-size distributions of network nodes weighted degree of accession and weighted degree of output conform to the law of power distribution, showing a typical "pyramid structure" characteristics, reflecting that the global talent mobility network is controlled by a small number of pivotal node countries. The spatial patterns of the global talent mobility network are basically "from east to west, and from south to north", but the trend of mobile regionalization is gradually emerging, and the role of emerging countries attracting talents has gradually increased. Thirdly, the core-periphery structure of the global talent mobility network is remarkable. The countries in the core, strong semi-periphery and semi-periphery alternate with countries from other tiers. There is a strong mobility of relations between the core countries. The marginal countries are not connected with each other, or have weak links with each other. The talent of the marginal countries mainly flows to the core countries and semi-marginal countries. Finally, the global talent mobility network community has been significantly differentiated. The network has evolved into six associations, including American associations, EU associations, Chinese associations, South American and South African associations, Malaysian associations, and CIS associations. The scale of associations varies widely. Like the overall network, each community has a similar "pyramid structure" feature.
Measurement of a shift in the world's center of economic gravity
[J].
人流动向、规模与结构变迁能解释国内大循环吗?——基于网络搜索大数据的研究
[J].
Could changes in the direction, scale and structure of popular flow explain the domestic circulation?—Research based on online searching big data
[J].
基于企业间联系视角的长江经济带城市网络结构及其变化特征研究
[J].
Study on the urban network structure and its changing characteristics of the Yangtze River economic belt: Based on inter-firm linkages
[J].
