

1 引言
在甘蔗种植分布遥感提取方法方面,大体可以分为基于机器学习的甘蔗识别方法和基于遥感时序匹配的甘蔗识别方法。基于机器学习的甘蔗识别研究,通过多源遥感数据提取光谱、物候、空间等多维特征,利用支持向量机、随机森林等监督分类模型,进行甘蔗识别。Vieira等[18]和Zhou等[19]通过图像分割获取田块对象,并提取田块的光谱、纹理和空间特征,利用决策树分类方法实现对象级甘蔗识别。Wang等[20]基于Landsat7/8和Sentinel-2数据构建耕地NDVI时间序列曲线,提取开始生长时间、生长速率、生长季长度、生长季结束时间等关键物候特征,通过决策树分类算法实现广西甘蔗分布提取。杨颖频等[17]利用Landsat8和Sentinel-2数据构建作物NDVI时序曲线,提取物候特征和多时相多光谱特征,利用随机森林模型进行分类特征优选并实现甘蔗识别。Jiang等[21]利用Sentinel-1的VV、VH特征对广东湛江的甘蔗进行早期识别,并评估时序长度对早期识别精度的影响。谢鑫昌等[22]基于Landsat8近红外、短波红外、蓝波段反射率和NDVI指数,并将数字高程模型(DEM)数据作为辅助特征,通过随机森林分类方法,实现广西2014—2018年的甘蔗识别。基于机器学习的甘蔗识别方法,大多针对分类特征的提取、筛选和优化进行深入研究,该类方法属于统计学方法,分类模型的训练过度依赖样本和影像数据,训练的分类模型可迁移性较弱。基于遥感时序匹配的甘蔗识别方法,通过甘蔗样本数据构建甘蔗NDVI参考时序曲线,利用时间序列相似度计算模型,衡量未知地物NDVI时序与甘蔗NDVI时序的相似性。Zheng等[23]基于时间加权的动态时间规整(TWDTW)模型,逐像元计算NDVI时序与甘蔗参考NDVI时序的距离,协同遥感与统计数据提取了2016—2019年的巴西甘蔗分布。TWDTW模型是在动态时间规整(DTW)方法基础上发展起来的针对植被时序曲线匹配的模型,通过对2个长度不同的时间序列进行延伸和压缩,比较两条曲线波形的相似性,该方法具有抗物候差异、仅需少量样本的特点,在大范围作物识别中具有明显优势[24]。基于遥感时序匹配的甘蔗识别方法,充分利用了甘蔗的生长物候特征,具有较强的作物生理学含义。
2 研究区概况和数据源
2.1 研究区概况
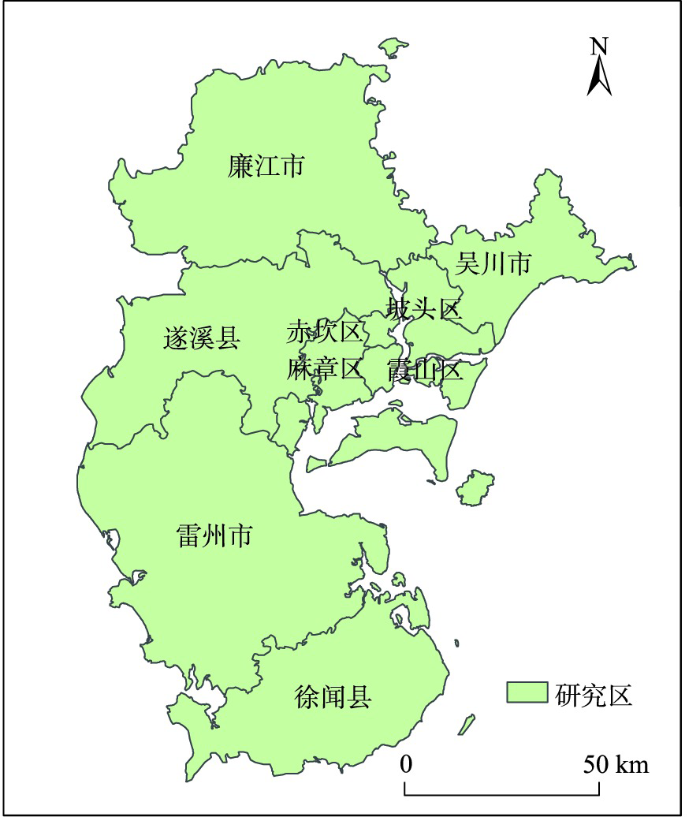
本研究选取粤西甘蔗主产区湛江市为研究区(图1)。湛江地处祖国大陆最南端、广东省西南部(109°40′E—110°58′E,20°13′N—21°57′N),包括整个雷州半岛及半岛北部的一部分,辖区总面积132 63 km2。湛江东濒南海,南隔琼州海峡与海南省相望,西临北部湾,西北与广西壮族自治区的合浦、博白等县毗邻。湛江的地势大致中轴高、东西侧低,南北高而中间低,起伏和缓,多为平原和台地。湛江地处北回归线以南的低纬地区,属于热带北缘季风气候,终年受海洋气候的调节,冬无严寒,夏无酷暑,年平均气温在22.7 ~23.5 ℃。湛江最主要的农作物为甘蔗和水稻,甘蔗通常3月开始萌芽生长,6—9月为伸长期,11月到达成熟期,砍收期从11月持续至次年2月。水稻可种植两季,3月底4月初播种早稻,7—8月早稻收割、晚稻播种,10月底晚稻收割。
图1
2.2 数据源
本研究采用的数据源包括Landsat系列遥感数据、作物类型样本数据、统计年鉴数据、DEM数据。
2.2.1 遥感时间序列数据
甘蔗种植分布提取使用的遥感数据源来自Landsat系列卫星,包括Landsat-5和Landsat-8。Landsat影像空间分辨率为30 m,时间分辨率为16 d。在Google Earth Engine云平台检索整体云量小于80%的Landsat地表反射率数据,计算NDVI特征,利用QA_Pixel质量控制波段筛选云污染像元,对NDVI数据进行掩膜处理,批量下载NDVI时间序列数据。本研究以10年为间隔,对2000—2020年的甘蔗分布进行提取并开展时空分析,由于2010年和2009年的时序影像数据质量较差,利用2008年替代2010年开展研究,最终选取2000、2008、2020年3个年的遥感影像进行甘蔗分布提取。考虑到甘蔗的生长季长度,监测时间窗口设定为当年1月至次年2月,影像列表如表1所示。
表1 Landsat影像数据
Tab. 1
| 序号 | 2000年Landsat5成像时间 | 2008年Landsat5成像时间 | 2020年Landsat8成像时间 |
|---|---|---|---|
| 1 | 2000-01-24 | 2008-02-15 | 2020-01-15 |
| 2 | 2000-03-28 | 2008-03-02 | 2020-01-31 |
| 3 | 2000-04-29 | 2008-04-19 | 2020-03-03 |
| 4 | 2000-05-15 | 2008-05-05 | 2020-04-20 |
| 5 | 2000-05-31 | 2008-06-22 | 2020-05-06 |
| 6 | 2000-07-02 | 2008-07-24 | 2020-06-07 |
| 7 | 2000-08-19 | 2008-08-25 | 2020-06-23 |
| 8 | 2000-09-04 | 2008-09-10 | 2020-07-09 |
| 9 | 2000-10-06 | 2008-09-26 | 2020-07-25 |
| 10 | 2000-11-07 | 2008-10-28 | 2020-08-10 |
| 11 | 2000-11-23 | 2008-11-13 | 2020-09-11 |
| 12 | 2000-12-09 | 2008-11-29 | 2020-09-27 |
| 13 | 2000-12-25 | 2008-12-15 | 2020-11-30 |
| 14 | 2001-02-11 | 2009-01-16 | 2021-01-01 |
| 15 | 2009-02-17 | 2021-01-17 | |
| 16 | 2021-02-02 | ||
| 17 | 2021-02-18 |
2.2.2 作物类型样本数据
作物类型样本数据来源于野外地面调查以及Google Earth高分辨率影像目视解译。2020年7月研究团队在湛江开展实地调查,获取了2008个作物类型采样数据,包括甘蔗样本860个,非甘蔗样本1148个,其中香蕉样本124个、水稻样本156个、火龙果样本20个、蔬菜样本36个、撂荒地样本64个。基于地面调查样本数据,观察Google Earth高分辨率影像上甘蔗的空间特征,通过目视解译并结合NDVI时间序列曲线形态特征,补充样本数量并构建作物类型样本数据集。如图2所示,生长旺盛期时的甘蔗由于叶片高度覆盖和叶片间的细微孔隙,影像上呈现出较饱和的绿色调和粗颗粒状纹理。构建的样本集中共包含2020年1039个甘蔗样本、1553个非甘蔗样本,2008年1059个甘蔗样本、1490个非甘蔗样本; 2000年1008个甘蔗样本、1522个非甘蔗样本。
图2
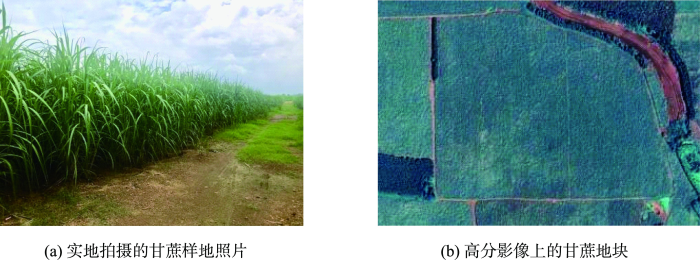
图2
甘蔗样地照片及Google Earth高分辨率影像
Fig. 2
Photo of sugarcane field and the high-spatial-resolution Google Earth image
2.2.3 统计年鉴数据
图3
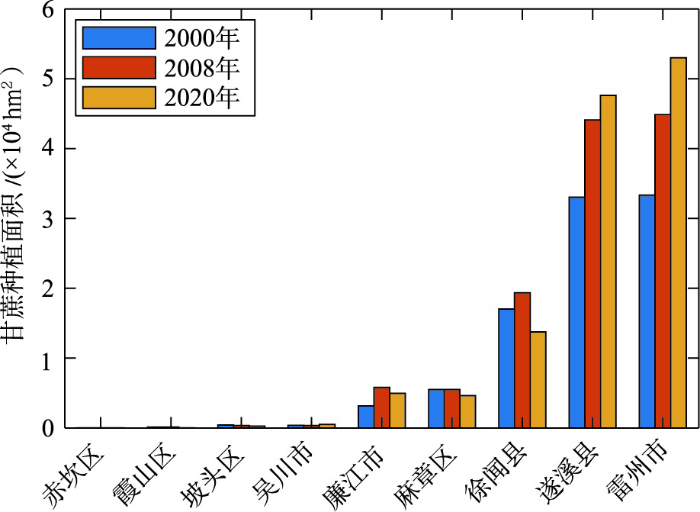
图3
湛江各区县甘蔗种植面积统计数据
Fig. 3
Statistics of the sugarcane planting areas in counties of Zhanjiang
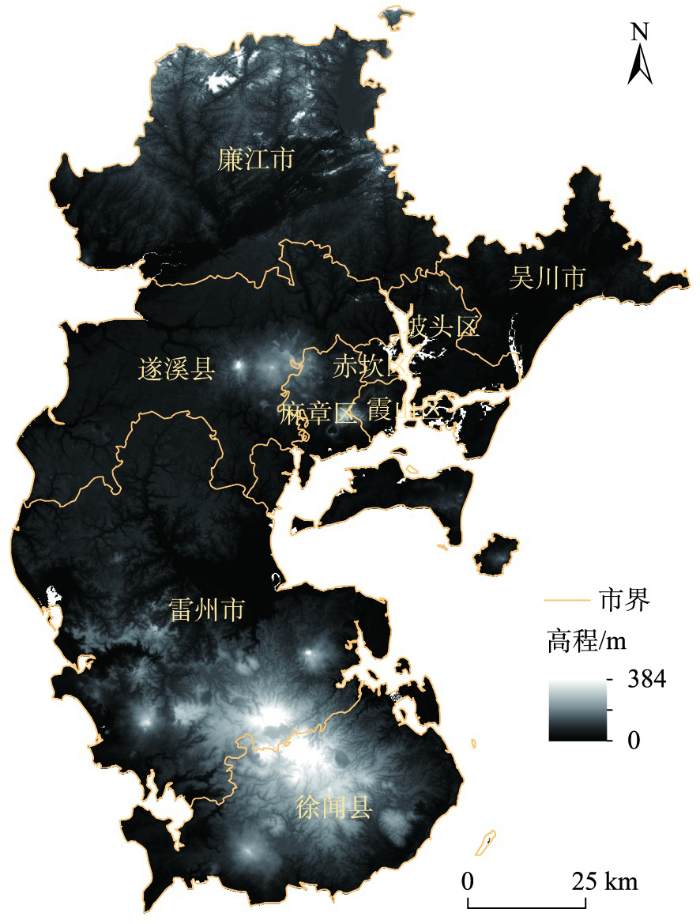
2.2.4 DEM数据
图4
3 研究方法
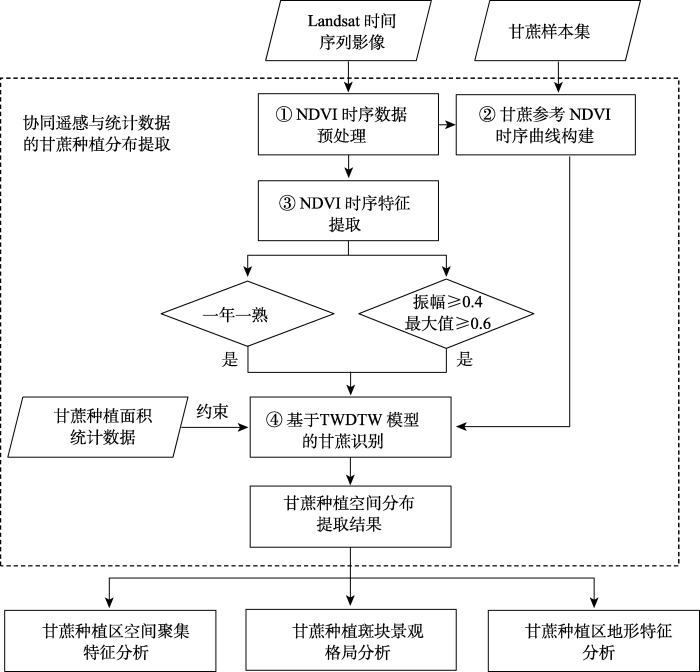
本研究的基本框架如图5,甘蔗种植分布信息的提取流程包括NDVI时序数据预处理、甘蔗参考NDVI时序曲线构建、NDVI时序特征提取、基于TWDTW模型的甘蔗识别。在甘蔗种植分布提取结果的基础上,进一步分析甘蔗种植区空间聚集特征、甘蔗种植斑块景观格局特征和甘蔗种植区地形特征。
图5
3.1 协同遥感与统计数据的甘蔗种植分布提取
3.1.1 NDVI时序数据预处理
利用多时相NDVI构建NDVI时序曲线,为了进一步消除异常观测值的影响,对NDVI时序曲线中的异常值进行剔除。异常值剔除方案如下:对每个NDVI观测点(Pi)建立大小为3的滑动窗口,窗口内包含Pi的前(Pi-1)、后(Pi+1)观测点。对Pi-1和Pi+1观测点进行线性内插,记作Pi',比较观测点Pi和插值点Pi'的NDVI取值大小,当Pi和Pi'的NDVI之差超过0.2并且Pi距离上一次观测的天数超过14天,或者Pi和Pi'的NDVI之差超过0.5并且Pi距离上一次观测的天数超过21天时,将Pi判定为异常观测(图6)。以表1中Landsat数据的观测时相为采样间隔,对NDVI时序曲线进行线性内插,填补缺失值。
图6
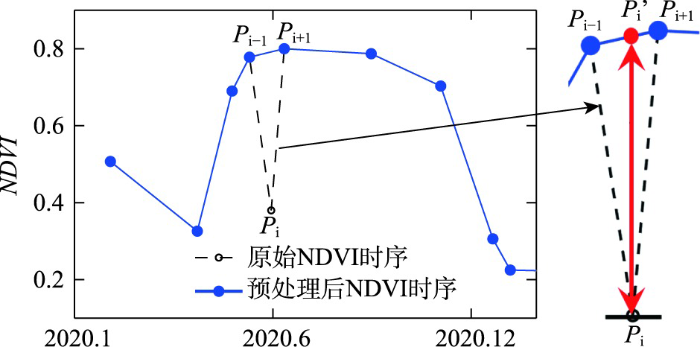
图6
NDVI时序曲线异常值剔除示意
Fig. 6
Schematic diagram of eliminating outlier of NDVI temporal curve
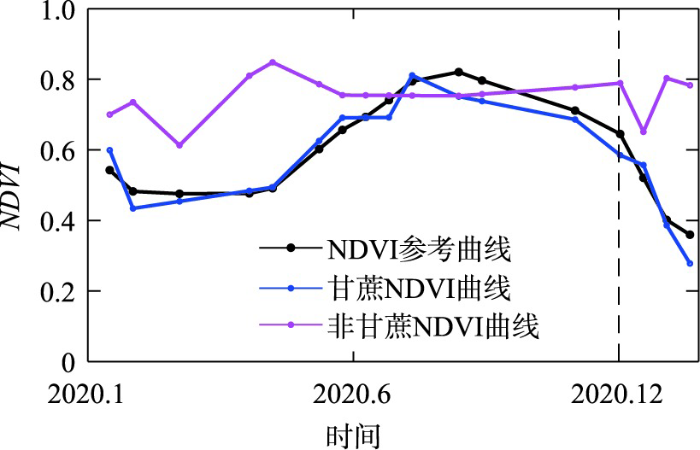
3.1.2 甘蔗参考NDVI时序曲线构建
图7
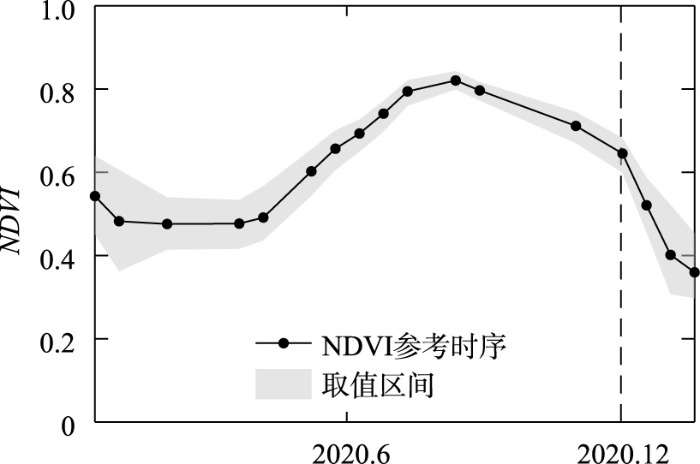
图8
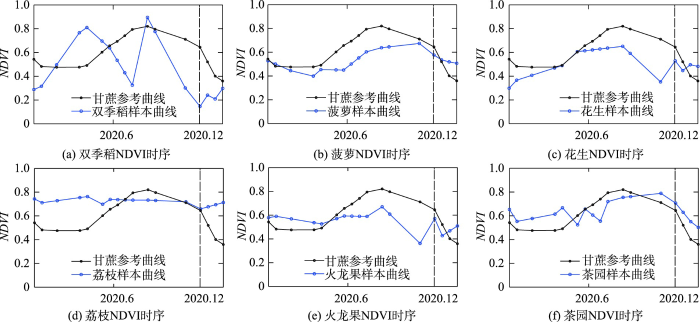
图8
研究区除甘蔗外其他典型作物类型的NDVI时序曲线
Fig. 8
NDVI time series of typical crop types other than sugarcane in the study area
3.1.3 NDVI时序特征提取
基于NDVI时序曲线提取耕地复种指数、NDVI振幅和NDVI全年最大值。复种指数的提取方式如下,识别NDVI时序曲线极值点,当极值点NDVI小于0.4、2个相邻极值点之间的时间间隔大于60 d、振幅大于0.35时,认为这2个极值点之间存在一次完整的作物生长过程,通过以上方法获取2000年、2008年、2020年的耕地复种指数空间分布。
NDVI时序曲线的振幅反映了作物在生长过程中绿叶覆盖的变化情况,NDVI最大值则体现了作物旺盛期生长态势。基于上述预处理后的NDVI时序曲线,提取时序曲线的振幅和NDVI最大值。利用上述样本统计甘蔗NDVI时序振幅和NDVI最大值,绘制直方图。如图9所示,甘蔗NDVI时序曲线的振幅大于0.4,NDVI最大值大于0.6。
图9
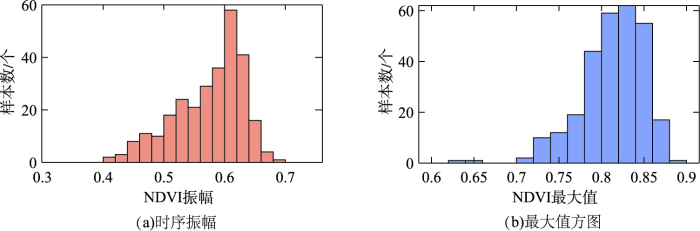
图9
甘蔗NDVI时序曲线振幅和最大值直方图
Fig. 9
Histogram of the amplitude and maximum of sugarcane NDVI time series
3.1.4 基于TWDTW模型的甘蔗识别
将研究区甘蔗总体种植面积统计数据除以900(Landsat像元大小为30 m×30 m),获取研究区应有的甘蔗像元总体个数N。筛选出复种指数等于1、NDVI时序振幅大于等于0.4、NDVI时序最大值大于等于0.6的像元,作为可能为甘蔗的备选像元,排除其他不符合该特征的点,例如桉树等常绿林振幅不超过0.4,被预先排除掉。以1月至次年2月为监测时间窗口,利用TWDTW模型逐像元计算NDVI时序曲线与甘蔗NDVI参考时序曲线的“距离”,记作Dist(图10),对所有像元的Dist进行排序,按照Dist从小到大的顺序,动态设定Dist阈值,统计Dist取值小于等于该阈值的像元个数N’,当N’恰好等于或刚刚大于总体个数N时,将该阈值设定为甘蔗的Dist阈值。将Dist小于等于该阈值的像元判定为甘蔗类型。
图10
3.2 甘蔗种植区空间聚集特征分析
本研究利用核密度分析方法分析甘蔗种植区的空间聚集程度。核密度分析方法借助一个移动窗口,对点格局的密度进行估计,其原理[31]如下:以每个栅格样点xi为中心,搜索半径范围h内符合特定属性的点;通过核函数计算出每个点对该栅格的密度贡献值,距离越近,密度值越大;对该半径范围内所有点的密度贡献值累加;输出每个栅格的密度值(式(1))。
式中:f(x)为空间位置x处的核密度计算函数;h为搜索半径范围;n为分析范围内的点数;K为默认的权重核函数;x-xi为x到点xi之间的距离。
3.3 甘蔗种植斑块景观格局分析
本研究将景观生态学中的景观格局分析方法用于分析甘蔗的空间格局特征,研究2000—2020年甘蔗种植斑块的景观格局变化情况。本研究选取的景观格局指数包括景观比例、平均斑块面积、斑块密度、聚集度指数,景观格局指数通过Fragstat软件计算,各指数含义如下:
(1)景观比例(Percentage of Landscape,PLAND):甘蔗景观占整个景观的面积相对比例;
(2)平均斑块面积(Average Patch area, AP):甘蔗景观面积与甘蔗斑块数量的比值;
(3)斑块密度(Patch Density, PD):单位面积上的甘蔗斑块数,反映斑块破碎化程度和景观空间异质性程度;
(4)聚集度指数(Aggregation Index,AI):基于同类型斑块像元间公共边的长度来计算,数值越大,表示斑块之间距离越近,反映不同斑块个体空间分布的聚集程度。
3.4 甘蔗种植区地形特征分析
地形是区域土壤、气候、水文等自然因素的主导因素,可通过高程、坡度、坡向来表达地形的分异规律。本研究在甘蔗种植分布提取结果的基础上,统计分析甘蔗种植区的地形特征,为甘蔗的耕种管理、甘蔗种植区的选择规划提供科学指导。按照中国农业区划委员会发布的《土地利用现状调查技术规程》[32],将甘蔗种植区的坡度划分为0°~2°平坡区、2°~6°缓坡区和大于6°斜坡区这3个等级,分析甘蔗种植区的坡度等级。
4 结果及分析
4.1 甘蔗种植区空间分布提取及精度验证结果
基于上述研究方法提取粤西地区甘蔗种植空间分布结果如图11所示。
图11
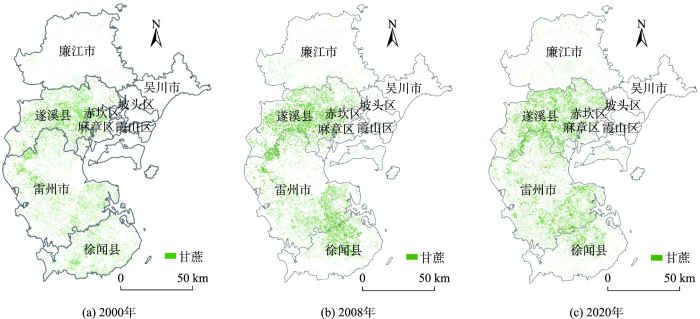
图11
2000—2020年粤西甘蔗种植区空间分布提取结果
Fig. 11
Extracted sugarcane plantation distribution of western Guangdong in 2000-2020
利用样本数据验证2000、2008、2020年的甘蔗提取精度,选取甘蔗种植面积排名前三的雷州市、徐闻县、遂溪县进行精度验证。精度验证结果如表2所示,3年平均甘蔗制图精度为87.62%,总体精度为90.90%。
表2 甘蔗识别精度混淆矩阵
Tab. 2
| 年份 | 区县 | 真实类型 | 识别类型 | 合计 | 制图精度/% | 用户精度/% | 总体精度/% | |
|---|---|---|---|---|---|---|---|---|
| 甘蔗 | 非甘蔗 | |||||||
| 2000年 | 遂溪县 | 甘蔗 | 190 | 29 | 219 | 86.75 | 90.48 | 92.41 |
| 非甘蔗 | 20 | 432 | 454 | 95.15 | 93.71 | |||
| 雷州市 | 甘蔗 | 254 | 36 | 290 | 87.59 | 83.28 | 91.08 | |
| 非甘蔗 | 51 | 634 | 685 | 92.55 | 94.63 | |||
| 徐闻县 | 甘蔗 | 140 | 22 | 162 | 86.42 | 83.83 | 91.01 | |
| 非甘蔗 | 27 | 356 | 383 | 92.95 | 94.18 | |||
| 2008年 | 遂溪县 | 甘蔗 | 191 | 29 | 220 | 86.82 | 83.77 | 90.69 |
| 非甘蔗 | 37 | 452 | 489 | 92.43 | 93.97 | |||
| 雷州市 | 甘蔗 | 287 | 38 | 325 | 88.31 | 84.16 | 90.85 | |
| 非甘蔗 | 54 | 626 | 680 | 92.06 | 94.28 | |||
| 徐闻县 | 甘蔗 | 140 | 23 | 163 | 85.89 | 85.37 | 90.29 | |
| 非甘蔗 | 24 | 297 | 321 | 92.52 | 92.81 | |||
| 2020年 | 遂溪县 | 甘蔗 | 202 | 29 | 231 | 87.45 | 83.13 | 90.50 |
| 非甘蔗 | 41 | 465 | 506 | 91.90 | 94.13 | |||
| 雷州市 | 甘蔗 | 303 | 31 | 334 | 90.72 | 82.34 | 91.04 | |
| 非甘蔗 | 65 | 673 | 738 | 91.19 | 95.60 | |||
| 徐闻县 | 甘蔗 | 117 | 15 | 132 | 88.64 | 81.25 | 90.25 | |
| 非甘蔗 | 27 | 281 | 309 | 90.94 | 94.93 | |||
利用区县尺度的统计年鉴数据对甘蔗种植面积遥感估算结果进行精度验证,验证结果如图12所示。总体精度RMSE为4.8×10³ hm2,甘蔗面积统计数据与遥感估算结果的相关系数为0.93。
图12
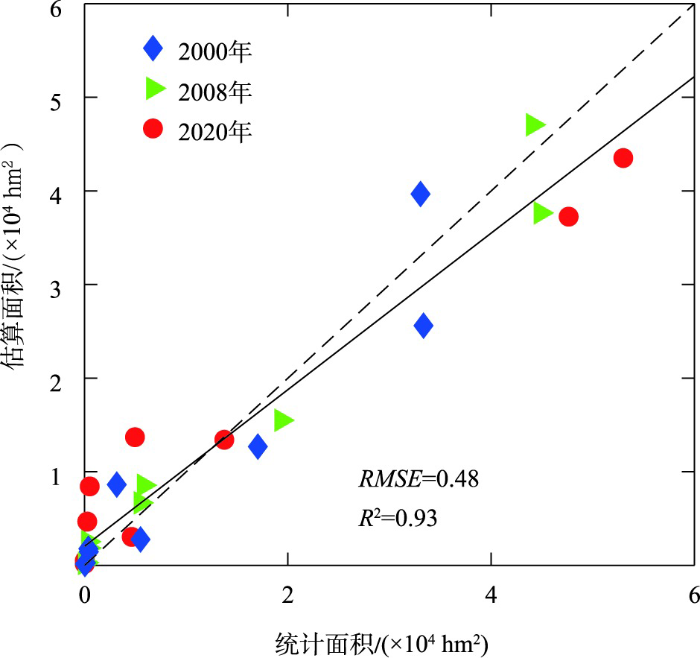
图12
甘蔗遥感估算面积与统计数据对比
Fig. 12
Comparison between the extracted sugarcane area by remote sensing and statistics data
甘蔗识别的误差来源主要包含以下方面:部分园地、荒地等其他地类与甘蔗NDVI时序曲线形态存在相似性,导致基于TWDTW模型计算的曲线距离较小,从而被误判为甘蔗;此外,云雨天气使得光学时间序列数据稀疏或关键时相点数据缺失,导致观测的作物NDVI时序曲线异常,例如双季稻7—8月处于早稻收割、晚稻播种的关键期,理论上,在该时段内NDVI时序曲线呈现一个低谷特征,但云雨天气导致未观测到该低谷特征,部分水稻被误判为甘蔗。
4.2 甘蔗种植区空间聚集特征分析结果
基于核密度计算的甘蔗种植区空间聚集分布如图13所示。2000—2020年遂溪县甘蔗种植区呈现多中心扩散的趋势,并且逐渐形成了多个高密度种植区。2000年甘蔗种植区主要分布在乌塘镇和岭北镇,2008年甘蔗种植区扩散至城月镇、洋青镇、岭北镇、港门镇,2020年甘蔗种植区进一步扩散至杨柑镇、沙古镇、界炮镇,多个乡镇呈现高密度的甘蔗种植区分布格局。2000—2020年雷州市甘蔗种植区在空间分布上呈现出扩散趋势,甘蔗种植高密度区的空间范围呈现出先扩张后收缩的趋势,在位置上也表现出一定变化。2000年甘蔗种植区主要分布在纪家镇、唐家镇和客路镇,2008年调风镇、雷高镇也出现了甘蔗种植高密度区,2020年甘蔗种植高密度区迁移至英利镇、龙门镇、北和镇。2000—2020年徐闻县的高密度甘蔗种植区从徐闻县西部迁移至北部,甘蔗种植区的空间范围呈现出先扩张后收缩的趋势。2000年甘蔗种植区主要集中在南山镇和城北乡,2008年甘蔗高密度种植区迁移至徐闻县北部的下桥镇和曲界镇,随后2020年甘蔗种植面积下降,以下桥镇局部区域为主,曲界镇零星分布。2000—2020年麻章区的甘蔗种植区均聚集在麻章镇,空间分布上变化较小。廉江市的甘蔗在空间上分布零散,未呈现高密度聚集的甘蔗种植区。
图13
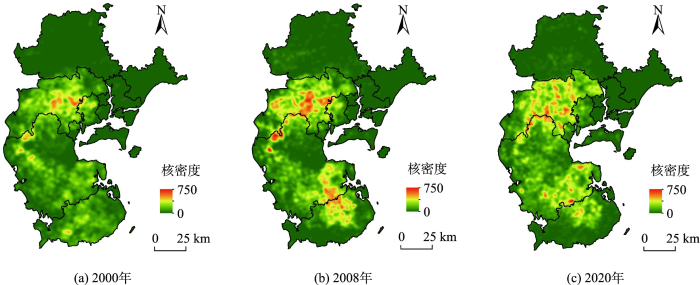
图13
2000—2020年粤西甘蔗种植区核密度空间分布
Fig. 13
Spatial distribution of the kernel density of sugarcane plantation area of western Guangdong from 2000 to 2020
以上甘蔗种植区空间聚集分布变化表明,遂溪县甘蔗产业的发展力度最大,呈现多中心发展和高密度聚集的空间格局。雷州市出现了较明显的种植空间分布调整,甘蔗种植区从北部聚集发展至南部、北部2个聚集中心。徐闻县也发生了显著的甘蔗种植布局调整,种植区从西部迁移至北部,种植面积也有所下降。该甘蔗种植区分布密度的分析结果对于糖厂规划选址具有重要的参考价值。
4.3 甘蔗种植斑块景观格局分析结果
湛江各区县2000、2008、2020年甘蔗景观格局变化情况如表3所示。横向比较各个区县的景观格局特征,遂溪县的甘蔗景观比例最大、平均斑块面积最大、聚集度指数最高,说明甘蔗为当地优势作物类型,呈现聚集化、规模化的种植格局,有利于发展机械化、集约化生产。
表3 湛江2000、2008、2020年甘蔗景观格局指数计算结果
Tab. 3
| 区县 | 年份 | 景观格局指数 | |||
|---|---|---|---|---|---|
| 景观比例/% | 平均斑块面积/hm2 | 斑块密度/(个/km2) | 聚集度指数 | ||
| 遂溪县 | 2000 | 16.33 | 1.14 | 13.36 | 61.45 |
| 2008 | 21.78 | 1.69 | 12.03 | 67.13 | |
| 2020 | 23.53 | 2.31 | 9.51 | 70.99 | |
| 雷州市 | 2000 | 9.47 | 0.56 | 15.79 | 48.85 |
| 2008 | 12.74 | 0.82 | 14.60 | 62.15 | |
| 2020 | 15.05 | 1.08 | 13.04 | 64.98 | |
| 徐闻县 | 2000 | 9.44 | 0.51 | 17.47 | 47.19 |
| 2008 | 10.71 | 1.00 | 10.09 | 64.09 | |
| 2020 | 7.61 | 0.67 | 10.68 | 59.35 | |
| 麻章区 | 2000 | 7.49 | 0.78 | 9.00 | 57.31 |
| 2008 | 7.50 | 0.77 | 9.11 | 58.17 | |
| 2020 | 6.31 | 0.47 | 12.65 | 47.49 | |
| 廉江市 | 2000 | 1.13 | 0.20 | 5.23 | 26.76 |
| 2008 | 2.07 | 0.35 | 5.47 | 42.15 | |
| 2020 | 1.77 | 0.24 | 6.90 | 31.26 | |
| 吴川市 | 2000 | 0.43 | 0.17 | 2.36 | 21.64 |
| 2008 | 0.39 | 0.18 | 2.09 | 23.00 | |
| 2020 | 0.58 | 0.15 | 3.64 | 17.06 | |
| 霞山区 | 2000 | 1.32 | 0.27 | 4.54 | 33.18 |
| 2008 | 1.14 | 0.30 | 3.61 | 35.50 | |
| 2020 | 0.22 | 0.13 | 1.60 | 12.93 | |
| 坡头区 | 2000 | 0.82 | 0.21 | 3.67 | 27.83 |
| 2008 | 0.71 | 0.20 | 3.36 | 25.23 | |
| 2020 | 0.52 | 0.17 | 2.86 | 22.14 | |
| 赤坎区 | 2000 | 0.42 | 0.16 | 2.37 | 21.07 |
| 2008 | 0.35 | 0.18 | 1.84 | 22.49 | |
| 2020 | 0.22 | 0.14 | 1.57 | 15.16 | |
虽然雷州和徐闻也为甘蔗生产大县,但甘蔗景观平均斑块面积相较遂溪县偏小,斑块密度较高、聚集度指数较小,说明甘蔗景观斑块破碎程度相对较高,蔗田分布相对零散,有待进一步调整甘蔗种植布局,以便于规模化种植。麻章区、廉江区、吴川市、霞山区、赤坎区、坡头区,甘蔗种植面积较小,平均斑块面积、斑块密度和聚集度指数均处于较低水平,蔗田分布十分零散,不利于发展机械化生产。
从时间维度纵向比较,2000—2020年,遂溪县和雷州市的甘蔗景观平均斑块面积增长、斑块密度降低、聚集指数增长,2020年遂溪县的甘蔗平均斑块面积达2.31 hm2,雷州市的甘蔗平均斑块面积达1.08 hm2,均较2000年增长约1倍,表明遂溪县和雷州市发生了较显著的甘蔗种植布局调整和优化,甘蔗种植向空间分布聚集化的方向发展。在这期间,徐闻县经历了甘蔗种植面积先增长后减少的过程,平均斑块面积先增长后下降、斑块密度先减小后增长、聚集程度先升高后降低。2000—2020年麻章区、廉江市、吴川市、霞山区、坡头区、赤坎区的甘蔗景观格局变化相对较小。
4.4 甘蔗种植区地形特征分析结果
图14
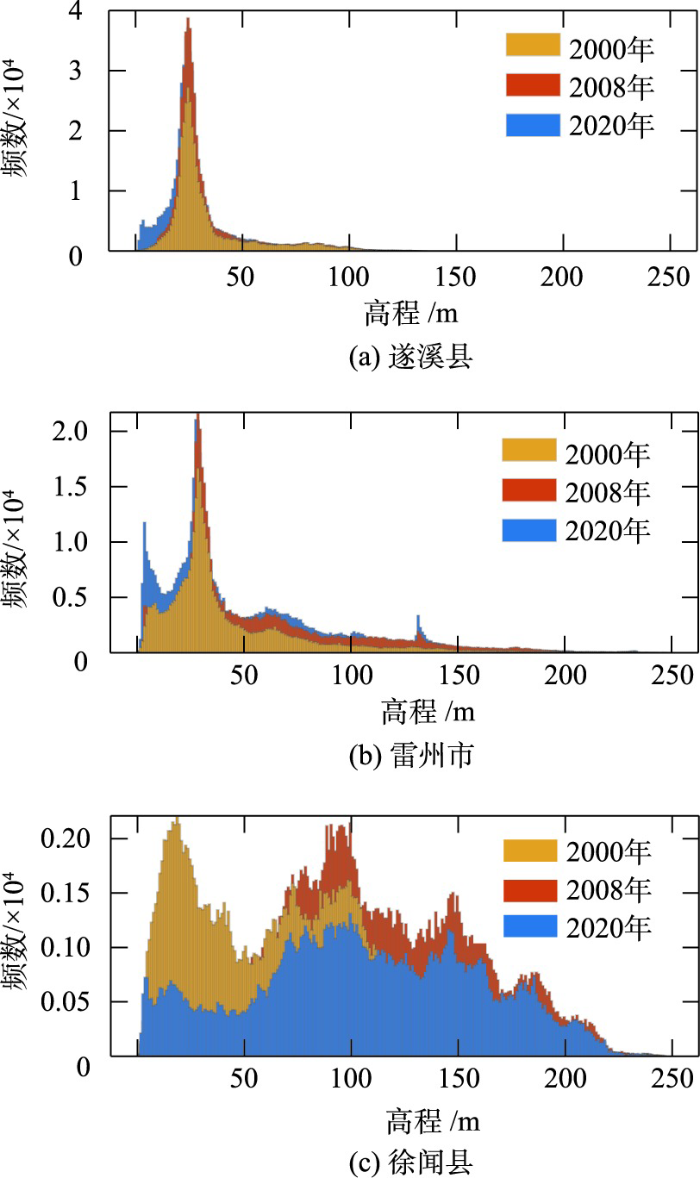
图14
遂溪县、雷州市、徐闻县甘蔗种植区高程统计分布
Fig. 14
Histogram of the elevation of sugarcane planting areas in Suixi, Leizhou and Xuwen
图15
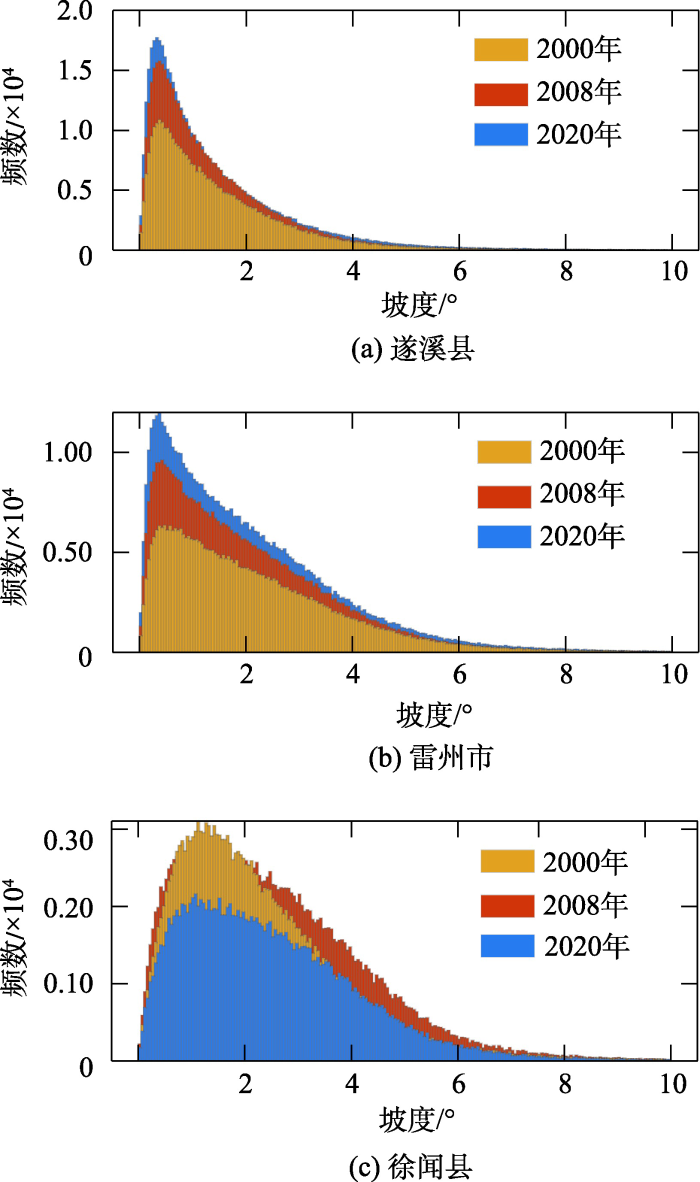
图15
遂溪县、雷州市、徐闻县甘蔗种植区坡度统计分布
Fig. 15
Histogram of the slope of sugarcane planting areas in Suixi, Leizhou and Xuwen
经统计,各区县甘蔗在东、西、南、北各个坡向的种植分布比例相差不大。由于南坡太阳辐射强度高于北坡,更加有利于甘蔗生长,建议各区县的甘蔗种植可以适当地向南坡调整,对提高甘蔗生产力具有积极作用。
5 讨论
本文协同遥感与统计数据开展粤西地区甘蔗种植分布提取及时空分析研究。通过构建甘蔗参考NDVI时序曲线并计算遥感时序相似性距离,开展统计数据的空间化,与当前大多数甘蔗种植分布提取的方法不同,该方法协同了遥感与统计数据两类数据。下面对本文研究方法的不确定性和未来的研究方向讨论如下:
(1)基于物候特征的作物识别方法是当前研究热点,构建作物NDVI时序曲线是其中的关键环节,然而云雨天气容易导致观测数据缺失,给甘蔗种植分布提取带来不确定性,如何结合多源光学遥感数据,以及结合光学和SAR遥感数据重建NDVI时序数据,是日后需要解决的关键技术问题。
(2)本研究以NDVI时序曲线作为判别甘蔗的特征,但是部分园地、荒地等其他地类与甘蔗NDVI时序曲线形态存在相似性,导致误判为甘蔗类型,后续研究将开展植被指数的筛选和构建,选择敏感特征,丰富特征维度,有助于提高识别精度。
(3)考虑到数据的可获得性,本研究采用了 30 m分辨率的Landsat数据开展甘蔗历史分布信息的提取,然而30 m的空间尺度对于细小、破碎的地块,不可避免地存在混合像元问题,如何对混合像元进行解混从而减小甘蔗识别的不确定性,有待进一步探究。
(4)本研究以统计数据为约束开展甘蔗种植分布提取,该方法对统计数据具有依赖性。在最新统计数据公布之前,及时提取甘蔗种植分布,对于提高信息时效性具有重要价值。后续可以探究的研究思路如下:先基于本文方法提取上一年的甘蔗种植分布,以甘蔗轮作规律(甘蔗为多年生作物,种植后可连续收获2—3年)为先验知识,结合当前最新年份的少量样本开展变化检测,对甘蔗种植分布数据进行更新。
(5)在甘蔗种植分布时空分析方面,本文采用2000、2008、2020年3个年的甘蔗种植分布提取结果来表征2000—2020年的甘蔗种植时空分布情况,时间间隔相对较长,后续研究将提高信息提取的频次,以年为单位,开展连续年份的甘蔗种植分布变化提取。
(6)本文从空间聚集程度、景观格局特征、地形特征3个方面对甘蔗种植区分布开展时空分析,后续研究将进一步从自然因素、人文因素两个方面,分析影响甘蔗种植空间分布的驱动力,自然因素包括气候变化、土壤条件、水热条件等,人文因素包括人口、经济政策、市场需求等。
6 结论
粤西是我国甘蔗三大优势产区之一,甘蔗种植空间分布及其变化信息可以为生产资源调度、甘蔗种植布局优化、甘蔗产业政策制定等提供数据支撑,对促进我国甘蔗产业可持续发展具有重要价值。遥感为获取大范围、长时序的甘蔗种植分布信息提供了有效手段。本研究基于Landsat NDVI时间序列数据,利用甘蔗生长物候特征,通过TWDTW模型匹配NDVI时序曲线的相似性,结合甘蔗种植面积统计年鉴数据,提取2000、2008、2020年的甘蔗种植空间分布信息。分析甘蔗种植区空间聚集特征,分析2000—2020年甘蔗种植斑块景观格局特征,基于DEM数据进一步分析蔗区地形特征。主要结论如下:
(1)基于Landsat NDVI时序数据,利用TWDTW模型匹配NDVI时序相似性,可以实现较高精度的甘蔗空间分布信息提取,2000、2008、2020年3年平均甘蔗制图精度达87.62%。
(2)粤西甘蔗主要分布在遂溪县、雷州市和徐闻县,2000—2020年遂溪县、雷州市的甘蔗种植分布呈现扩散趋势,徐闻县甘蔗种植分布呈现收缩趋势。2020年粤西甘蔗种植主要聚集在遂溪县、雷州市北部、雷州市南部、徐闻县北部。
(3)甘蔗种植区的空间聚集特征分析结果表明,2000—2020年遂溪县甘蔗种植区呈现多中心发展和高密度聚集的空间格局,雷州市甘蔗种植区从北部聚集发展至南部、北部2个聚集中心,徐闻县高密度甘蔗种植区从西部迁移至北部。
(4) 2000—2020年粤西甘蔗种植面积最大的 2个区县(遂溪县和雷州市)甘蔗景观平均斑块面积增长、斑块密度降低、聚集指数增长,说明这些地区发生了较显著的甘蔗种植布局调整和优化,甘蔗种植正在向空间分布聚集化的方向发展。
(5)比较各个区县的甘蔗种植区地形特征,遂溪县和雷州市大部分甘蔗种植区地势平坦,2000—2020年新增的甘蔗种植区大多分布于低高程、小坡度的地带,有利于发展机械化作业的潜力,徐闻县大部分甘蔗种植在缓坡区,机械化作业条件较差。
参考文献
全球蔗糖主产国甘蔗产量与气象条件关系的初步研究
[J].
A preliminary study on relationship between sugarcane yields and meteorological conditions in main sucrose production countries worldwide
[J].
对当前我国甘蔗产业发展形势的分析与思考
[J].
Analysis and deliberation on the current development situation of China's sugar industry
[J].
粤西地区甘蔗产业对外贸易的发展现状及对策
[J].
Development status and countermeasures of foreign trade of sugarcane industry in western Guangdong
[J].
Analysis of time-series MODIS 250 m vegetation index data for crop classification in the US Central Great Plains
[J].
Impact of feature selection on the accuracy and spatial uncertainty of per-field crop classification using Support Vector Machines
[J].
Deep learning based multi-temporal crop classification
[J].This study aims to develop a deep learning based classification framework for remotely sensed time series. The experiment was carried out in Yolo County, California, which has a very diverse irrigated agricultural system dominated by economic crops. For the challenging task of classifying summer crops using Landsat Enhanced Vegetation Index (EVI) time series, two types of deep learning models were designed: one is based on Long Short-Term Memory (LSTM), and the other is based on one-dimensional convolutional (Conv1D) layers. Three widely-used classifiers were also tested for comparison, including a gradient boosting machine called XGBoost, Random Forest, and Support Vector Machine. Although LSTM is widely used for sequential data representation, in this study its accuracy (82.41%) and F1 score (0.67) were the lowest among all the classifiers. Among non-deep-learning classifiers, XGBoost achieved the best result with 84.17% accuracy and an F1 score of 0.69. The highest accuracy (85.54%) and F1 score (0.73) were achieved by the Conv1D-based model, which mainly consists of a stack of Conv1D layers and an inception module. The behavior of the Conv1D-based model was inspected by visualizing the activation on different layers. The model employs EVI time series by examining shapes at various scales in a hierarchical manner. Lower Conv1D layers of the optimized model capture small scale temporal variations, while upper layers focus on overall seasonal patterns. Conv1D layers were used as an embedded multi-level feature extractor in the classification model which automatically extracts features from input time series during training. The automated feature extraction reduces the dependency on manual feature engineering and pre-defined equations of crop growing cycles. This study shows that the Conv1D-based deep learning framework provides an effective and efficient method of time series representation in multi-temporal classification tasks.
农作物遥感识别中的多源数据融合研究进展
[J].
DOI:10.3864/j.issn.0578-1752.2015.06.09
[本文引用: 1]

农作物遥感识别是地理学和生态学研究的前沿和热点,多源数据在农作遥感识别中日益发挥重要作用。笔者从多源数据融合的角度,归纳了2000年后多源数据在农作物遥感识别中应用的总体概况,系统梳理并提炼了当前多源数据融合的主要融合技术和融合模式。围绕与多源数据融合和农作物遥感识别相关的关键词,在Google学术、ISI Web of Knowledge和中国知网中对2000—2014年间国内外发表的论文进行检索,并统计不同传感器的使用频率及结合方式。研究表明,以提高空间分辨率为目标的多源数据融合和以提高时间分辨率为目标的多源数据融合技术是当前的两种主要方式,可以在一定程度上实现时空尺度的扩展。前者的融合技术包括图像融合、正态模糊分布神经网络模型、成分替换、半经验数据模型融合及多分辨率小波分解等,可以提升遥感数据的空间分解力和清晰度,较好弱化混合像元产生的影响,但农作物光谱信息有一定程度的丢失或扭曲,农作物空间分布局部细节信息与纹理特征依然会缺失;后者的融合技术形式灵活多样,可分为同源数据联合扩展时序的时空优化技术和异源数据联合扩展时序的时空优化技术,其可以有效排除短时间段内农作物生育期交叉,但易受不同遥感数据源间光谱反射率或植被指数转换模型及光谱波段设置差异的影响。在融合模式方面,根据数据类型分为光学数据的融合、光学数据与微波数据的融合以及遥感与非遥感数据的融合,以实现卫星资源优势互补为宗旨,充分挖掘不同类型农作物在遥感数据上呈现的光谱、时间和空间特征差异信息。同样,农作物遥感识别研究中的多源遥感数据融合也存在诸多挑战,在未来一段时间内,完善不同传感器之间的合作、更深层次挖掘融合信息以及多尺度长时间序列的中高分辨率农作物空间分布数据集的需求是多源数据融合的农作物遥感识别研究的重点发展方向和亟待解决的问题。研究结果有助于更好地理解多源遥感数据融合的技术和模式,为摸清多源数据融合在农作物识别中总体进展提供支撑,同时也为其他多源数据融合研究提供借鉴。
Recent progresses in research of integrating multi-source remote sensing data for crop mapping
[J].
DOI:10.3864/j.issn.0578-1752.2015.06.09
[本文引用: 1]
Crop mapping by using the remotely-sensed images provide basic information for further geographical and ecological researches. A systematic review on the recent literature regarding crop mapping was carried out in order to improve our understanding on the integration and application of multi-source remote sensing data. The literature search was performed in Google Scholar, the ISI Web of Knowledge and CNKI (e.g. Topic =”crop + mapping”; Topic =”classification + multi-source”; timespan = 2000-2014). According to the thorough analysis on the existing publications, it is suggested that (1) there are two main ways to identify crop types based on the integration of multi-source data in order to expand the spatial and temporal scales. The techniques of multi-source data fusion, which are aimed at improving the spatial resolution, include image fusion, normal fuzzy distributed neural networks, component substitution, semi-physical fusion approach, and multiresolution wavelet decomposition. With the integrated application of such approaches, the spatial resolution and clarity of remote sensing images are raised; the effect of mixed pixels is weaken to some extent. Nevertheless, crop spectral information is partly lost or distorted. The techniques of multi-source data fusion, which are aimed at improving the temporal resolution, can be categorized into two types: the integration of the same data source, and the integration of different data sources. By using such approaches, the crossover of growth period among different crops can be effectively eliminated. But such approaches are susceptible to transformation models of spectral reflectance or vegetation indices, and the differences in band coverage among different remote sensing data. (2) The modes of multi-source data fusion can be categorized into three types according to the data types applied: integration of optical data, integration of optical and microwave data, and integration of remote sensing and ancillary data sources. Taking complementary advantages of various satellite data resources, these techniques of data fusion fully mine the differences of spectral, temporal and spatial characteristics, among various crop species. However, there still remain challenges in previous researches about the crop identification based on the fusion of multi-source remotely sensed data.
农作物种植结构遥感提取研究进展
[J].
DOI:10.3864/j.issn.0578-1752.2015.10.004
[本文引用: 1]
农作物种植结构信息对农业生产管理、农业可持续发展及国家粮食安全等具有重要意义。本文中概括了农作物种植结构遥感提取的理论基础,归类了近10年间不同农作物种植结构遥感提取技术方法,重点评述了不同技术方法的特点及应用情况,讨论和展望了未来农作物种植结构遥感提取研究的发展方向。当前,光谱特征、时相特征和空间特征是农作物种植结构遥感提取的三大理论基础。基于单一影像源的种植结构提取方法操作简单,但往往难以获取种植结构“最佳识别期”的遥感影像;基于多时序影像源的种植结构提取方法可以充分利用农作物季相节律特征,成为当前农作物种植结构遥感提取的主流方法。在基于多时序影像源的种植结构提取方法中,多特征参量法较单一特征参量法更适用于农作物种植结构复杂区域,基于多特征参量的统计模型法一定程度上解决了混合像元问题,但模型的鲁棒性有待提高。此外,遥感与统计数据融合的农作物种植结构提取法在国家及全球大尺度的农作物种植结构提取中具有优势,但较低的制图分辨率使得数据产品的区域适宜性较差。未来农作物种植结构遥感提取将以区域“作物一张图”为目标,充分发挥多源数据组合利用的优势,围绕多类型作物同步提取和大范围作物种植结构提取开展深入研究,重点加强遥感数据预处理、特征参量提取和分类器高效选择等关键技术研究,从而提升农作物种植结构遥感提取的时空尺度,满足多方位的农业应用需求。
Recent progresses in research of crop patterns mapping by using remote sensing
[J].
DOI:10.3864/j.issn.0578-1752.2015.10.004
[本文引用: 1]
Mapping crop patterns with remote sensing is of great implications for agricultural production, food security and agricultural sustainability. In this paper, the theoretical basis behind the mapping was summarized, mapping methods were classified into several categories, characteristics and applicabilities of different mapping methods in the latest decade were discussed intensively, and some important directions and priorities for future studies were proposed. Currently, spectral, temporal and spatial features are the major theoretical bases for crop pattern mapping. The mapping method based on single imagery is characterized by its simple implementation, but with difficulty of capturing imagery at the best time for distinguishing different crops. Instead, the mapping method based on time-series of imagery can make full use of temporal features and is thus widely used for crop mapping, among which the methods using multiple features are more suitable than the ones using a single feature for regions with complicated planting structure. To some extent, feature-oriented statistical modeling method can resolve the mixed-pixel problem but its robustness needs to be improved. Furthermore, large-scale crop pattern mapping can be done by combining the remote sensing and agriculture statistics. However, due to coarse resolution, the derived maps show poor region suitability. Future crop pattern mapping should target at developing “a map of crops”, the emphasis must be put on covering more crop types, enlarging the mapping areas, utilizing the superiority of blending multi-source data, strengthening the data preprocessing, optimizing the feature extraction and classifier selection, and improving the temporal and spatial scales of crop pattern mapping so as to better meet the needs of multi-faceted agricultural applications.
农作物空间格局遥感监测研究进展
[J].
Recent progresses in monitoring crop spatial patterns by using remote sensing technologies
[J].
Mapping paddy rice planting area in northeastern Asia with Landsat 8 images, phenology-based algorithm and Google Earth Engine
[J].Area and spatial distribution information of paddy rice are important for understanding of food security, water use, greenhouse gas emission, and disease transmission. Due to climatic warming and increasing food demand, paddy rice has been expanding rapidly in high latitude areas in the last decade, particularly in northeastern (NE) Asia. Current knowledge about paddy rice fields in these cold regions is limited. The phenology- and pixel-based paddy rice mapping (PPPM) algorithm, which identifies the flooding signals in the rice transplanting phase, has been effectively applied in tropical areas, but has not been tested at large scale of cold regions yet. Despite the effects from more snow/ice, paddy rice mapping in high latitude areas is assumed to be more encouraging due to less clouds, lower cropping intensity, and more observations from Landsat sidelaps. Moreover, the enhanced temporal and geographic coverage from Landsat 8 provides an opportunity to acquire phenology information and map paddy rice. This study evaluated the potential of Landsat 8 images on annual paddy rice mapping in NE Asia which was dominated by single cropping system, including Japan, North Korea, South Korea, and NE China. The cloud computing approach was used to process all the available Landsat 8 imagery in 2014 (143 path/rows, similar to 3290 scenes) with the Google Earth Engine (GEE) platform. The results indicated that the Landsat 8, GEE, and improved PPPM algorithm can effectively support the yearly mapping of paddy rice in NE Asia. The resultant paddy rice map has a high accuracy with the producer (user) accuracy of 73% (92%), based on the validation using very high resolution images and intensive field photos. Geographic characteristics of paddy rice distribution were analyzed from aspects of country, elevation, latitude, and climate. The resultant 30-m paddy rice map is expected to provide unprecedented details about the area, spatial distribution, and landscape pattern of paddy rice fields in NE Asia, which will contribute to food security assessment, water resource management, estimation of greenhouse gas emissions, and disease control. (C) 2016 Elsevier Inc.
The RapeseedMap10 database: Annual maps of rapeseed at a spatial resolution of 10 m based on multi-source data
[J].. Large-scale, high-resolution maps of rapeseed (Brassica napus L.), a\nmajor oilseed crop, are critical for predicting annual production and\nensuring global energy security, but such maps are still not freely\navailable for many areas. In this study, we developed a new pixel- and\nphenology-based algorithm and produced a new data product for rapeseed\nplanting areas (2017–2019) in 33 countries at 10 m spatial resolution based\non multiple data. Our product is strongly consistent at the national level\nwith official statistics of the Food and Agricultural Organization of the\nUnited Nations. Our rapeseed maps achieved F1 spatial consistency scores of\nat least 0.81 when compared with the Cropland Data Layer in the United\nStates, the Annual Crop Inventory in Canada, the Crop Map of England, and\nthe Land Cover Map of France. Moreover, F1 scores based on independent\nvalidation samples ranged from 0.84 to 0.91, implying a good consistency\nwith ground truth. In almost all countries covered in this study, the\nrapeseed crop rotation interval was at least 2 years. Our derived maps\nsuggest, with reasonable accuracy, the robustness of the algorithm in\nidentifying rapeseed over large regions with various climates and\nlandscapes. Scientists and local growers can use the freely downloadable\nderived rapeseed planting areas to help predict rapeseed production and\noptimize planting structures. The product is publicly available at\nhttps://doi.org/10.17632/ydf3m7pd4j.3 (Han et al., 2021).\n
Measuring phenological variability from satellite imagery
[J].
Climate controls on vegetation phenological patterns in northern mid- and high latitudes inferred from MODIS data
[J].
Mapping crop phenology in near real-time using satellite remote sensing: Challenges and opportunities
[J].
时空协同的地块尺度作物分布遥感提取
[J].
Parcel-based crop distribution extraction using the spatiotemporal collaboration of remote sensing data
[J].
Object Based Image Analysis and Data Mining applied to a remotely sensed Landsat time-series to map sugarcane over large areas
[J].
Object-oriented classification of sugarcane using time-series middle-resolution remote sensing data based on AdaBoost
[J].
Mapping sugarcane plantation dynamics in Guangxi, China, by time series Sentinel-1, Sentinel-2 and Landsat images
[J].
Early season mapping of sugarcane by applying machine learning algorithms to sentinel-1A/2 time series data: A case study in Zhanjiang City, China
[J].
Sugarcane planting area and growth monitoring based on remote sensing in Guangxi
[J].
High-resolution map of sugarcane cultivation in Brazil using a phenology-based method
[J].. Sugarcane is the most important source of sugar, and its\ncultivation area has undergone rapid expansion, replacing other crops,\npastures, and forests. Brazil is the world's largest sugarcane producer and\ncontributed to approximately 38.6 % of the world's total production in\n2019. Sugarcane in Brazil can be harvested from April to December in\nthe south-central area and from September to April in the northeast area. The\nflexible phenology and harvest conditions of sugarcane in Brazil make it\ndifficult to identify the harvest area at state to country scales. In this\nstudy, we developed a phenology-based method to identify the harvest area of\nsugarcane in Brazil by incorporating the multiple phenology conditions into\na time-weighted dynamic time warping method (TWDTW). Then, we produced\nannual 30 m spatial resolution sugarcane harvest maps (2016–2019) for 14\nstates in Brazil (over 98 % of the harvest area) based on the proposed\nmethod using Landsat-7, Landsat-8, and Sentinel-2 optical data. The proposed method\nperformed well in identifying sugarcane harvest area with limited training\nsample data. Validations for the 2018 harvest year displayed high accuracy,\nwith the user's, producer's, and overall accuracies of 94.35 %, 87.04 %, and\n91.47 % in Brazil, respectively. In addition, the identified harvest area\nof sugarcane exhibited good correlations with the agricultural statistical\ndata provided by the Brazilian Institute of Geography and Statistics (IBGE)\nat the municipality, microregion, and mesoregion levels. The 30 m Brazil\nsugarcane harvest maps can be obtained at\nhttps://doi.org/10.6084/m9.figshare.14213909 (Zheng et al., 2021).\n
A time-weighted dynamic time warping method for land-use and land-cover mapping
[J].
Integrating coarse-resolution images and agricultural statistics to generate sub-pixel crop type maps and reconciled area estimates
[J].
Two shifts for crop mapping: Leveraging aggregate crop statistics to improve satellite-based maps in new regions
[J].
Mapping crop distribution patterns and changes in China from 2000 to 2015 by fusing remote-sensing, statistics, and knowledge-based crop phenology
[J].
农作物分布格局动态变化的遥感监测——以东北三省为例
[J].
DOI:10.3864/j.issn.0578-1752.2013.13.005
[本文引用: 1]
【目的】当前对涉及到耕地内部不同作物空间分布及其变化的研究较少。本文旨在探讨大尺度作物种植面积和分布格局遥感提取方法及景观生态学中景观格局指数在作物格局动态变化分析中的应用。【方法】基于2005年和2010年作物生育期内遥感影像全覆盖的MODIS-NDVI数据,利用RS、GIS技术,通过分析东北地区主要作物(水稻、玉米、大豆)的种植结构、物候历及NDVI曲线特征,建立不同作物面积遥感提取模型,提取大尺度农作物空间分布格局信息。同时,利用景观格局指数方法分析农作物格局动态变化特征和变化规律。【结果】与多年平均统计数据比较,基于MODIS遥感数据提取的作物面积信息,2005年和2010年平均精度达到了90%以上;5年间,东北地区主要作物种植结构发生了较大变化。其中大豆平均斑块面积减少,面积年动态度为-4.47%,水稻和玉米平均斑块面积均增加,且5年的变化幅度均超过20%。【结论】成本和收益是作物面积增加或减少的主要原因;用中等分辨率的遥感数据进行大尺度作物面积提取的方法是可行的;景观生态学中格局指数可以用来分析耕地内部作物格局的动态变化规律。
Remote sensing based dynamic changes analysis of crop distribution pattern—Taking northeast China as an example
[J].
NASA Shuttle Radar Topography Mission Global 1 arc second
