

1 引言
卫星遥感具有覆盖范围广、成本低等特点,很多产品也相继应用于水华的监测中,如MODIS系列[14-15]、Landsat系列[16]、高分系列[17]等。但水华爆发迅速,卫星遥感的空间分辨率和时效性难以满足水华预测的需求,并且南方地区多云多雨的气候条件也限制了卫星遥感的应用。相比卫星遥感,无人机遥感机动灵活、时效性强、分辨率高,能够有效开展水华的实时、快速监测,如Zhao等[18]基于无人机多光谱数据,通过构建归一化植被指数(Normalized Difference Vegetation Index, NDVI),采用阈值分割法实现了对滇池水华的监测;丁铭等[19]通过无人机高光谱数据的光谱差异实现了水华的提取。
目前对水华进行预测的研究普遍是基于卫星遥感影像的水华面积预测或通过水华爆发概率间接预测水华空间分布,如张虎军等[14]结合实测数据和卫星遥感数据构建多元线性回归预测模型,实现了太湖年度水华的面积预测;吴娟等[15]通过太湖气象水文水质数据与MODIS数据,采用支持向量机、长短记忆神经网络、极端梯度提升树模型成功对太湖水华面积进行了预测;祁国华等[16]通过构建气象数据和遥感数据间的非线性关系实现对巢湖水华发生概率的预测;刘东等[17]构建了一种基于遥感藻总量和气象因子的不同湖区水华暴发概率预测方法,模拟了巢湖的水华分布。基于无人机遥感的研究则还处在水华的提取和监测阶段,还未发现精细化的水华预测方法。地理加权回归模型(Geographically Weighted Regression,GWR)是一种空间分析技术,广泛应用于地理学及空间模式分析的相关学科,它考虑到了空间对象的局部效应,通过建立水质、水文、气象数据与水华关系,为实现水华预测提供了可能[20]。
本文从水华生长环境因素和移动规律入手,以无人机多光谱影像和实测水质参数为数据源,先通过像素匹配法(Matching Pixel-by-pixel,MPP)反演水质参数及NDVI阈值法提取水华信息,后基于GWR实现了水华面积和位置的预测,提出了一种涵盖面积信息和位置信息的水华短时预测模型,在广东省鹤地水库开展了实验和应用,可为其他湖库水华的遥感预测提供参考。
2 研究方法
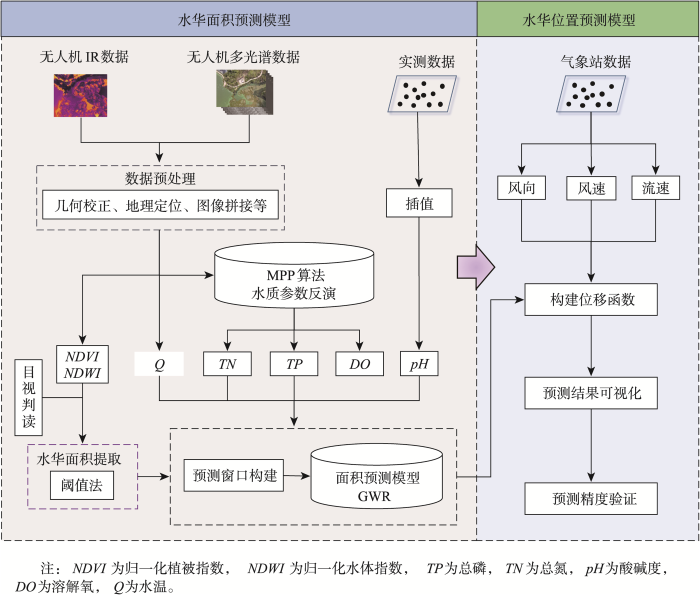
针对目前缺乏精细化的水华预测方法,本文建立了一种水华短时预测模型,其设计思路为:① 水华面积预测:通过MPP算法进行水质参数反演,构建预测窗口,结合GWR实现水华面积预测;② 水华位置预测:通过气象数据与水华面积的建立位移函数,实现预测结果可视化。模型构建流程如图1所示。
图1
2.1 水质参数模型构建及水华信息提取
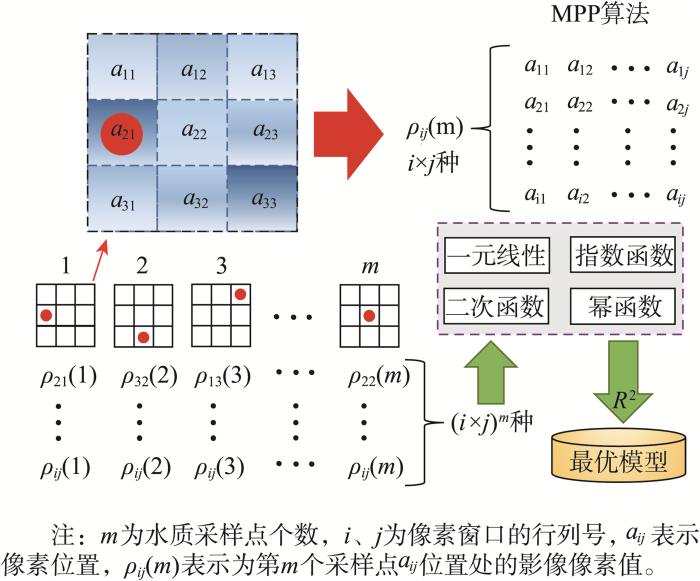
无人机影像的空间分辨率一般为厘米级,单个像元对应的水面区域难以准确匹配采样点,因此,本文选择MPP算法进行多光谱反射率与水质参数的拟合,采用3×3的像素窗口进行模型的构建。
图2
为避免陆地及植被等因素对水质参数遥感定量反演结果的影响,通过无人机多光谱影像构建 NDVI(> 0.3,< 0.8)和归一化水体指数(Normalized Difference Water Index,NDWI > 0.2)对植被及水体信息进行精确提取,在此基础上结合阈值法和人工目视判读实现对水华信息的提取,其计算公式如下:
式中:
2.2 水华面积与位置预测
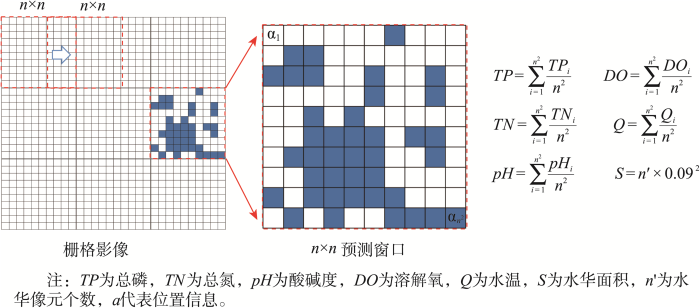
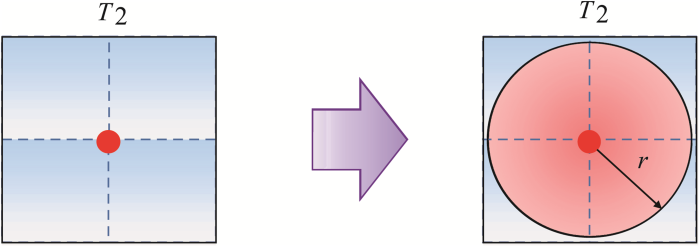
水华面积的预测是通过引入预测窗口建立不同时相(相同时间步长)的水华面积与水质参数间的函数关系来实现。其中,时间步长的确定需要在模拟效率和预测精度间进行权衡,预测窗口本质上是大小为n×n的局部像元矩阵,预测窗口大小需根据遥感影像的空间分辨率进行调整。如 图3所示,预测窗口是以遍历方式进行移动,水华的面积为预测窗口内水华像元数目与其空间分辨率的乘积,各水质参数为预测窗口内所有值的算术平均数,公式如下:
式中:
图3
式中:
图4
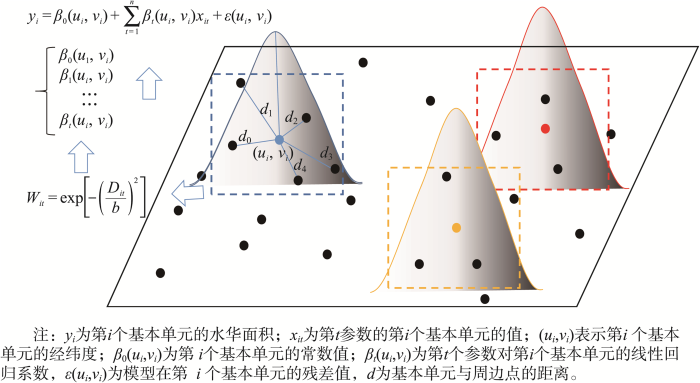
本文使用的GWR选择交叉验证(Cross-validation,CV)方法来确定带宽,选用高斯函数法计算空间权重矩阵,构建出一个单调递减的连续性函数式,公式如下:
式中:
基于GWR,以预测窗口为基本单元,时间步长为3.5 h,结合
(1)将
(2)将训练模型结果栅格化,并自变量系数、常数项重采样为0.09 m,对残差结果通过反距离权重法插值得栅格残差。
(3)按照GWR原理将训练模型结果进行回带建立预测模型,将待预测数据的各自变量参数带入模型并与残差相加,得到最终的水华面积预测结果。
式中:有上标“
考虑到晴朗天气下水华位置的变化主要受风和水流的影响,本文水华位置的预测仅考虑这两种因素,基于相同时间间隔的多组风速、风向、流速、水华面积与水华空间坐标间的关系建立位移函数来实现水华位置的预测。论文水流方向视为由上游到下游,并以水流方向为x轴、其垂直方向为y轴建立相对坐标系,其公式如下:
式中:
2.3 预测结果可视化
预测结果的可视化(图5)是通过
式中:
图5
2.4 精度评价
引入混淆矩阵把水华预测结果分为水华和非水华2个类别,通过生产者精度、总体分类精度、Kappa系数3个指标来对预测结果进行评价。其中,生产者精度表示被预测为是水华的样本中,真正的水华所占的比例;总体分类精度表示预测结果与实际提取结果具有一致性的概率;Kappa系数是一种衡量一致性的多变量分析方法,常用于评价遥感影像分类的正确程度[25]。公式如下:
式中:
3 实验区概况及数据来源
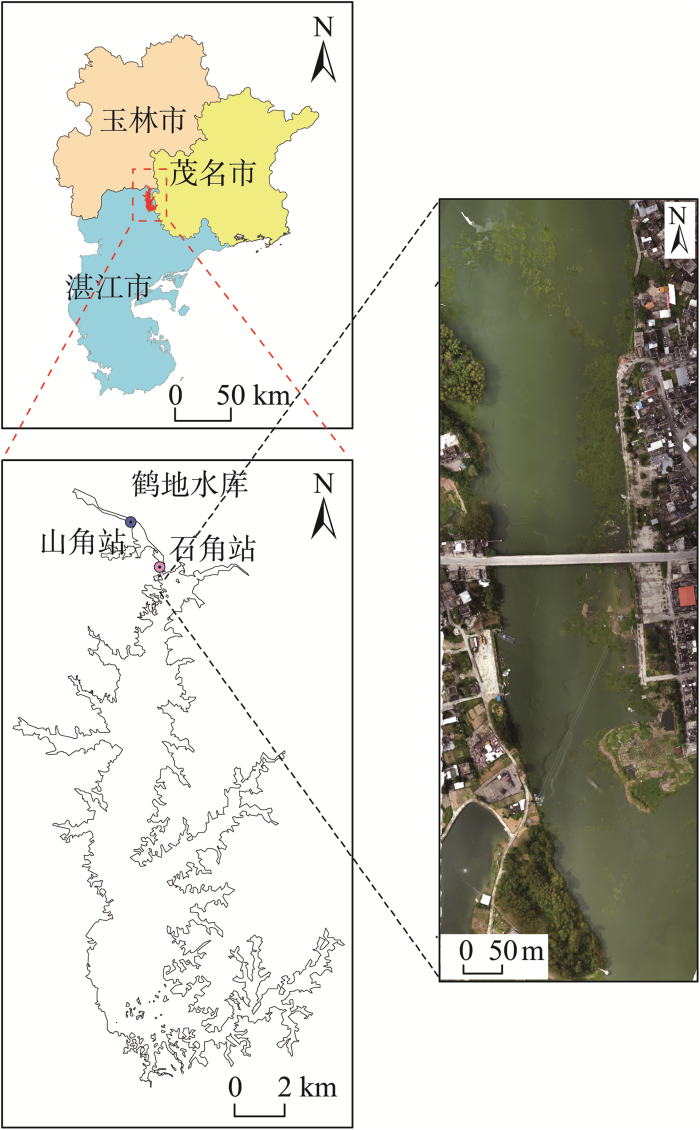
3.1 实验区概况
图6
3.2 数据来源
3.2.1 遥感数据
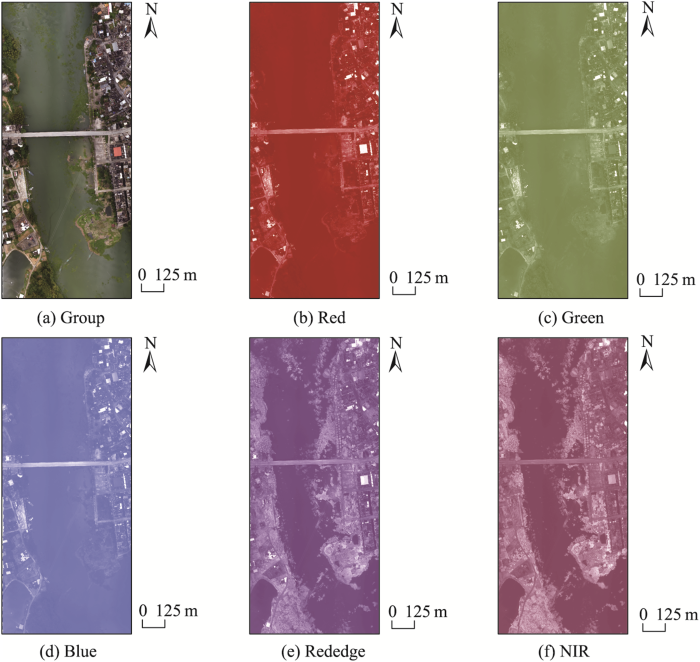
无人机多光谱影像通过小型四旋翼航测无人机(P4 Multispectral和 MAVIC 2 Enterprise)(表1)采集获取。P4 Multispectral搭载一台一体式多光谱相机,包含1个用于可见光成像的彩色传感器和5个用于多光谱成像的单色传感器(Blue、Green、Red、Red Edge、NIR),每个传感器有效像素为208万,MAVIC 2 Enterprise搭载红外传感器和可见光传感器。为了避免水华垂直结构的变化对预测结果产生影响,本文选择晴空、少云、风速较小的天气进行数据采集,2台无人机各飞行6个架次,飞行高度设为150 m,飞行速度10 m/s,拍照间隔2 s,空间分辨率0.09 m,航向重叠率80%,旁向重叠率60%,采集区域面积为4 499.81 m²。
表1 无人机传感器参数及影像采集时间
Tab. 1
| 传感器 | 波段 | 波段名称 | 波长范围 | 采集时间(2022年夏季某月) |
|---|---|---|---|---|
| P4 Multispectral多光谱相机 | b1 | Blue | 450 nm ± 16 nm | 21日10:30 |
| b2 | Green | 560 nm ± 16 nm | 21日14:00 | |
| b3 | Red | 650 nm ± 16 nm | 21日17:30 | |
| b4 | Red Edge | 730 nm ± 16 nm | 22日10:30 | |
| b5 | NIR | 840 nm ± 26 nm | 22日14:00 | |
| MAVIC 2 Enterprise红外相机 | b1 | IR | 8~14 μm | 22日17:30 |
利用Pix4d软件对获取的无人机遥感数据进行几何校正、地理定位、图像拼接等预处理,通过标准标定板进行多通道光谱影像辐射校正和辐射定标,生成具有地表真实反射率的正射影像。研究区多光谱正射影像如图7所示。
图7
3.2.2 实测数据
在每次采集无人机多光谱影像时同步进行水质采样(表2),在研究区内均匀选取10个采样点(包括6个实验点和4个验证点),于水面以下50 cm位置进行水质采样,同时用GPS进行定位,共采样60 次,采样点的空间分布如图8所示。水质采样仪器使用AMT-YB101型便携式多参数水质检测仪,采集数据主要包含pH、溶解氧(Dissolved Oxygen, DO)、总氮(Total Nitrogen, TN)、总磷(Total Phosphorus, TP)等。为探究水华的移动规律,对研究区内12处水华区域进行标记(图8),并记录不同时刻被标记水华的位置信息。风速、风向、流速等数据来自鹤地水库各监测站和中国气象数据网(
表2 实测数据(部分)
Tab. 2
| 时间 | pH | DO/(mg/L) | TN/(mg/L) | TP/(mg/L) | 风速/(m/s) | 风向/° | 流速/(m/s) |
|---|---|---|---|---|---|---|---|
| 21日10:30 | 8.12 | 7.54 | 0.87 | 0.041 | 1.2 | 264.6 | 0.21 |
| 21日10:30 | 8.16 | 7.68 | 0.84 | 0.050 | 1.2 | 267.5 | 0.23 |
| 21日10:30 | 8.23 | 8.56 | 0.91 | 0.047 | 1.2 | 266.1 | 0.21 |
| 21日10:30 | 8.17 | 5.96 | 0.85 | 0.042 | 1.2 | 263.8 | 0.21 |
| 21日10:30 | 8.29 | 9.28 | 0.87 | 0.048 | 1.2 | 267.6 | 0.21 |
| 21日14:00 | 8.18 | 7.96 | 0.82 | 0.051 | 1.5 | 280.3 | 0.12 |
| 21日14:00 | 8.19 | 8.13 | 0.88 | 0.046 | 1.5 | 278.7 | 0.11 |
| 21日14:00 | 8.26 | 9.21 | 0.86 | 0.042 | 1.5 | 278.6 | 0.12 |
| 21日14:00 | 8.20 | 10.02 | 0.81 | 0.051 | 1.5 | 279.5 | 0.12 |
| 21日14:00 | 8.27 | 8.64 | 0.92 | 0.047 | 1.5 | 280.1 | 0.11 |
| 21日17:30 | 8.19 | 7.95 | 0.84 | 0.043 | 1.3 | 245.6 | 0.16 |
| 21日17:30 | 8.18 | 8.97 | 0.82 | 0.049 | 1.3 | 247.8 | 0.16 |
| 21日17:30 | 8.21 | 7.69 | 0.84 | 0.049 | 1.3 | 246.6 | 0.17 |
| 21日17:30 | 8.25 | 9.98 | 0.90 | 0.047 | 1.3 | 243.9 | 0.16 |
| 21日17:30 | 8.26 | 9.63 | 0.87 | 0.045 | 1.3 | 246.3 | 0.16 |
图8
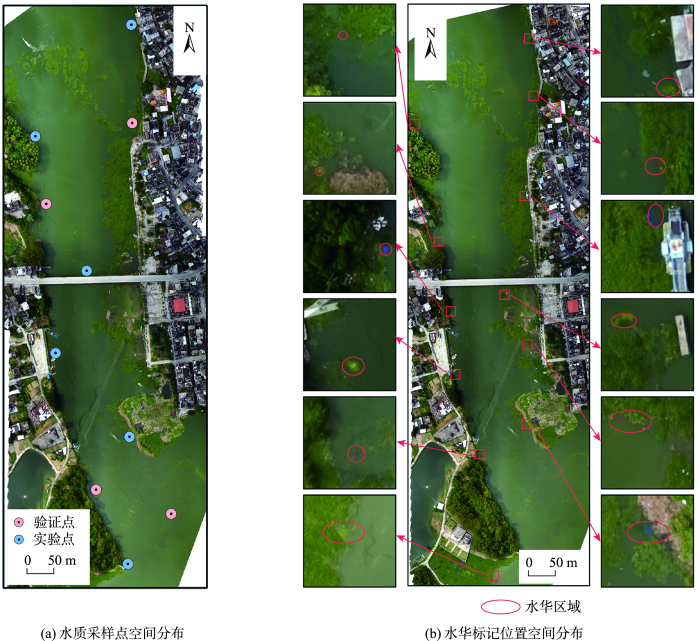
图8
水质采样点及水华标记位置
Fig. 8
Water quality sampling point and bloom marking position
4 结果及分析
4.1 水质参数反演结果
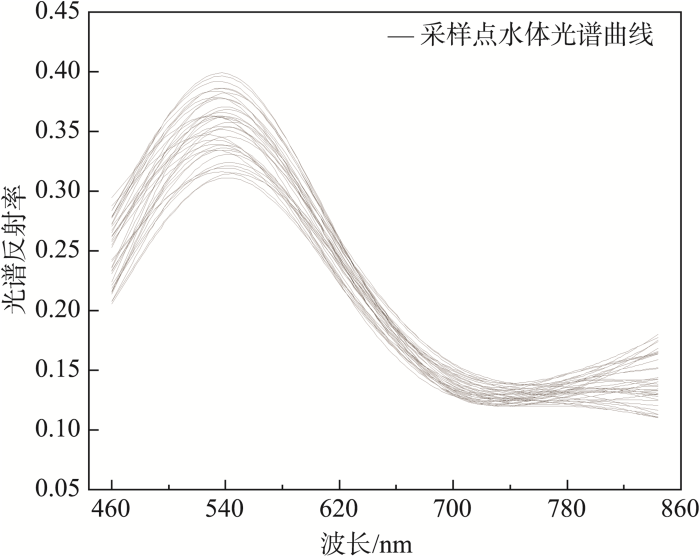
水质参数与水华的生长代谢有着紧密的关系,是水华面积预测的基础。本文基于获取的无人机多光谱影像,通过每个采样点的光谱反射率数据得到水体光谱曲线(图9)。可以看出各采样点光谱曲线有一定差别,但整体都呈现出一般内陆水体的光谱特征,在460~530 nm波段区间变化基本趋于一致,表现为反射率与波长呈正相关变化;在560 nm附近出现反射峰,这是因为水体中叶绿素和其他可溶性有机物在该波段内的吸收率较弱;在560~710 nm 反射率与波长呈负相关变化,710 nm附近出现反射率谷,主要归因于水体中藻蓝蛋白色素及叶绿素的强吸收。
图9
在构建水质参数反演模型时,需要选取与实测水质参数拟合度最高的波段或波段组合作为模型输入,本文基于6个采样点实测水质参数,共建立了47种不同的反射率波段或波段组合来进行相关性分析,最终筛选出与水质参数值最显著相关的 (b2+b3)/b5(r=0.453)、b1×b4(r=0.496)、(b3-b2)/b4(r=0.517)分别作为反演TP、TN、DO的特征波段反射率。通过选出的最佳波段作为自变量,分别建立线性函数模型、二次函数模型、指数函数模型和幂函数模型,最后根据R2选择出最优模型作为水质参数反演模型。3种水质参数的最优模型表达式如表3所示。
表3 水质参数模型表达式及精度
Tab. 3
| 水质参数 | 最佳波段 | r | 模型表达式 | R2 |
|---|---|---|---|---|
| TP | (b2+b3)/b5 | 0.45 | y=0.07839e1.0483x | 0.78 |
| TN | b1×b4 | 0.50 | y=0.04872x2-0.02873x+0.08913 | 0.80 |
| DO | (b3-b2)/b4 | 0.52 | y=0.07254x2-0.00871x+0.96418 | 0.72 |
为了后期更好地提取和预测水华,需要降低背景信息的干扰,排除非水体区域及水体区域内水生植被、船舶等因素的影响。利用无人机多光谱数据构建NDWI,通过NDWI > 0.2的阈值实现水体的精准提取,并在此基础上完成水质参数的反演。其中,TP、TN、DO通过水质参数反演模型获取,pH通过样点空间插值获取,NDVI通过波段计算获取,水温数据借助DJI Thermal Analysis Tool 3工具处理红外影像得到。以21日14:00的数据为例,各水质参数的空间分布如图10所示,可以看出研究区水质整体呈弱碱性,pH为8.16~8.42,表现出由上游到下游递减;DO为1.402~14.13 mg/L,在近岸及水生植被周边浓度整体偏低;TP为0.0065~0.0804 mg/L,浓度呈现出由两岸向中心递减趋势,TN为0.032 ~ 1.094 mg/L,高浓度主要分布在上游西部和下游东部;NDVI为-0.747~0.728,空间分布特征与TN相似;水温为27.34~34.68℃,除下游西部略低外,整体分布较均匀。
图10
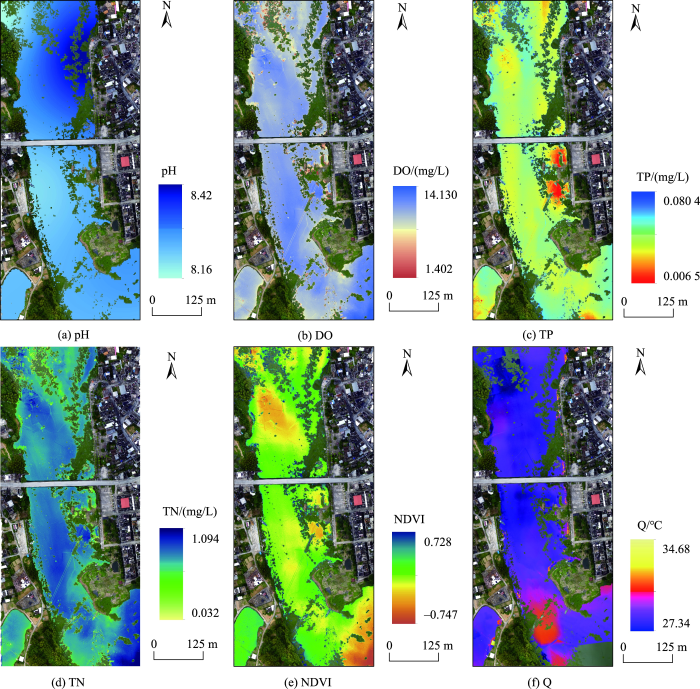
图10
研究区水质参数空间分布(21日14:00)
Fig. 10
Comparison of cyanobacteria bloom area extraction results with true color orthophoto (10:30, 22nd)
通过6个时刻验证采样点的实测水质参数与相应位置处的反演结果进行线性拟合分析,以此验证TN、TP、DO的反演精度。由图11可以看出,3种水质参数反演结果与实测数据都有着较高的相关性,其R2分别为0.89、0.85、0.89,RMSE分别为0.018、0.003、0.649,说明水质反演结果具有较高的可信度,可以为水华预测提供数据支持。
图11
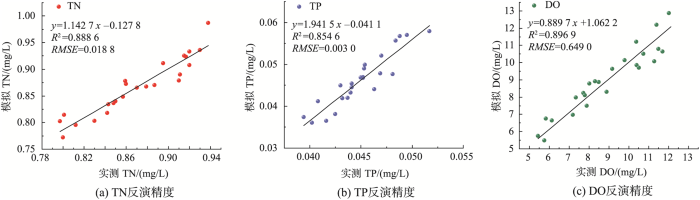
图11
实测TN、TP、DO与反演结果散点图
Fig. 11
Scatter plot of measured TN, TP, DO and inversion results
4.2 水华面积提取结果
通过构建NDVI,采用阈值法结合人工目视判读对水华面积进行提取,以无人机多光谱数据合成的真彩色正射影像为底图,对提取结果进行验证。由图12(以22日10:30的数据为例)可以看出,研究区内水华提取结果的空间分布主要以近岸水面为主,在a、b、c、d区域内分布较为集中。通过将提取结果与正射影像进行叠加,可以看出提取结果无论是从水华爆发程度还是空间分布上都与正射影像目视结果具有较高的一致性,通过这种方法可以有效提取水华的空间分布与面积,并有较高的可信度。
图12
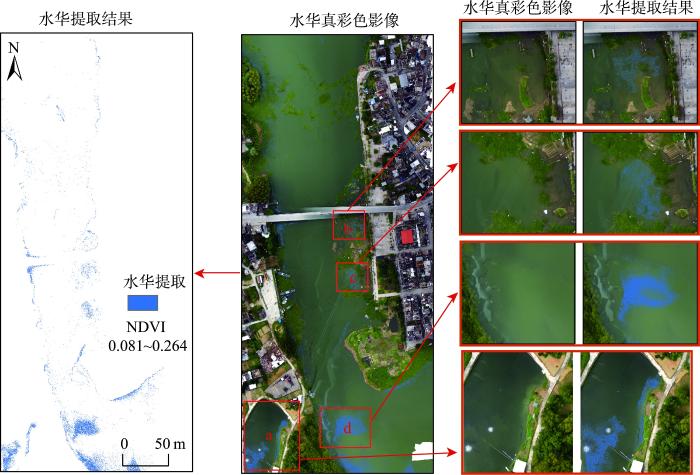
图12
水华面积提取结果与真彩色正射影像对比(22日10:30)
Fig. 12
The results of bloom area extraction are compared with true color orthophoto (10:30, 22nd)
图13是通过阈值法结合人工目视判读提取的21日10:30—22日17:30共6个时刻的水华,表4为不同时段影像提取的水华信息。整体来看,水华的爆发具有一定规律性,表现为在10:30—14:00爆发程度要高于14:00—17:30,21日10:30—14:00水华面积增长11.25 m2,14:00—17:30水华面积增长7.67m2,22日10:30—14:00水华面积增长12.64 m2,14:00—17:30水华面积增长9.04 m2。水华的空间分布具有趋流性,因为其主要在水流和风力的作用下进行移动,21日10:30水华聚集区主要分布在研究区上游西侧,14:00水华逐渐向东南方向扩散, 18:00水华聚集区由上游转移到下游。22日10:30水华分布以上游近岸及下游西侧为主,14:00向东扩散,17:30主要集中分布在下游。
图13
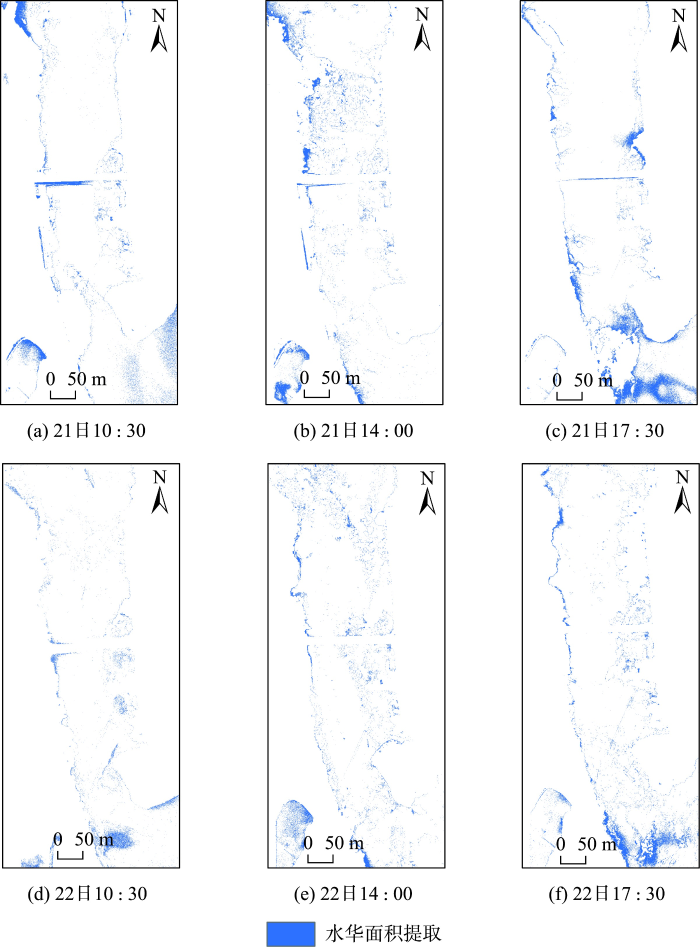
图13
水华提取结果(21日10:30—22日17:30)
Fig. 13
Bloom extraction results (10:30, 21st—17:30, 22nd)
表4 水华面积提取信息
Tab. 4
| 时间 | 像元数目/个 | 面积m2 |
|---|---|---|
| 21日10:30 | 1 354 627 | 109.72 |
| 21日14:00 | 1 493 579 | 120.97 |
| 21日17:30 | 1 588 194 | 128.64 |
| 22日10:30 | 1 030 591 | 83.47 |
| 22日14:00 | 1 186 588 | 96.11 |
| 22日17:30 | 1 298 194 | 105.15 |
4.3 水华预测结果
通过提取21日10:30—22日14:00共5个时刻的水华信息,结合水质参数及气象数据组成3组训练样本来构建水华预测训练模型,最终实现22日17:30的水华预测。在本文的预测模型中,预测窗口尺寸的选取直接影响预测结果的精度,分别采用8×8、10×10、12×12、14×14的预测窗口进行对比实验,遴选出最优尺寸窗口。图14为4种预测窗口的预测结果,可以看出当选用8×8的预测窗口时,预测模型生成的预测点最多,预测结果空间分布过于分散。当选用12×12、14×14的预测窗口时,预测点偏少,容易产生水华面积的过量预测,特别是在水华分布稀疏的区域预测效果不佳。相比其他3种尺寸的预测窗口,10×10预测窗口的预测点数目和预测半径大小都更加适宜,预测结果与提取结果在空间分布上也更为接近,尤其是在水体边界及下游水华聚集区的重合度很高,虽然水华分布分散的区域预测结果并不理想,但在一定程度上反映了水华的爆发趋势和空间分布,可为湖库水华爆发风险的短期预测提供参考。
图14
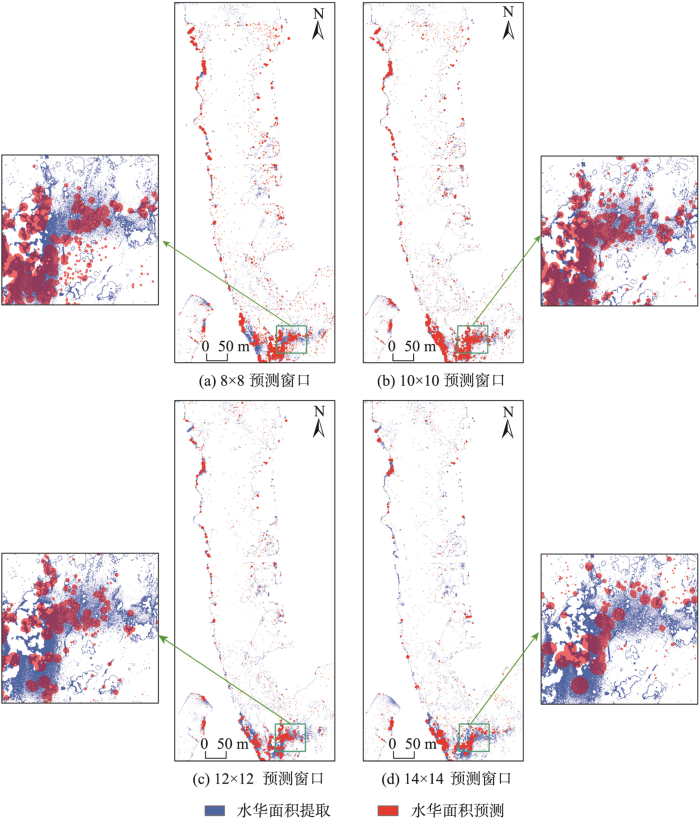
图14
4种尺寸预测窗口的预测结果
Fig. 14
Prediction results of four sizes of prediction Windows
为了准确评估4种预测窗口预测结果的精度,以22日17:30提取的水华作为真实值,通过引入总体分类精度、生产者精度和Kappa系数对预测结果进行精度评价。由表5可看出,22日17:30提取的水体信息共30 834 683个像元,其中提取水华的像元共1 298 194个。使用4种预测窗口预测结果提取的水华像元个数分别为1 175 486、1 248 745、 1 021 482、847 268,其中,10×10预测窗口预测结果提取的水华像元数最接近真实值,水华面积预测误差仅为3.81%,表明其在水华总面积预测上有更高的准确性。图15为4种预测窗口水华预测正确像元和错误像元分布情况,可以看出10×10预测窗口正确预测像元的个数更多,特别是在下游水华聚集区更明显。4种预测窗口预测结果的3种精度指标如表6所示,综合来看,不同预测窗口预测结果整体精度的由高到低为10×10 > 8×8 > 12×12 > 14×14,4种预测窗口预测结果都具有较高的总体分类精度(0.97~0.98),表明预测模型对水华和非水华有着不错的辨别能力,生产者精度和Kappa系数均高于0.5,表明预测模型在水华的面积及空间分布上都有良好的预测能力。其中,10×10预测窗口预测结果与NDVI阈值提取结果最吻合,其总体分类精度、生产者精度、Kappa系数分别为0.98、0.77、0.77。
表5 水华提取像元个数(22日17:30)
Tab. 5
| 数据 | 水华像元数/个 | 非水华像元数/个 | 水华面积预测误差/% |
|---|---|---|---|
| NDVI阈值提取结果 | 1 298 194 | 29 536 489 | - |
| 8×8预测窗口预测结果 | 1 175 486 | 29 659 197 | 9.45 |
| 10×10预测窗口预测结果 | 1 248 745 | 29 585 938 | 3.81 |
| 12×12预测窗口预测结果 | 1 021 482 | 29 813 201 | 21.32 |
| 14×14预测窗口预测结果 | 847 268 | 29 987 415 | 34.73 |
图15
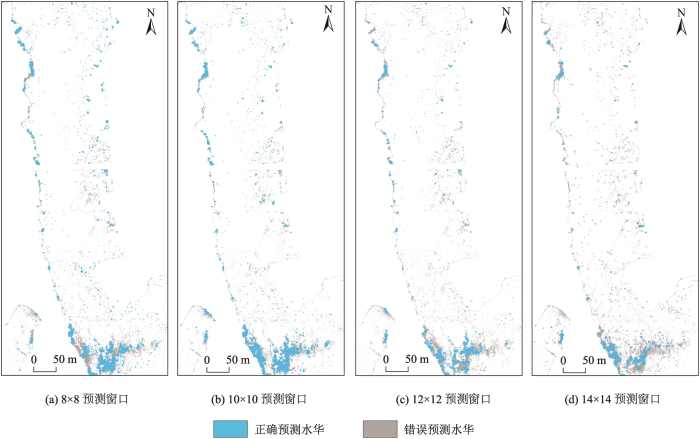
图15
水华预测正确像元和错误像元分布情况
Fig. 15
Distribution of correct and wrong pixels in the prediction of water bloom
表6 4种预测窗口预测结果的精度指标
Tab. 6
| 预测窗口 | 预测类型 | 提取类型 | 生产者精度 | 总体分类精度 | Kappa系数 | |||||
|---|---|---|---|---|---|---|---|---|---|---|
| 水华 | 非水华 | |||||||||
| 8×8 | 水华 | 860 661 | 314 825 | 0.66 | 0.98 | 0.68 | ||||
| 非水华 | 437 533 | 29 221 664 | ||||||||
| 10×10 | 水华 | 997 949 | 250 796 | 0.77 | 0.98 | 0.77 | ||||
| 非水华 | 300 245 | 29 285 693 | ||||||||
| 12×12 | 水华 | 708 751 | 312 731 | 0.55 | 0.97 | 0.59 | ||||
| 非水华 | 589 443 | 29 223 758 | ||||||||
| 14×14 | 水华 | 588 348 | 258 920 | 0.45 | 0.97 | 0.53 | ||||
| 非水华 | 709 846 | 29 277 569 | ||||||||
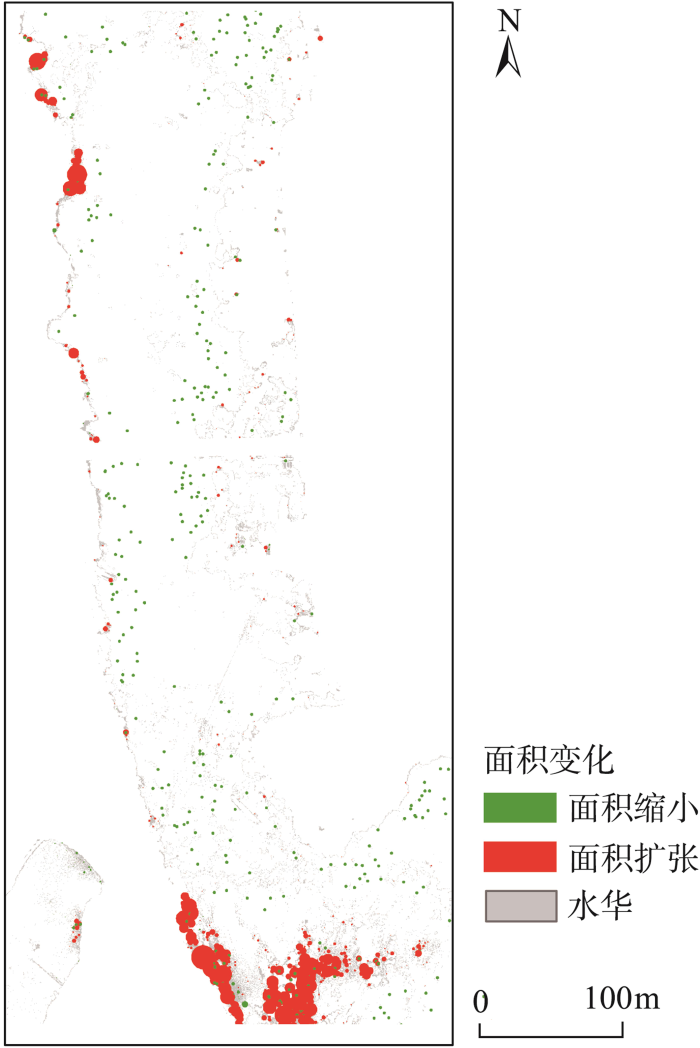
根据每个基本单元内初始时刻和预测时刻的水华面积,分别计算每个基本单元内水华的扩张或缩小面积,然后建立对应半径的缓冲区,以此表示每个基本单元水华的面积变化及位置变化。从 图16中可以看出,相比初始时刻,水华面积以扩张为主,主要分布在下游西侧的水华聚集区;水华面积缩小区域主要分布在上游、中游近岸水域。水华的位置变化整体上表现为由上游向下游,由东向西移动,大多聚集在下游水域,少量聚集在上游西侧近岸水域。
图16
5 讨论
表7 本文与其他文献结果对比
Tab. 7
缺乏对水华物种信息的考虑。本预测模型未考虑水华物种的差别对模型精度的影响,采用在一定程度上反映水华生物量的NDVI表征水华强度,而鹤地水库藻类群落结构的季节变化较大,空间差异性也很大,在今后模型的优化中,可将水华物种信息纳入预测模型中。
6 结论
本文使用无人机遥感影像和同步实测数据,基于MPP算法和GWR构建了水华短时预测模型,预测了水华的面积和空间分布,分析了预测窗口对预测结果的影响,结果表明:
(1)基于无人机多光谱遥感影像结合地面水质同步采样数据定量反演了总氮、总磷和溶解氧的浓度,3种水质参数反演结果与实测数据的决定系数分别达到0.89、0.85、0.89。NDVI阈值法提取的水华信息在水华爆发程度和空间分布上都与真彩色正射影像目视结果有着较高的一致性,可以反映出较真实的水华信息。
(2)本文提出的水华预测模型对水华面积的预测精度达到96.19%,能准确预测水华的空间分布,反映水华面积及位置变化特性,对水华和非水华的总体分类精度均大于0.96,生产者精度、Kappa系数均大于0.5。
(3)不同尺寸的预测窗口直接影响预测结果精度,相比其他3种尺寸,10×10预测窗口与无人机数据的空间分辨率更匹配,得到的水华面积预测误差最低(3.81%),产生的预测点数与实际更加吻合,在水华的空间分布上其总体分类精度、生产者精度、Kappa系数最高,分别为0.98、0.77、0.77,故最适合用于本文水华的预测。
本文提出的水华短时预测模型是耦合MPP算法和GWR,应用于水华的精细化监测、预测,实现了未来短时的水华面积及空间分布的模拟。通过对预测窗口的调整可适用于不同水域的水华预测,可为水华预警监测提供一定的技术支持,为相关部门提供借鉴与指导,提前制定合理的水华应急和防治措施。
参考文献
星云湖微囊藻密度周年变化及其与水质指标的关系
[J].
Annual variations of Microcystis density and their relationships with water quality indices in Xingyun Lake
[J].
湖泊蓝藻水华防控方法综述
[J].
Review on the control and mitigation strategies of lake cyanobacterial blooms
[J].
三峡库区重点支流水华现状、成因及防控对策
[J].
Current situation, causes and control measures of water bloom in the key tributaries of the Three Gorges Reservoir
[J].
Effects of cyanobacterial blooms in eutrophic lakes on water quality of connected rivers
[J].
Evaluation of daily and seasonal variations in a semi-closed photobioreactor for microalgae-based bioremediation of agricultural runoff at full-scale
[J].
浅水湖泊湖沼学与太湖富营养化控制研究
[J].
Shallow Lake limnology and control of eutrophication in Lake Taihu
[J].
Effectiveness of a fixed-depth sensor deployed from a buoy to estimate water-column cyanobacterial biomass depends on wind speed
[J].
Remote sensing of cyanobacterial blooms in inland waters: Present knowledge and future challenges
[J].Timely monitoring, detection and quantification of cyanobacterial blooms are especially important for controlling public health risks and understanding aquatic ecosystem dynamics. Due to the advantages of simultaneous data acquisition over large geographical areas and high temporal coverage, remote sensing strongly facilitates cyanobacterial bloom monitoring in inland waters. We provide a comprehensive review regarding cyanobacterial bloom remote sensing in inland waters including cyanobacterial optical characteristics, operational remote sensing algorithms of chlorophyll, phycocyanin and cyanobacterial bloom areas, and satellite imaging applications. We conclude that there have many significant progresses in the remote sensing algorithm of cyanobacterial pigments over the past 30 years. The band ratio algorithms in the red and near-infrared (NIR) spectral regions have great potential for the remote estimation of chlorophyll a in eutrophic and hypereutrophic inland waters, and the floating algae index (FAI) is the most widely used spectral index for detecting dense cyanobacterial blooms. Landsat, MODIS (Moderate Resolution Imaging Spectroradiometer) and MERIS (MEdium Resolution Imaging Spectrometer) are the most widely used products for monitoring the spatial and temporal dynamics of cyanobacteria in inland waters due to the appropriate temporal, spatial and spectral resolutions. Future work should primarily focus on the development of universal algorithms, remote retrievals of cyanobacterial blooms in oligotrophic waters, and the algorithm applicability to mapping phycocyanin at a large spatial-temporal scale. The applications of satellite images will greatly improve our understanding of the driving mechanism of cyanobacterial blooms by combining numerical and ecosystem dynamics models.Copyright © 2019 Science China Press. Published by Elsevier B.V. All rights reserved.
湖泊蓝藻天地一体化监测业务化运行平台的构建——以滇池流域为例
[J].
Operational platform construction of heaven and earth integration algae monitoring in Lake Dianchi
[J].
巢湖蓝藻水华监测预警与模拟分析平台设计与实践
[J].
Design and practice of a platform for monitoring, early-warning and simulation of algal blooms in Lake Chaohu
[J].
湖泊遥感研究进展与展望
[J].
Review of lake remote sensing research
[J].
利用陆基高光谱遥感捕捉太湖蓝藻水华日内快速变化过程
[J].
Capturing the rapid intra-day change of cyanobacteria bloom by land-based hyperspectral remote sensing in Lake Taihu
[J].
太湖蓝藻水华暴发程度年度预测
[J].
Annual forecast of the extent of cyanobacteria bloom in Taihu Lake
[J].
三种机器学习模型在太湖藻华面积预测中的应用
[J].
Area prediction of cyanobacterial blooms based on three machine learning methods in Taihu Lake
[J].
基于多源遥感数据的巢湖水华长时序时空变化(2009—2018年)分析与发生概率预测
[J].
Long-term spatiotemporal variation analysis and probability prediction of algal blooms in Lake Chaohu (2009-2018) based on multi- source remote sensing data
[J].
基于遥感藻总量和气象因子的巢湖不同湖区藻华预测
[J].
Predicting algal blooms in different zones of Lake Chaohu based on satellite-derived algal biomass and meteorological factors
[J].DOI:10.18307/2022.0404 URL [本文引用: 2]
Monitoring cyanobacteria bloom in Dianchi Lake based on ground-based multispectral remote-sensing imaging: Preliminary results
[J].
基于无人机高光谱遥感在太湖蓝藻水华监测中的一次应用
[J].
An application of UAV-based hyperspectral remote sensing in monitoring cyanobacterial bloom in Taihu Lake
[J].
High-performance solutions of geographically weighted regression in R
[J].
Evaluation of water quality based on UAV images and the IMP-MPP algorithm
[J].
基于高分六号数据提取太湖蓝藻方法的对比及适用性分析
[J].
Comparison and applicability analysis of methods for extracting cyanobacteria from Lake Taihu based on GF-6 data
[J].
TRMM降水数据在长江流域的降尺度分析与校正
[J].
Research on downscaling and correction of TRMM cata in the Yangtze River Basin
[J].
基于无人机可见光影像与OBIA-RF算法的城市不透水面提取
[J].
Extraction of urban impervious surface based on the visible images of UAV and OBIA-RF algorithm
[J].
高分一号WFV影像的深圳市水库CODMn浓度时空分布特征
[J].
Study of spatial—Temporal characteristics for CODMn in Shenzhen Reservoir based on GF-1 WFV
[J].
基于梯度提升决策树算法的鄱阳湖水环境参数遥感反演
[J].
Remote sensing retrieval of water quality parameters in Poyang Lake based on the Gradient Boosting Decision Tree algorithm
[J].
Landsat7 ETM+ SLC-OFF数据的修复及其在武汉东湖水质反演中的应用
[J].
Recovering of Landsat7 ETM+ SLC-OFF data and its application on water quality retrieval in East Lake in Wuhan
[J].
基于Landsat8影像的蓝藻水华提取方法对比研究
[J].
Comparative research of cyanobacteria blooms extraction methods based on Landsat8 images
[J].
基于多源卫星的滇池藻华提取机器学习算法研究
[J].
DOI:10.11867/j.issn.1001-8166.2022.064
[本文引用: 1]

富营养化导致的藻类水华暴发,严重影响湖泊生态系统健康和居民用水安全。目前,常用于藻华监测的MODIS等卫星数据,受限于较低的空间分辨率,难以满足中小型湖泊水体的细粒度监测需求;而Landsat等常用的中高空间分辨率卫星数据因重返周期较长,无法满足藻华高频监测的需求。以滇池为研究区,联合国内外6种常用中高分辨率卫星影像,包括高分一号卫星、高分六号卫星、HJ1A/B、HY1C、Landsat 8和哨兵2号,分别使用神经网络模型、随机森林模型和极端梯度提升树模型3种机器学习算法以及归一化植被指数法提取滇池藻华,并对提取精度进行对比分析和一致性评估。结果如下:①3种机器学习算法中随机森林模型藻华提取精度最高(准确率91.94%,F1指数91.91%,召回率91.52%,精确率92.30%,Kappa系数0.838 8),极端梯度提升树模型和神经网络模型次之;②同一天多源卫星数据藻华提取结果一致性较高,平均相对误差小于8.04%;③2019年滇池藻华暴发频率较高,主要以轻度藻华和中度藻华为主,整体暴发格局呈现“北重南轻”。研究表明,利用中高分辨率遥感数据联合监测藻华是一种有效手段,能够在保证空间分辨率的同时提升时间分辨率。同时,建议在多云雨地区和中小型水体藻华监测中推广多源卫星联合观测。
Extraction of algal blooms in Dianchi Lake based on multi-source satellites using machine learning algorithms
[J].Algal blooms caused by lake eutrophication severely affect ecosystem diversity and water security. Satellite data with low spatial resolution such as MODIS is limited to the monitoring of large lakes. However, single medium or high spatial resolution data sources such as Landsat-8 cannot meet the high-frequency monitoring requirements of algal blooms in practice, owing to the relatively longer revisiting period. This study, taking Dianchi Lake in 2019 as an example, combined six medium- or high-spatial-resolution satellite images to monitor variations in algal blooms. Three machine learning algorithms [Random Forest (RF), Extreme Gradient Boosting Tree (XGBoost), Artificial Neural Network (ANN), and Normalized Difference Vegetation Index (NDVI)] were tested in the study. The model accuracy was compared and analyzed using the visually interpreted ground truth. The results show that: ① the RF model applied to Dianchi Lake had the highest accuracy (91.94% accuracy, 91.91% F1 score, 91.52% recall, 92.30% precision, Kappa 0.838 8), followed by the XGBoost and ANN models; ② the identification results derived from multi-source satellite data on the same day were highly consistent, and the average Relative Error (RE) was less than 8.04%; and ③ algal blooms occurred in Dianchi Lake with a high frequency in 2019, mainly in the form of mild and moderate algal blooms. Overall, the spatial distribution presented a “heavy in the north and light in the south” pattern. The results reveal that combining multiple medium- to high-resolution remote-sensing data sources is an effective approach for monitoring cyanobacterial blooms. This approach can enhance temporal resolution and ensure spatial resolution. However, promoting multi-source satellite joint observations in the monitoring of algal blooms in cloudy and rainy areas and small to medium-sized water bodies is recommended.
太湖流域水文连通性:现状、研究进展与未来挑战
[J].
Hydrological connectivity research in Lake Taihu Basin: Status, progress and future chal-lenges
[J].
Effects of daily nitrogen and phosphorus input on planktonic community metabolism in a semi-enclosed bay by mesocosm experiment
[J].
