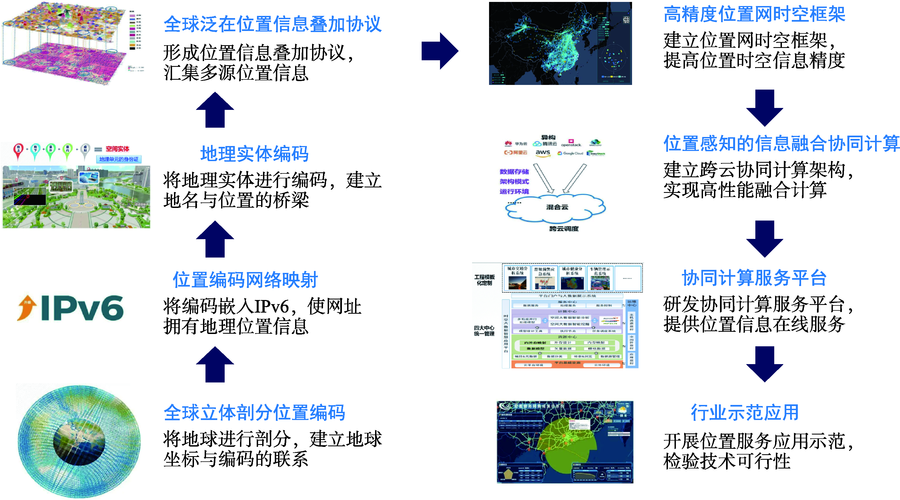
With the rapid development of information technology, the world has entered an era of explosive growth of information, the Internet, the Internet of Things, and sensor networks have flooded with massive amounts of human society related information, providing us with a new way to solve urban governance and social management issues. The biggest challenge to further improve the ability of urban smart management is that information cannot be integrated and shared quickly and effectively. Therefore, the global location information superposition protocol and location-based service network technology have been proposed, based on the location-based fact of most social information, which become a key technology to break the barriers between systems in various fields, and to make the automatic collection, integration of computing, and intelligent services of massive heterogeneous information across networks, platforms, systems, and languages come true. This paper summarizes the current domestic and foreign research progress on the key technologies of the global location information superposition protocol and location-based service network, and then introduces the demonstration application of the global location-based service network. Finally, the technology and application of the global location-based service network on the future research directions are discussed, which can be the reference for the development of the global location-based service network in the future.
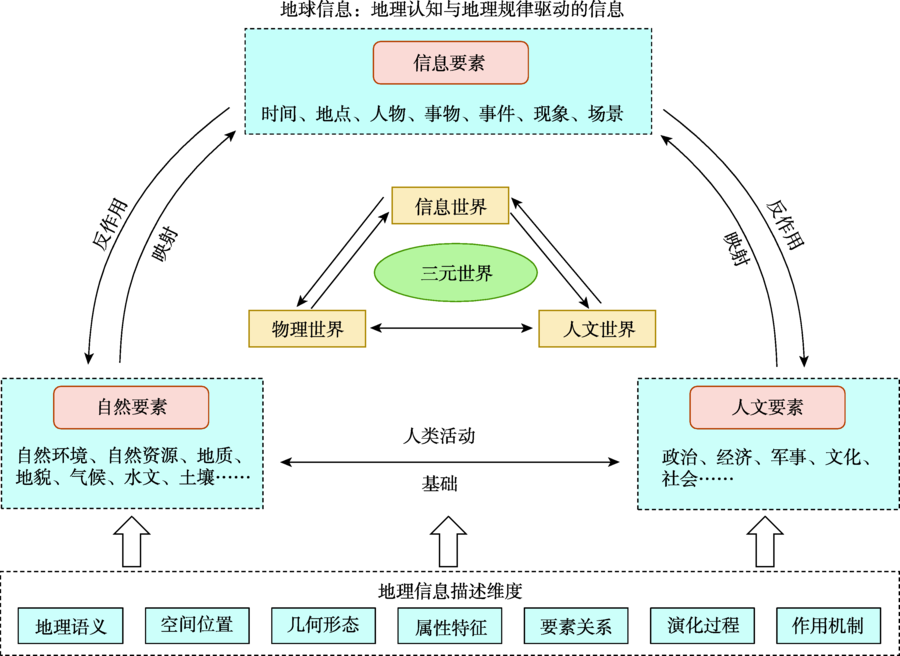
Geography is a comprehensive discipline that studies the spatial-temporal pattern, evolution process, and interaction mechanism of various geographic elements. With the evolution of the real world from binary space to the ternary world, it is urgent to deepen and expand the understanding, expression, and mining of geographic information connotation. The existing geographic information expression model of "location + geometry + attributes" is difficult to support the expression of various geographic elements and their laws. From the perspective of geography, based on the concept of the ternary world, we sort out the information elements and the process of their transformation into geographical information and form an information expression system with the "seven elements" of time, place, character, object, event, phenomenon, and scene, and from the geography "seven dimensions" perspective of semantic, spatial location, geometric structure, attribute, interrelationship, evolution process, mechanism of effect to interpret. It realizes the all-around classification and description of the connotation of geographic information from the perspective of geography and provides theoretical support for the multidimensional description and computational analysis of geographic information for comprehensive and integrated research in geography.
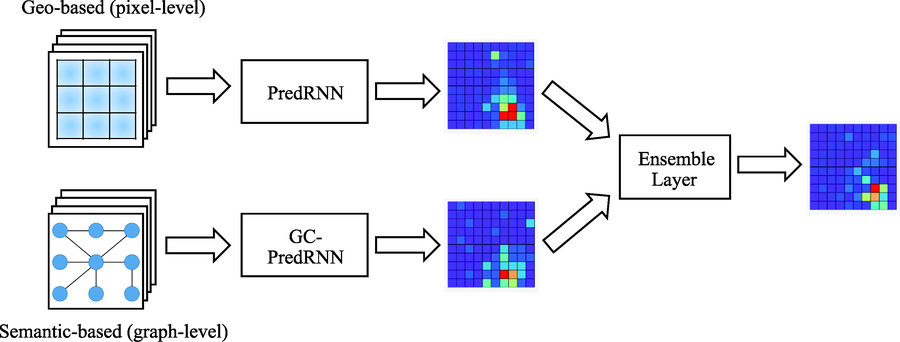
Urban hotspots prediction is a basic but significant task for future urban management. Accurate urban hotspots prediction can improve the efficiency of urban planning and security construction. Existing deep learning methods mainly adopt geographic grid maps, provided urban network, or external data to capture spatiotemporal dynamics. However, we observe that mining some latent self-semantics from raw data and fusing them with geospatial based grid images can also improve the performance of spatiotemporal predictions. In this paper, we propose Geographic-Semantic Ensemble Neural Network (GSEN), a novel deep learning approach, to stack geographical prediction neural network and semantical prediction neutral network. GSEN model integrates the structures of Predictive Recurrent Neural Network (PredRNN), Graph Convolutional Predictive Recurrent Neural Network (GC-PredRNN), and Ensemble Layer to capture spatiotemporal dynamics from different views. Furthermore, this model can also be correlated with some latent high-level dynamics in the real-world without any external data. We evaluate our proposed model on three different real-world datasets. The experimental results demonstrate the generalization and effectiveness of GSEN in different urban hotspots spatiotemporal prediction tasks.
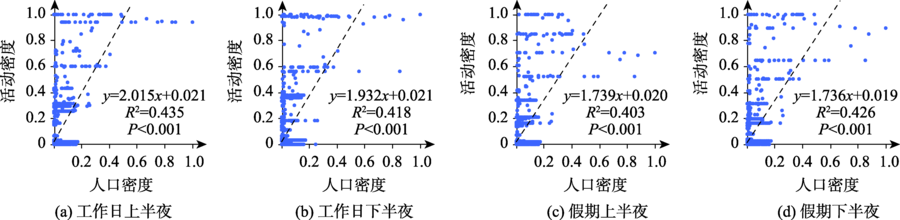
Night-time economy refers to the related economic activities mainly in the services taking place in urban space and at night, which is an important representation of a city's economic development and consumption level. Currently, researchers at home and abroad mostly rest on the theoretical level, or small-scale refined research based on market research and questionnaire survey, lacking in-depth mining using models and mathematical statistics methods, and rarely intuitively show the specific temporal and spatial distribution of large-scale night-time economy. With the development of information technology, night lighting data and perception big data provide new data sources for quantitative research of night-time economy. This paper provides a new perspective for night-time economy by fusing multi-source data. Compared with the traditional survey data, it is more rapid, efficient, and extensive, which is suitable for large-scale research of night-time economy. Based on taxi OD flow, this paper uses spatial clustering algorithms such as DBSCAN and K-Means ++ to identify hot areas of night-time activities in Xiamen City from the perspective of consumers. Based on the night-time lighting image and POI, this paper analyzes the supply and demand relationship by the method of profit and loss and identifies the distribution area of night service facilities from the perspective of merchants. Then we analyze the temporal and spatial distribution pattern of night-time economy in Xiamen City. The results show that: ① The spatial distribution of night activities in Xiamen City is multi ring and decreases to the surrounding areas. The distribution of hot spots of night activities varies from place to place; ② The existing service facilities in some areas of Xiamen City fail to serve the night economy well, and the existing lighting infrastructure, such as lighting and nightscape, is insufficient; ③ There is a moderate positive correlation between residential population density and night activity density, and the results are valid. The profit and loss value and quantity of night service facilities, night lighting, and night activity density are moderately and weakly correlated, and catering facilities are more dependent on night lighting. Finally, we put forward some suggestions for Xiamen's future night-time economic construction, such as providing different night-time services according to different consumer groups and psychology, strengthening the construction of night light infrastructure and market support. The research conclusions are of positive significance to promote social employment, and enhance the utilization rate of infrastructure. At the same time, they can also provide reference for urban economic development and policy formulation.
As the most typical public facility, public toilets reflect the civilized level and management service level of the city and are an important window for building a civilized image of the city. Current research focuses on the accessibility and coverage of public toilets, treats public toilets as spatial points without discrimination, and ignores the heterogeneity of public toilets in different urban functional areas. How to establish a comprehensive and accurate public toilet space evaluation system and analyze the comprehensive service capabilities of public toilets in different regions is obviously insufficient in the current research, which is not conducive to the deployment of public toilets and the advancement of the equalization of basic public services. The emergence of multi-source data provides a new perspective for the research of urban public facilities. Therefore, this paper proposes a rationality evaluation method of public toilet spatial layout based on POI big data from the perspective of urban functional area. We use Term Frequency-inverse Document Frequency (TF-IDF) information weighting technology combined with Point of Interest (POI) frequency density to identify urban functional areas, and integrate OpenStreetMap (OSM) road network density and WorldPop population data to construct a population travel vitality index and evaluate public toilet services in urban functional areas. Finally, the population and spatial coverage rate and the spatial imbalance index are calculated to determine the difference between streets and towns and the rationality of the layout of public toilets in streets and towns. Based on multi-source data, this method quantitatively analyzes the rationality of the allocation of public toilets in different functional areas and explores the differentiating factors of the space allocation of public toilets. This article takes Shanghai, one of the most urbanized cities in China, as an example for calculation. The study finds that: ① The number of toilets in different urban functional areas is different. The number of planned commercial service functional areas is the largest, but the public toilets in the commercial service functional area have the highest qualifications. "Industry-Commercial service" and "Green Space-Commercial service" and other commercial service-related joint functional areas are also at a high level of qualification. This is because a lot of commercial service organizations provide public toilet services to the outside, which has improved the service capacity of public toilets in the area; ② The public functional area has the lowest qualification rate, only 10.27%, which is related to the openness of this type of attached public toilet facilities; ③ The eligibility of public toilets in Shanghai’s streets and towns is generally reasonable, with an average space coverage rate of 67.31% and an average population coverage rate of 70.72%. The imbalance index between public toilet service and travel vitality distribution in streets and towns ranges significantly from 0 to 0.76, of which 147 have an imbalance index less than 0.4, accounting for 69.34%, indicating the comparison of the space allocation of public toilets between these streets and towns is reasonable. The rationality of the allocation of public toilets decreases significantly from the downtown area of Shanghai to the southwest, southeast, and Chongming Island, while there is no obvious attenuation to the northwest, showing a good contiguous service capacity. The results show that this method fully takes into account the issue of the heterogeneity of the functional areas of public toilets and the travel vitality of the population, and the spatial analysis is more accurate and has more practical value.

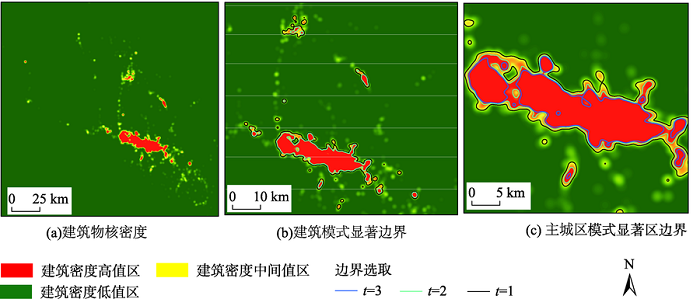
It is of profound significance in the fields of multi-scale map expression and digital mapping to recognize the architectural pattern intelligently by integrating spatial relations, geometry, semantics, and other features. Applying graph convolution neural network to intelligent recognition of building pattern can overcome the shortcomings of traditional methods, such as relying on artificial experience to set parameters and making rules too strict. However, this method often has the problem of sample proportion imbalance, which easily leads to the category with a small number of samples can not be properly identified. In this paper, the building centriod is used as the sample to cluster to obtain the building groups. Secondly, the building centriod in the same group is used as the node to construct the graph structure of the building group of Delaunay triangulation. The feature selection of the graph node can describe the area, size, direction, and other related indicators of the geometric characteristics of the building group. Thirdly, the building groups graph structure with small number of samples is enhanced by oversampling the graph structure. Then the data before and after the enhancement of the architectural group graph structure with small number of samples are input into the graph convolution neural network model for training, and the performance of the model is evaluated with several evaluation indexes such as ROC curve. The experimental results show that the recognition accuracy of the model for buildings with lesser number of samples is significantly improved after the structure of buildings with small number of samples is enhanced.
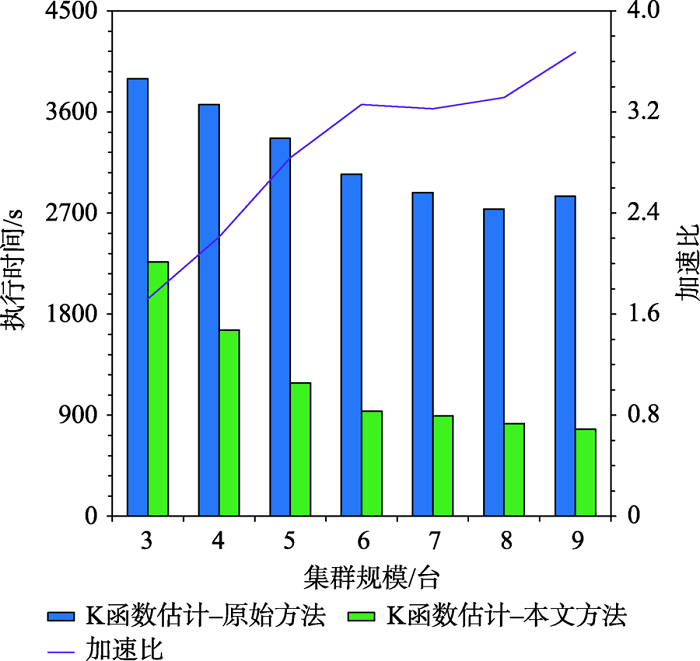
As a second-order analysis method of spatial point patterns, Ripley's K function (K function for short) uses distance as an independent variable to detect the distribution patterns of points under different spatial scales, which has been widely used in distinct fields such as ecology, economics, and geography. However, the applications of K function are limited due to the sharply increased computational cost of nested traversals on the point-pair distance measurements in both estimation and simulation phases when the point size getting larger. Therefore, the optimization of algorithm workflow and parallel acceleration have become the key technologies for tackling the performance bottleneck and computability problem of K function. Among these solutions, hash-based partitioning has been widely adopted in parallel computing frameworks for enabling data decomposition, while R-tree indexes have been proposed to reduce the computational cost of point-pair distance measurements by using spatial query instead. However, default hash-based partitioning methods ignore the spatial proximity of data distributions, while R-tree indexes fail to save query time of neighboring points under large spatial distance threshold comparing with pointwise distance calculation. In order to address these issues, this paper proposes an acceleration method for K function based on the space filling curves. Specifically, the Hilbert curve is adopted to achieve spatial partitioning, which reduces the data tilt and communication cost between partitions by better considering the spatial proximity. Upon the partition result, local indexing based on Geohash code is further developed to improve the spatial indexing strategy, which embeds spatial information in codes for achieving quick distance filtering, in turn accelerates the pointwise distance measurements. To verify the effectiveness of the proposed method, it is compared with two optimization methods adopted in previous studies, i.e., default partition without indexing, and KDB-tree partition with R-tree indexing, by analyzing the calculation time of K function for point of interests (POIs) of enterprise registration data in Hubei province, China under different data sizes, spatial distance thresholds, and computing nodes in a computing cluster. Experimental results indicate that the time cost of the proposed method is about 1/4 of that for default partition without indexing under the data scale of 300 000 points. Besides, the speedup ratio is larger than 3.6 times under 9 nodes. Therefore, the proposed method can improve performance of K function effectively in a distributed environment and has a promising scalability and could provide a reference for accelerating other spatial patterns analysis algorithms as well.
Unplanned urban sprawl has largely altered the territorial space of the planet. Fragmented natural habitats, shifting biomes, and altered nutrient cycling are a few examples of the repercussions of the uncontrolled global urban growth. Therefore, understanding the feature, mechanism, and future pathways of urban dynamics is of great importance for optimizing urban structure and morphology, and thus promoting sustainable urban development. Cellular Automata (CA) model has been recognized as an effective tool in the planner's packet to facilitate this understanding, and to help make informed decisions on urban development. Given the insufficient consideration on the process and spatial pattern of urban growth in traditional CA models, this study proposes a patch-based CA model for urban growth simulating, which is entitled AutoPa CA. The proposed AutoPaCA model couples the spatiotemporal process and pattern to simulate urban growth. It divides the urban development process into two different processes: the edge diffusion which represents organic urban growth and the leapfrog development which represents spontaneous urban growth. The AutoPaCA model introduces a parameterized self-organizing approach to fine control the location, shape, and size of newly generated urban patches. To be specific, both the organic and spontaneous patch-generation function yield new urban patches using two consecutive steps: Seeding and self-growing. The seeding procedure locates the pivot cell of new patch with a pruning and random selection operation based on the urban development suitability surface which is estimated using a random forest model. The self-growing procedure creates an urban patch with given size using a neighborhood-scanning operation in which a parameter is introduced to control the shape of the patch. The size of urban patches is assumed to follow a lognormal distribution. The shape controlling parameter is within the range of [0, 2], with values larger than 1 generating circle-like shape and values smaller than 1 generating elongated shape. In addition, the proposed model employs analysis methods in discipline of landscape ecology to scrutinize the characteristics of urban growth in historical periods, based on which a cutting-edge genetic algorithm is applied to achieve localized calibration of key parameters in the model. At the same time, the rigid limitation and elastic guiding effect of ecological protection on urban development are also considered in the simulation. The application of the AutoPaCA model in Changsha, China presented high simulation accuracy. The average value of the Reciprocal Similarity Comparison Index of 200 simulations in the model validation period reached 0.486, which attests the feasibility and applicability of the model.
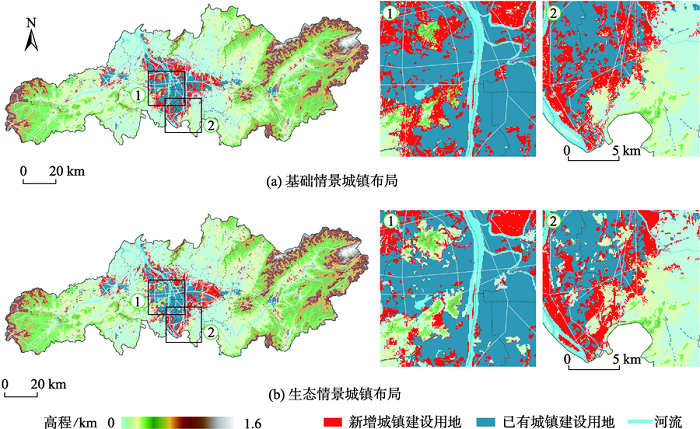
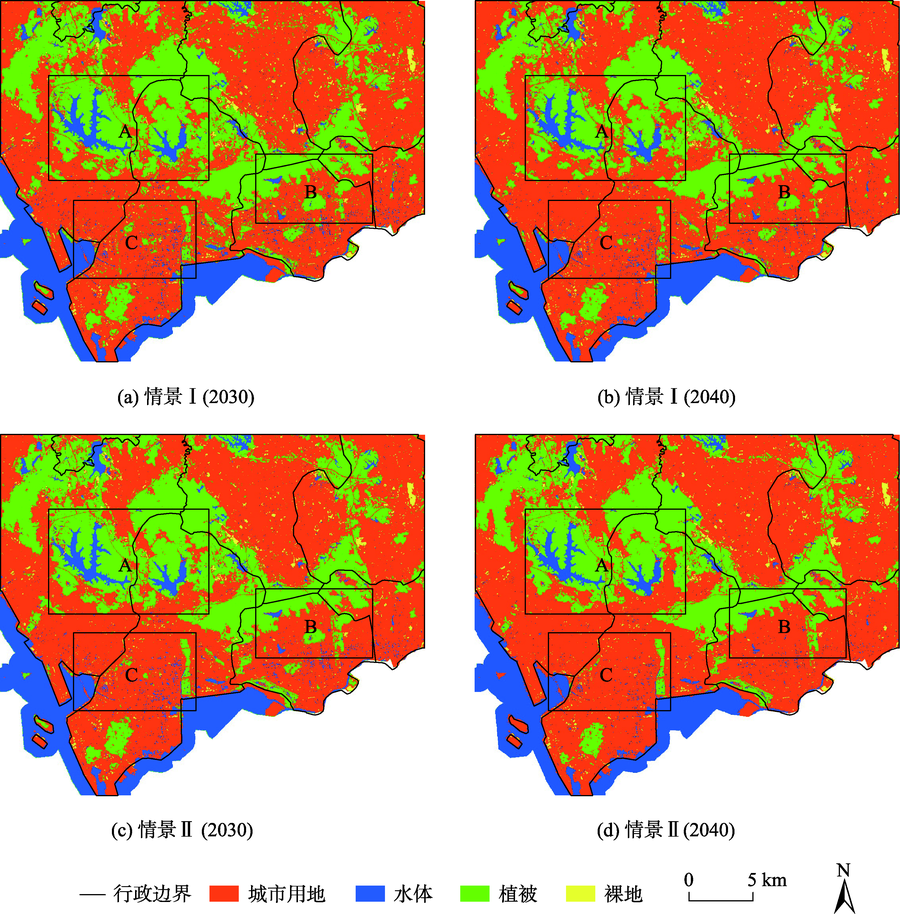
Modeling urban land use change is important for future regional planning and sustainable development. Previous FLUS-based studies are mostly based on larger grid scales. How to simulate the complex land use change processes in rapidly developing cities and explore the driving mechanisms of land use change still need further exploration. This paper constructs an urban land use pattern simulation framework coupled with FLUS and Markov and innovatively introduces house price to characterize socio-economic attributes. We take Shenzhen as the study area to simulate future urban land use spatial patterns under different development scenarios based on small grid scale (30 m) land use classification data and multi-source spatial variables such as basic geography data, road and river networks, and point-of-interest data. Finally, we analyze the land use change drivers using random forest models. The results show that the coupled FLUS and Markov method proposed in this paper has higher accuracy (FoM = 0.22) and simulate the land use change processes more accurately in rapidly developing cities, compared to traditional CA models (RFA-CA and Logistic-CA). The mapping results of multi-scenario land use patterns verify the importance of ecological control lines in the process of urban development, further illustrating the reference value of the proposed simulation framework for future urban planning layout. Hospital infrastructure, entertainment venues, and bus stop, road network density have a greater impact on urban development than natural factors (e.g., elevation, slope), while the distance to coastline limits land use change processes to some extent within Shenzhen. The model constructed in this study and the fine mapping results can provide a reference basis and theoretical foundation for related research on urban regional planning and spatial pattern simulation.
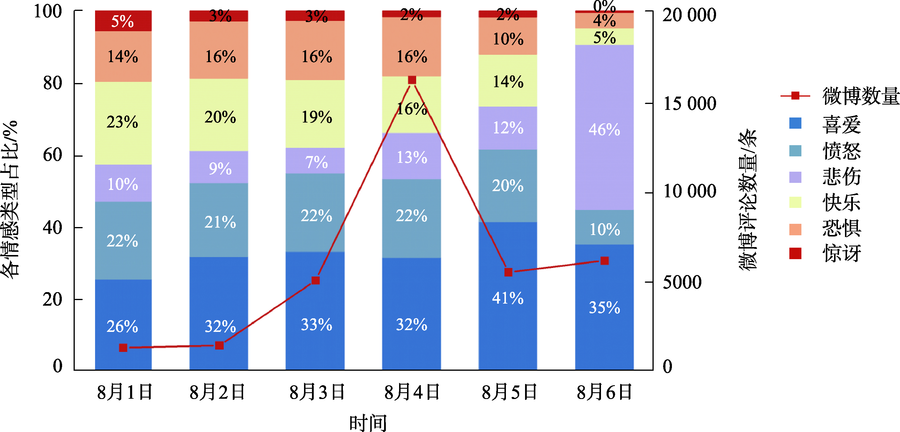
During natural disasters, public opinion guidance contributes to maintaining social stability. Social media is an important channel for the dissemination of public opinion. Understanding users' network emotions and topics of concern through microblog comments can help relevant public opinion monitoring departments master the hot spots of public concern, so as to select appropriate intervention nodes to deal with network public opinion and dredge public emotions, which is of practical significance for emergency management. Most of the existing researches use supervised machine learning methods for emotion classification, which requires manual labeling of corpus, and the workload is large. While the unsupervised methods are mainly based on the existing emotional dictionary, which can reflect the unstructured characteristics of the text and is easy to understand and explain. According to the characteristics of microblog comments, this paper constructs an emotional dictionary in the field of typhoon disaster by comprehensively considering multiple emotional sources such as emotional words and emoticons. Based on this, this paper proposes a method to calculate emotional tendency based on semantic rules of emotional words and a topic clustering method based on word vector. Firstly, this study collected a total of more than 400 000 comments on Sina Weibo during five times typhoon disasters in recent years and constructed the emotional dictionary in the field of typhoon disaster based DUTIR. We built the expression symbol dictionary combined with the Pointwise Mutual Information method. We determined the emotional tendencies according to the semantic rules, and we used 3500 comments to demonstrate the effectiveness of the proposed method. Secondly, based on the clustering method of word vector, TF-IDF, and K-means, we explored the hot topics during these disasters. Finally, taking typhoon Hagupit, the fourth typhoon in 2020, as an example, this paper conducted an analysis on more than 50 000 Weibo comments during the typhoon disaster, and identified 6 categories of typhoon-related topics. Through the spatial-temporal analysis, it was found that the number of comments on Weibo changed as time went on, and the areas with a large number of comments were also concentrated in coastal areas and areas with high economic level. On the day of typhoon Hagupit landing, the fear in Zhejiang province reached the highest level. The results show that the typhoon disaster network emotion analysis method based on semantic rules and word vector can provide assistance for government departments to master and guide network public opinion when similar disaster events occur.
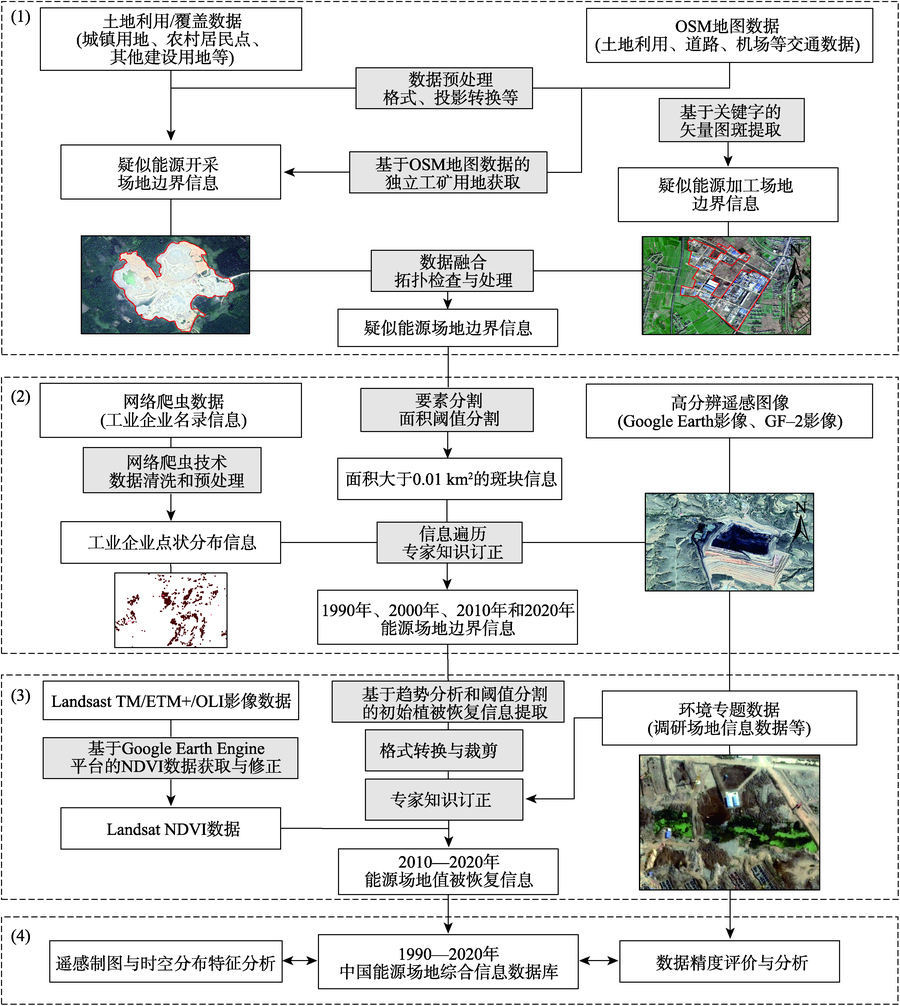
The understanding of spatio-temporal distribution of energy mining and producing sites at the national scale is still insufficient, due to the lack of effective remote sensing detection methods and high-precision data products. This study developed a new method for identifying and mapping energy mining and producing sites based on multi-source data integration and expert knowledge participation, including information from high-resolution remote sensing images, land use/cover data, web crawler data, OSM map data, and environmental thematic data. Energy mining and producing sites data as well as vegetation restoration data were produced in China for 1990, 2000, 2010, and 2020. These data products were as a part of China's land use/cover change datasets (CLUD-mining). The data products of China's energy mining and producing sites can fulfill the demands of 1:25000 mapping, with an average accuracy of 91.75%. In general, the data products have excellent quality and reliability. Results show that the construction area of China's energy mining and processing sites showed a trend of growth followed by decline. From 1990 to 2020, the area of China's energy mining and processing grew by 116.90%, from 1055.94 km2 to 2290.36 km2. From 1990 to 2010, the growth rate of the area of energy mining and processing site increased from 55.22 km2/a in 1990—2000 to 95.51 km2/a in 2000—2010, while the growth rate from 2010 to 2020 was negative, with an average annual decrease of 27.28 km2. In particular, the area of energy fields in Northwest China and Qinghai Tibet Plateau continued to grow, with a total increase of 117.42 km2. In addition, the vegetation restoration area of energy sites reached 746.76 km2 from 2010 to 2020 and mainly concentrated in North China and Southwest China, accounting for 51.41% of the total vegetation restoration area. Overall, the spatial patterns of energy mining and producing sites in China has gradually shifted from the eastern zone to the western zone. This study is of great significance in improving the understanding of the spatial-temporal distribution characteristics of energy mining and producing sites in China and can provide an important data basis for site pollution management and ecological restoration.
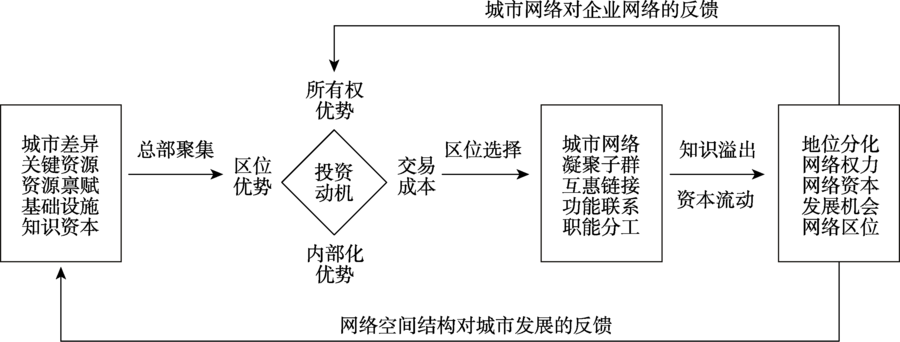
With the increase of economic interaction between cities, the spatial division of functions within firms has gradually become an important feature of production over the past 30 years. Meanwhile, the number of branches of China's top 500 manufacturing companies has expended rapidly, which develops into the production network of manufacturing industry in China. As the basic carrier of the elements flow, through the lens of manufacturing enterprises can objectively reflect the differences of cities' network position. However, the core-periphery structure of urban network based on the manufacturing corporate network has been rarely studied so far. Hence, this paper aims to analyze the core-periphery structure and its determinants of unban network for developing urban network theory and improving urbanization policy in China. First, data on headquarter and branch locations of China's top 500 manufacturing companies in 2020 are subjected to ownership linkage model to approximate the urban network, resulting a 290×290 valued urban network. Then the influence factors are examined by using 2 types of econometric models, i.e. pooled logit model and pooled probit model. Finally, according to the eclectic paradigm of international production, this paper tentatively put forward a new evolution characteristic of core-periphery structure under the network environment for further discussion. Four conclusions are drawn: (1) The number of core cities has expanded from 17 to 28, which are mainly constituted by municipalities, special economic zones, and capital cities in eastern and central regions of China. The core block is a cohesive subgroup composed of spatially dispersed but functionally connected cities, and the spatial distribution of structural holes is consistent with core cities; (2) The relationship between the core and periphery blocks has been strengthened, cities in the periphery block are mainly concentrated in central and western regions of China. However, the intercity linkages focus primarily on the core block, which leads to an unstable network structure; (3) Key resources, location conditions, and industrial structure are the key factors affecting the position of China's urban network. The improvement of human capital, knowledge base, infrastructure, and FDI will highly improve the odds of cities' membership in the core block; (4) Selecting superior actors, geographical proximity, and path dependence are the dynamic mechanisms in the evolution of core-periphery structure of China's urban network, which will further strengthen the network position of core cities. The results demonstrate that the network position of cities is closely related to their influence or power in the unban network, so China's urbanization policy need to be adjusted accordingly.
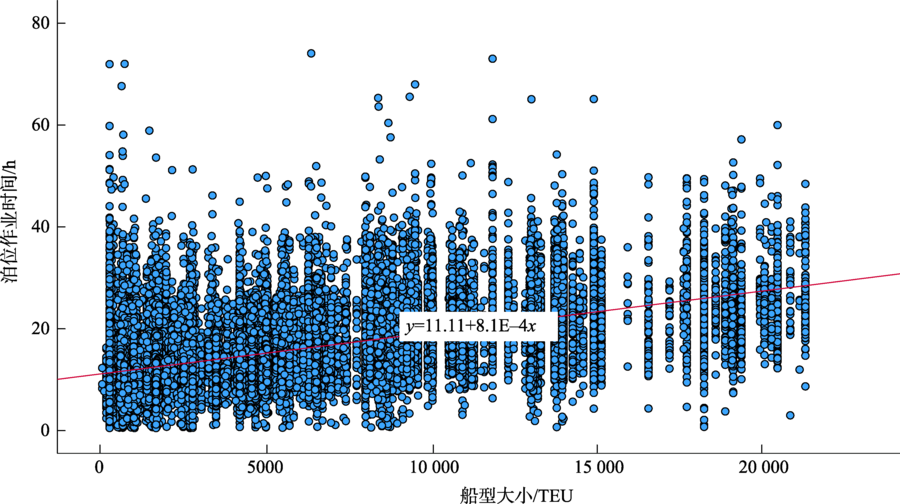
As the key node of logistics supply chain, port service plays a very important role in the flow of cargos. In this paper, we introduce a computation framework of port service efficiency based on maritime big data. We use ship AIS trajectories and port geographic information to detect the status of the ship based on the sliding window algorithm and estimate the service efficiency of container ships in port. The service efficiency of the container ports, including Shanghai, Ningbo, Shenzhen, and Busan, is evaluated based on the statistical analysis. The results of this paper show that: (1) The ship's arrival berthing time is approximately normally distributed. The average value of the normal distribution is between 14~18 h, and the ship's berthing time ranges between 10~30 h; (2) Ship berthing time is positively correlated with ship size, the berth operation time increases with larger ship sizes; (3) In Shanghai Port, nearly 32% of the ships suffered from port congestion because of waiting for berth. The service efficiency of Ningbo Port is relatively high, and there are fewer waiting incidents for ships. Busan Port also shows a higher frequency of ship arrivals; (4) The Phase IV of Yangshan Deepwater Port is an automated container terminal, having a different port handling technology from other terminals. However, its terminal service efficiency doesn't increase.
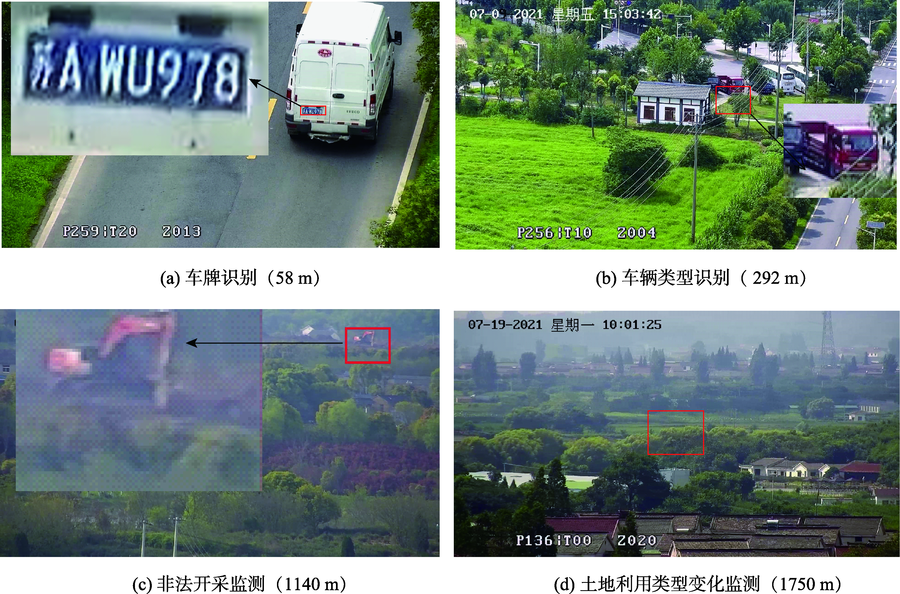
Taking the iron tower as the basic platform and using the cameras or other sensors on it to conduct near-surface observations is called tower-based remote sensing. Tower-based remote sensing is not easily affected by natural factors such as cloud occlusion and can obtain video information in real time around the clock. Tower-based remote sensing effectively fills the scale gap between aerial remote sensing and ground observation network, so it has been widely used in various fields. However, when it faces a large area of observation and complex missions, its actual application is usually constrained by the complicated terrain and the spatial resolution. How to evaluate its imaging effectiveness has become the key to the optimization of tower-based remote sensing platform in the future. This research analyzes the imaging characteristics and main occlusion factors of the tower-based remote sensing cameras and constructs its actual coverage analysis method. This research establishes a resolution grading system relying on the spatial resolution requirements of the main applications and clarifies the applicable areas of main applications based on the actual coverage and camera parameters to evaluate the availability. Taking the "smart eyes guarding the land" tower-based remote sensing video system in Jiangning district, Nanjing City as an example, the experimental analysis shows that this method can efficiently calculate the actual coverage range of the tower-based remote sensing cameras in a larger observation area and analyze the main type and proportion of obstructions. This method can clarify the actual spatial resolution of imaging in each area considering the zoom ability of the camera and evaluate the application effectiveness of the system. The existing tower-based remote sensing camera is severely blocked by the surrounding terrain and the tower itself, and the average coverage rate within 5km is only 3.20%. The tower itself causes 47.66% of the viewing angle to be blocked. The actual coverage of applications with extremely high and high resolution is better, but the rest applications’ coverage needs to be further optimized. Increasing the height of the camera, improving the zoom capability of the camera, and adding a circular track can effectively optimize the application effectiveness of the tower-based remote sensing camera. This method can provide support for future data acquisition and practical applications and be a reference for system evaluation and location optimization in the future.
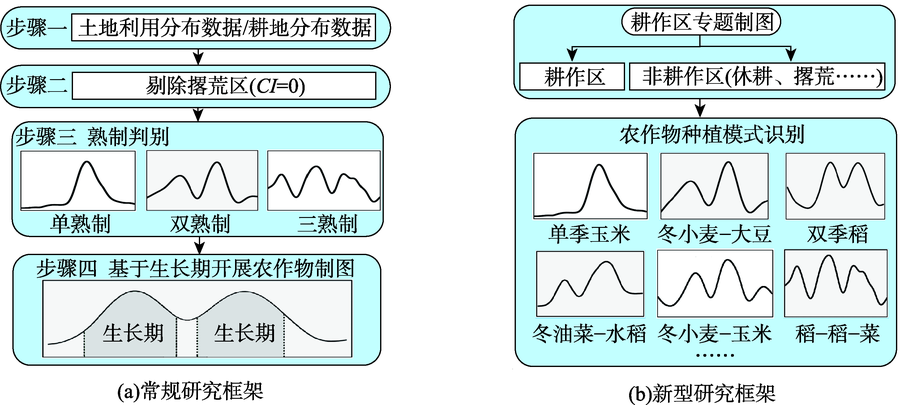
Updated spatiotemporal explicit data on cropping system is vital for ensuring the implementation of the national food security strategy and reasonable cropping structures. Time series analysis techniques are playing a more important role in agricultural remote sensing along with the continuously improved quality of remote sensing time series images. This paper analyzes main progresses and challenges in the field of cropping systems mapping using time series images from three aspects: mapping framework, remote sensing feature parameters, and data products. We find that: (1) The current cropping system mapping framework which mainly includes cropping intensity and agricultural planting structures, needs to cope with the problems of pre-requirements of cropland distribution data with high-quality. However, the existing land use/cover data could not fully fulfil this requirement due to the complex spectral characteristics of cropland introduced by multiple cropping systems over large regions. It is difficult to accurately derive information on cropping intensity using traditional time series vegetation indices datasets. Specifically, cropland fallow/abandonment in humid regions might be misclassified as single crop due to its corresponding high values of vegetation indices. Cropland abandonment and fallow are not negligible in recent decades and need further investigations, especially in China; (2) Novel multi-dimensional spectral indices based on red-edge and short-wave near-infrared bands are efficient in revealing the crop growth processes. Great progresses have been made in crop mapping in recent years. However, crop mapping at large scale is challenged by the minor differences among different crops as well as distinct heterogeneity within the same crop across different regions and multiple years; (3) There are increasing available remote sensing products of cropping intensity from national to global scale, however, the timeliness and spatiotemporal continuity need to be further improved; (4) Except for a few countries in North America and Europe, crop distribution maps at national scale are not fully available or limited to several staple crops with coarse resolution. There is a deficiency of finer datasets on cropping systems at large scale, especially in the complex multi-cropped regions. Fortunately, new technologies (i.e., cloud computing platform and deep learning algorithms) and emerging multi-sources remote sensing data with higher spatial, spectral, and temporal resolution provide great opportunities for spatiotemporally continuously detecting changes in cropping system at large scale. Future research should be focused on the following directions. First, we could improve the research strategy by developing an integrated mapping framework for directly deriving information on cropland and cropping patterns without relying on existing cropland distribution data. Second, we need to enrich the phenological features through exploring multiple-dimensional and less exploited spectral indices, such as the pigment indices, soil indices, nitrogen indices, and dry matter indices. Finally, we can develop spatiotemporal continuous change detection techniques for automatically tracking changes in cropping systems at multiple years and large scale.
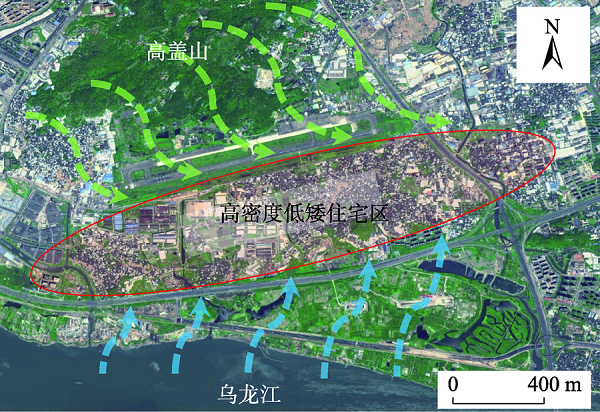
Local Climate Zones (LCZ) can effectively create the quantitative relationship between urban climate and urban spatial form and reveal the spatial variability of urban internal thermal environments. LCZ is a research method of urban thermal environment and has attracted a lot of attention at present. Therefore, this paper applies LCZ to study the spatial characteristics of urban thermal environment and its inter-/intra-zonal variability in Fuzhou City, a recently called “Stove city” in China. Furthermore, the planning strategy for the improvement of the urban thermal environment in Fuzhou is proposed. This study reveals that the main urban area in Fuzhou is dominated by compact mid- and low-rise buildings, which are distributed in a concentrated manner. In addition, the LCZ has obvious inter-zonal variability of land surface temperature (LST). Large low-rise building (LCZ 8) has the highest LST (41.56 ℃), followed by Compact low-rise (LCZ 3) and Heavy industry (LCZ 10) with LST of 40.90 ℃ and 40.39 ℃, respectively, while Dense trees (LCZ A) and Water (LCZ G) have the lowest LST with average LST of 29.94 ℃. At the same time, the intra-zonal LCZ variability also exists. We divides the main urban area into the second and third ring zones and analyzes the LST inter-zonal difference within each LCZ category. It can be found that the main LCZ building types have an inter-zonal difference between 0.5 ℃ and 1.5 ℃. The configuration of environmental factors, such as vegetation and water, buildings layout, and proximity effects, are the main causes of intra-zonal LCZ variability of LST. There is a significant negative correlation between building height and LST (r=-0.858, p<0.001). Moreover, due to the shielding of high-rise buildings from solar radiation, the building shade can partially cool the surface temperature of surrounding relatively low-rise buildings. However, the blocking effect of high-rise buildings on urban ventilation must be avoided. In the future, the contiguous, high-density, low-rise residential areas are the main areas to be controlled for their high temperature, and sufficient ventilation space should be reserved in urban planning.