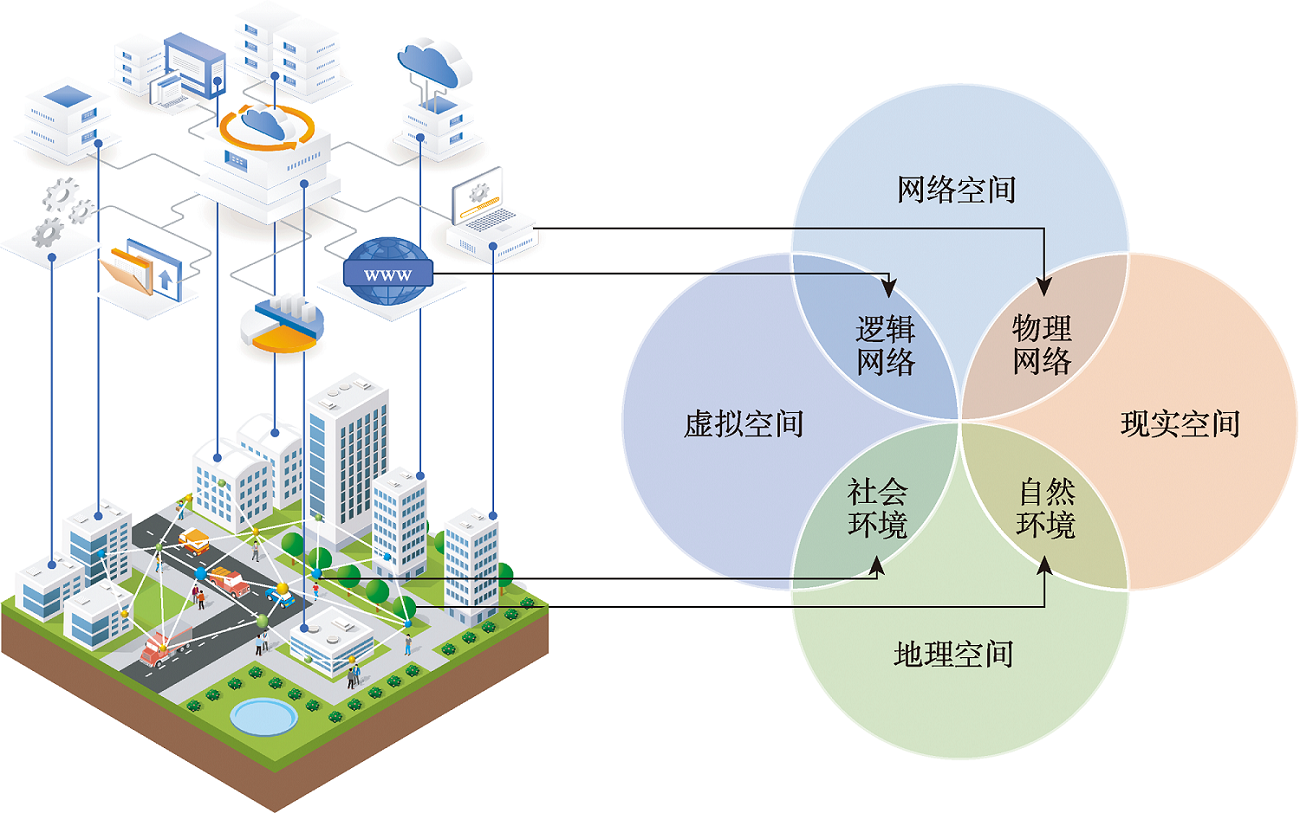
With the development of science and technology, cyberspace has been deeply integrated with people's daily lives and represents a new spatial form of human activities. The cyberspace correlates to the real world, but on the other hand it also differs from it. Cyberspace has distinct geographical characteristics, and the spatial-temporal relationship in geograph remains an indispensable element in cyberspace. Therefore, it is of great significance to apply geographical thinking to the cognition of cyberspace in order to describe the situation of cyberspace and maintain cybersecurity. In this paper, we review the emergence and development of cyberspace, analyze the basic structure and characteristics of cyberspace, and examine the geographical properties of cyberspace based on different views of cyberspace. From the perspective of the three laws of geography, this paper discusses how to use geographical thinking and Geographic Information Science (GIS) methods to describe cyberspace, and takes the visualization of cyberspace, the construction of geographic knowledge graph of cyberspace, and the intelligent analysis of cyberspace behavior as examples to illustrate how to apply geographical thinking to the analysis and research of cyberspace. Exploring the geographical properties of cyberspace and applying geographical techniques to cyberspace protection can provide new insights into the comprehensive governance of cybersecurity, thus improving the cognitive level and governance capabilities of cyberspace in the new era.
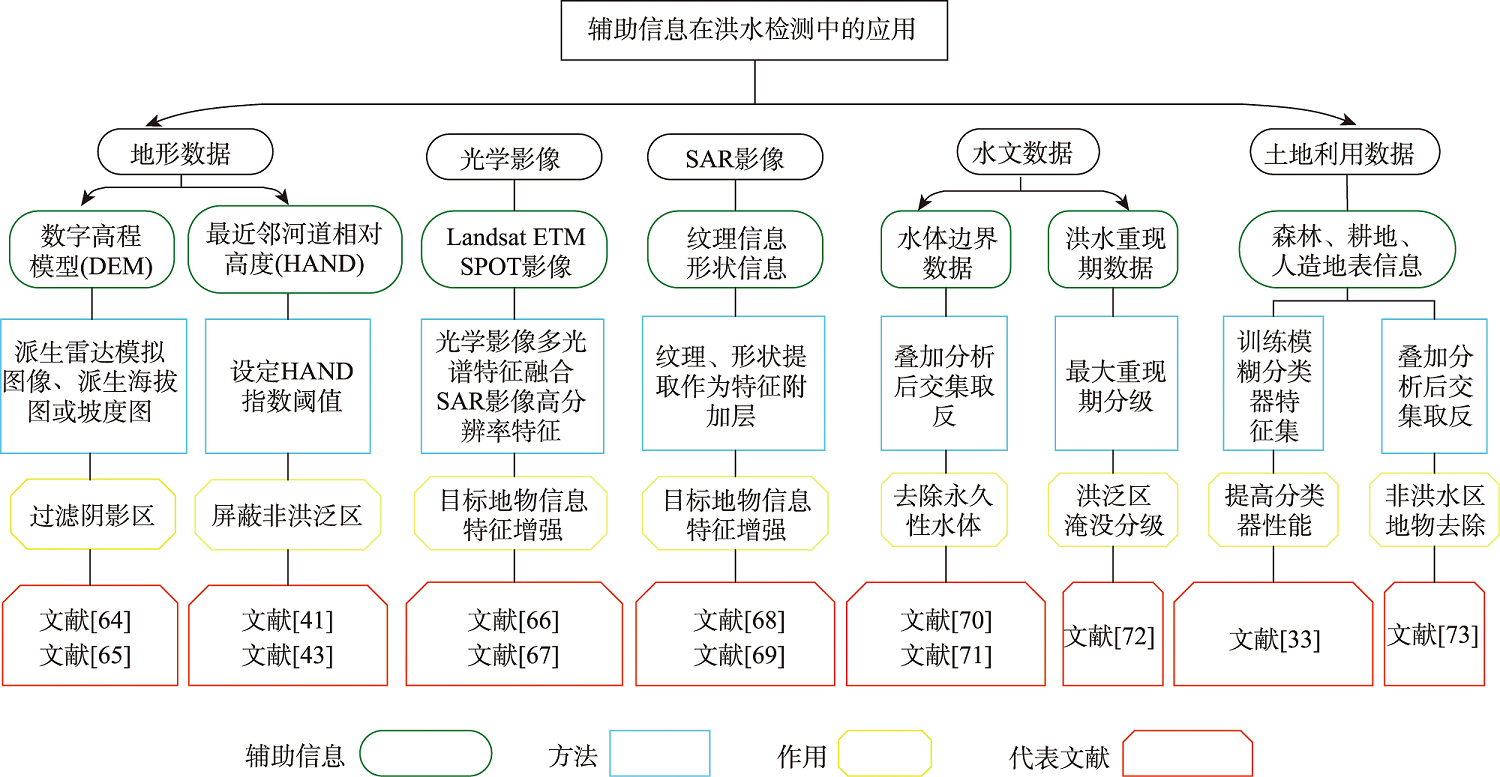
Being able to penetrate clouds and fog, Synthetic Aperture Radar (SAR) imagery has been widely used in flood mapping and flood detection regardless of time and weather condition. Improving the accuracy of flood maps retrieved from SAR images is of both scientific and practical significance. However, errors in SAR-derived flood maps can come from SAR image measuring principles, image acquisition and pre-processing system, water detection algorithms, and the remarkable temporal dynamics of the flooding process. The aim of this paper is to provide an extensive literature review of flood detection using SAR images (about 108 peer reviewed journal papers), including SAR data sources, flood detection methods, application of auxiliary information, accuracy evaluation, and challenges and opportunities for future research. Based on the articles reporting flood detection methods, it is found that the threshold segmentation methods such as the OTSU and KI algorithms are computationally fast and have been most widely used. The classification methods (e.g., the support vector machine and K-means clustering algorithms) have the flexibility to account for both subjectivity and objectivity, and the change detection method using the difference and ratio algorithms can effectively suppress over-detection and image geometric errors. Additionally, combining SAR images with four major types of auxiliary data to increase flood detection accuracy has become a hot topic in the past decades. Specifically, terrain information such as Digital Elevation Model (DEM), Height Above Nearest Drainage (HAND), and topographic slope can effectively reduce the impacts of shadows and exclude non-flooded areas. SAR image textural and multispectral optical information (e.g., Landsat data and aerial photos) can enhance the recognition ability of water features. Land cover/use data facilitate removing non-water features that are similar to water features, and hydrological data can help excluding permanent water bodies from temporary flood areas. From the perspectives of SAR image types, image preprocessing, detection algorithms, and accuracy assessment, major challenges are further discussed including insufficient understanding of the complexity of SAR backscattering information, limited progress in improving the signal-to-noise ratio during image pre-processing, lack of versatile flood detection algorithms, and low availability of high-quality verification data. While opportunities for future SAR-based flood detection research include combination of auxiliary information in detection algorithms, use of multiple rather than single threshold for water detection, and transition from deterministic toward probabilistic flood mapping.
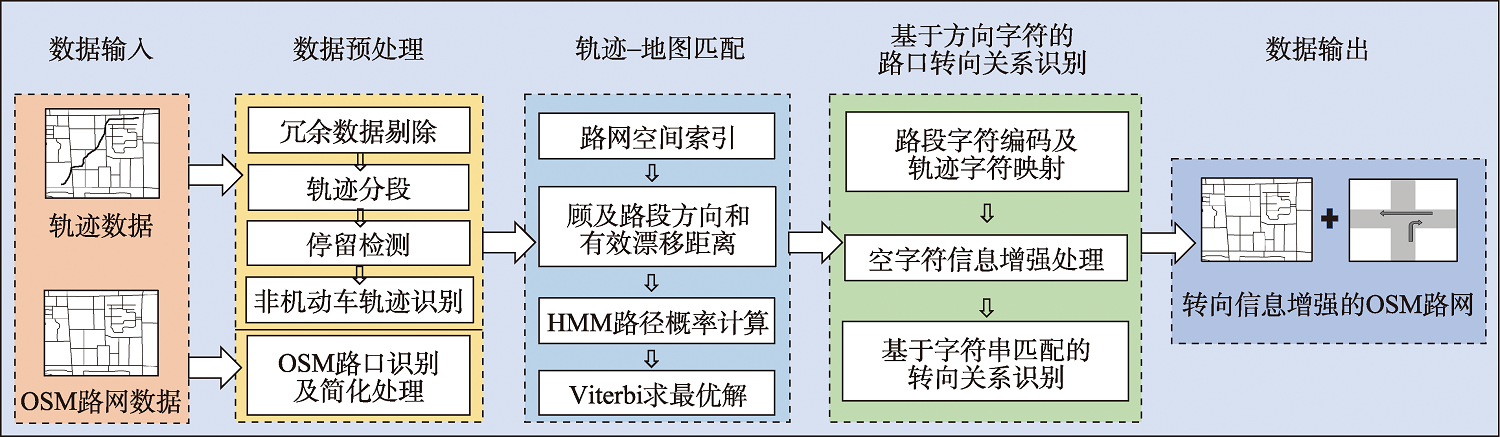
OpenStreetMap (OSM) road network is an open-source dataset that is dedicated to providing people with a globe-free digital map resource, and it has been widely used in spatial analysis and applications such as route planning and vehicle navigation services. Meanwhile, in order to regulate traffic order and reduce heavy traffic congestion, the constraints of turning rules are generally implemented at intersections in urban areas. These constraints should be respected in the applications based on OSM road network. However, OSM road network lacks turning relationships at intersections, preventing its services from route planning and vehicle navigation. For this reason, to endow OSM road network structure with turning relationships, this study presents an intersection turning detection method based on map matching and string mapping, which takes advantage of crowdsourcing GNSS trajectory data in terms of its dynamic connection information at traffic intersections. Firstly, a structure detection method for OSM intersections is designed based on a top-down quadtree splitting idea, then the intersections with different sizes and complex and various shapes are reduced to the connection points. On this basis, the improved Hidden Markov Model (HMM) map matching algorithm is introduced to project low-frequency and high-noise trajectories onto OSM road segments. This algorithm considers the direction consistency between roads and trajectories, as well as the effective drift distance between two adjacent trajectory points, can identify trajectory sequences with semantic anomalies during the driving process. Secondly, to simplify turning relationship detection, a character encoding technology facing the intersection-related road segments is presented to map the trajectories crossing through intersections to the directional strings in turning process. The information enhancement method regarding the empty characters based on optimal path analysis is further designed to enhance turning trajectory support for short road segments. This approach helps restore the driving route information for low-frequency trajectories. Finally, the different turn modes of trajectories at the target intersection are mined by directly targeting the trajectory directional strings based on a string matching method, thus this study realizes turning information enhancement for OSM intersections referencing to the "consensus knowledge" of crowdsourcing trajectories. The complicated turning relationship identification for OSM intersections is transformed into the simple string matching. The experiment based on crowdsourcing trajectory data in Shanghai shows that the proposed method can detect turning relationships for OSM intersections with a precision rate of 90%, a recall rate of over 98%, and an F1-score of over 94%.
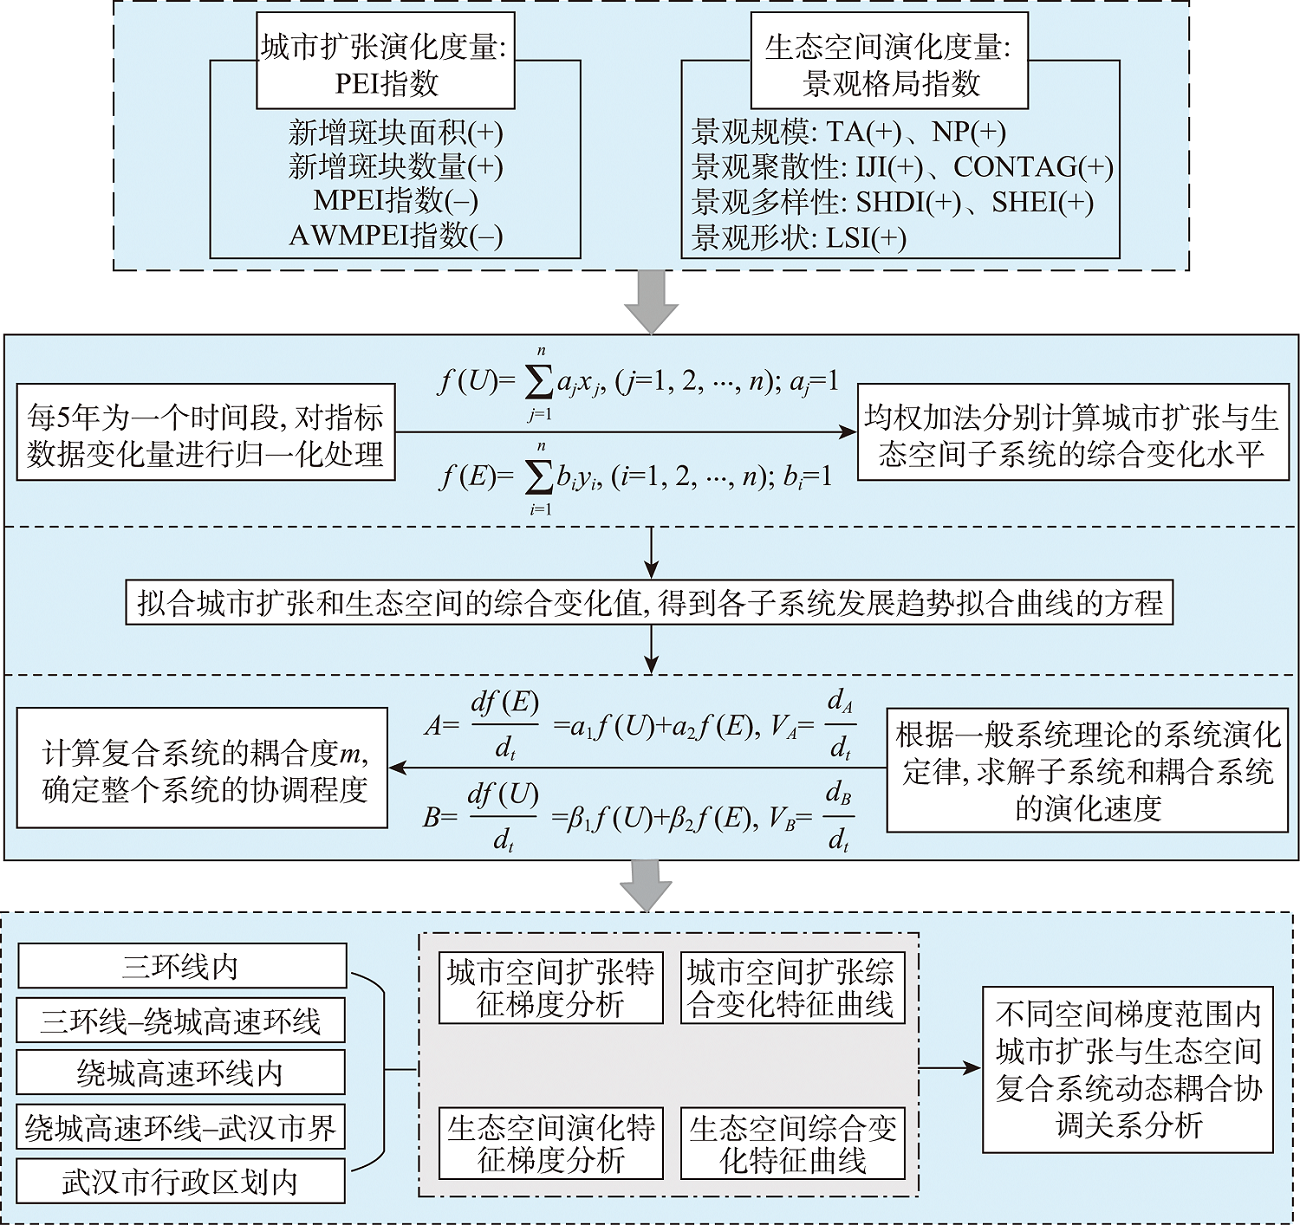
Exploring the coupling between urban development and ecological protection plays a key role in promoting the new urbanization strategy. The existing studies have largely focused on the coupling of urban system elements, structures, and functions, and the ecological environment at the macro scale, while their nonlinear dynamic relationships have been rarely explored across the spatial gradient. Here, we established a multi-criteria indicator system to quantify the urban-ecological composite system and proposed an integrated analytical framework to assess the dynamic coupling of this composite system. Taking Wuhan city as an example, we investigated the dynamic coupling between the urban expansion processes and the ecological space changes at different spatial domains (i.e., the area within the third-ring road, the area around the high-speed ring road, and the urban center) during the period of 1985-2020. The results show that the area of construction land experienced a continuous growth from 1985 to 2020 with an increasing rate from the urban center to rural areas, while the area of ecological land decreased rapidly. The urban center had a more significant decline in ecological land than other areas. With the rapid urban expansion, the coupling of the urban expansion process and ecological degradation presented a S-shaped change in the urban center area and the area around the high-speed ring road in Wuhan city, which was less obvious before 2010 and afterwards became significant. In the area of the high-speed ring road, the coupling level showed an overall increase with fluctuations, e.g., it fluctuated between the phase of highspeed development and the phase of spiral rise after 2005. For the area between the high-speed ring road and the urban center, the coupling level exhibited an approximate S shape, with a transition from a slow coordination state to the spiral-up state before 2010 and then a decline to the high-speed development state. In the urban center area, the coupling level was already at the stage of the high-speed development during the period of 2000-2005, and then fluctuated around high values. There were significant differences in the changes of coupling of urban-ecological system across spatial gradients of a city, which indicated that future urban space management and green infrastructure planning should be adapted to local conditions.
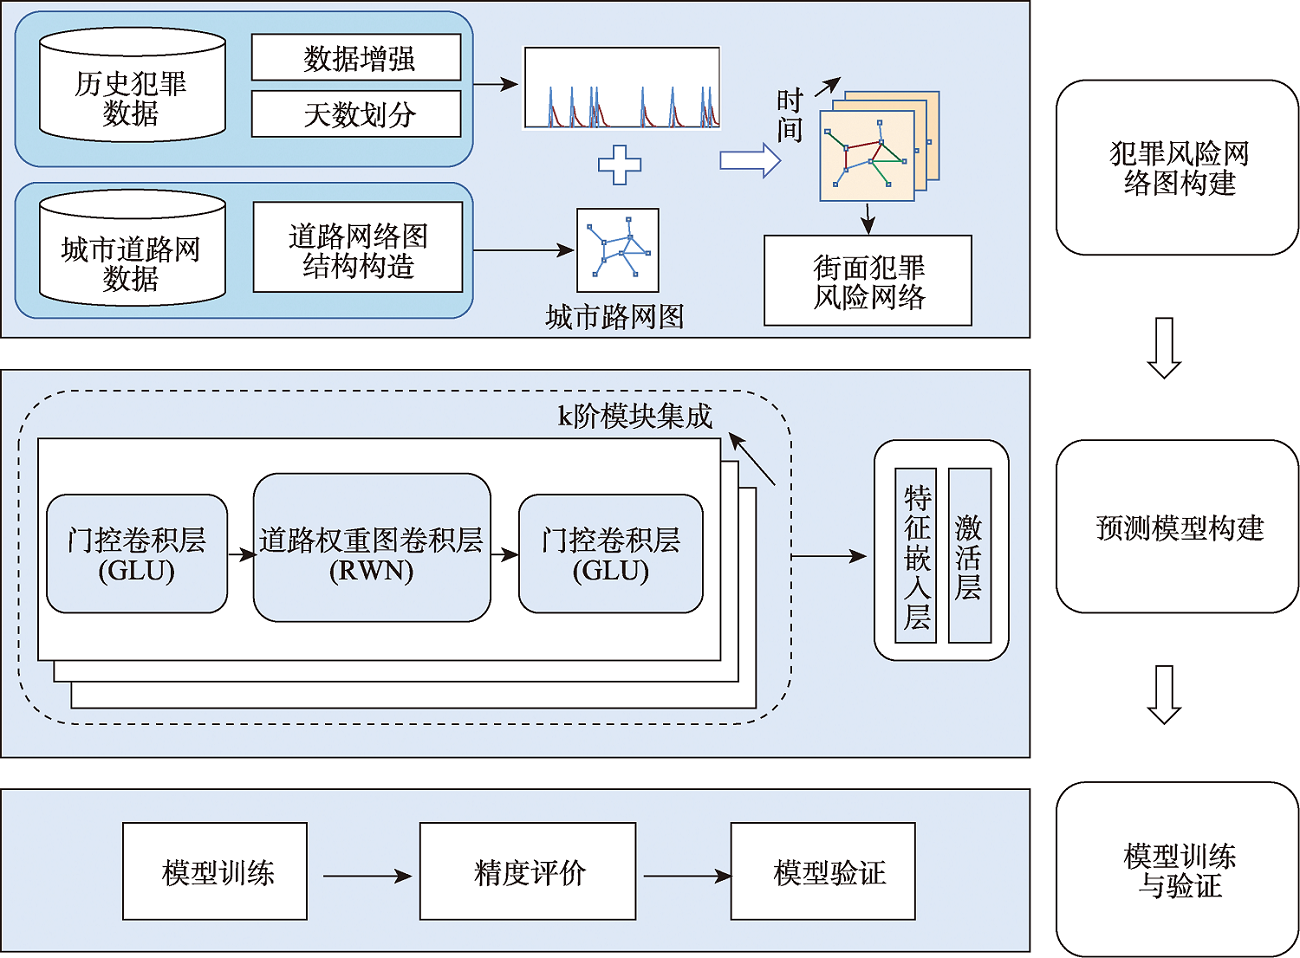
Spatiotemporal crime prediction often employs quantitative techniques such as Geographic Information Systems (GIS), geo-statistics, and big data analysis to predict the time and risk area (or location) of crime events that are more likely to occur in the future. In the era of big data, how to dynamically optimize the deployment of limited police forces and successfully improve the effectiveness of crime prevention based on data-driven crime predictions is a research focus in the field of global predictive policing. It is also a main practical direction for law enforcement agencies worldwide to implement modern proactive policing models. Traditional crime geography and spatiotemporal crime prediction methods mainly use police precincts or grids as the basic spatial analysis unit, and the analysis results are not conducive to guiding refined patrol force planning and deployment. The graph neural network based on deep learning can be combined with the topological structure of the road network at the micro scale, enabling precise crime prediction at the street scale. However, existing approaches rarely consider the impact of road weights in model prediction. In this paper, a Road Weighted Spatiotemporal Graph Convolutional Network (RW-STGCN) is constructed for street crime prediction by introducing road network accessibility and distance attenuation factors, and the model is evaluated using street theft crime data of Chicago. The results show that: (1) Compared to the spatiotemporal graph convolutional networks without considering road weights, the hit rate of the RW-STGCN increases by more than 6.5% across various road network coverage ratios (1%, 5%, 10%, and 20%), and the increase becomes more significant as the coverage ratio decreases, with a maximum increase exceeding 50%. This indicates the effectiveness and superiority of the RW-STGCN for smaller units; (2) Model ablation experiments show that the hit rate of the RW-STGCN considering road weights increases by 13.5% compared to the model result without considering road weights, and the model considering both road weights has a more significant improvement in prediction performance than the model considering only a single factor of distance attenuation weight or road network access weight, with a maximum increase of 12.9% in hit rate. This suggests that deep learning methods combined with geographic features can effectively improve the accuracy of crime prediction. The RW-STGCN is helpful for street crime prediction and can provide auxiliary decision support for law enforcement agencies to conduct scientific patrol planning and police force deployment based on road networks. In addition, it is also useful for the study of road-related urban computing problems.
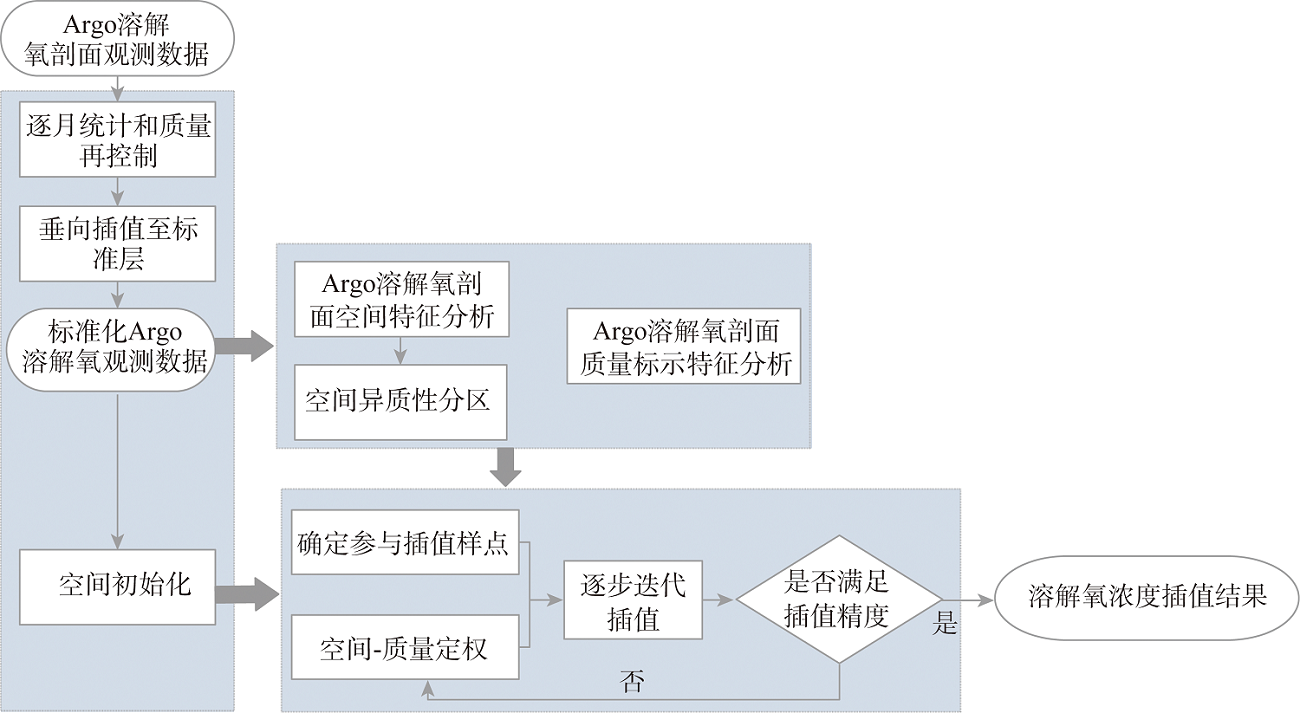
Dissolved oxygen is an important parameter for exploring various biogeochemical cycles in the ocean interior and assessing ocean health. At present, the observation method based on Argo floats has become one of the main sources to obtain the information of Marine dissolved oxygen, but the data obtained by this method are distributed discretely in space. How to use spatial interpolation method to construct discrete dissolved oxygen profiles of Argo floats into continuous spatial grid data is the focus of current research. Therefore, an iterative interpolation method (ASOSQIM) for spatial-quality characteristics of dissolved oxygen observation data using Argo floats is proposed in this paper. It is of great significance to integrate discrete Marine dissolved oxygen data to obtain spatially distributed continuous grid data for exploring and revealing the variation law of Marine dissolved oxygen concentration and providing reliable data support and information services for related fields. In view of the discrete and irregular spatial distribution of the observed sample points, ASOSQIM carries out a series of processing on the dissolved oxygen observation data using Argo floats, such as monthly statistics, quality recontrol and standardized interpolation. Based on the processed dissolved oxygen observation data, the spatial initialization was carried out, and the dissolved oxygen concentration on the regular grid after initialization was taken as the initial value of spatial interpolation calculation. Then, the dissolved oxygen observation data using Argo floats were divided into different spatial heterogeneity zones, and the corresponding weight coefficients were assigned to data of different quality flags by using the space-quality weighting method to solve the problem of the amount of data involved in interpolation and its accuracy. Finally, the idea of iterative interpolation was used to integrate the spatial partitioning characteristics and quality flags of dissolved oxygen. The spatial interpolation of dissolved oxygen concentration based on observation data of Argo floats is realized. The cross-validation method and WOA18 data were used to verify and compare ASOSQIM. The results show that: (1) the interpolation accuracy of ASOSQIM is significantly improved compared with other spatial interpolation methods. The advantages and feasibility of this method are verified by comparing with the dissolved oxygen observation results of Argo floats in 2022. (2) The dissolved oxygen concentration interpolation results obtained by ASOSQIM are highly consistent with the dissolved oxygen data of WOA18, and the absolute error of dissolved oxygen concentration accounts for more than 85% in the range of 20μmol/kg, indicating that the spatial interpolation results of dissolved oxygen concentration obtained by this method are reliable.
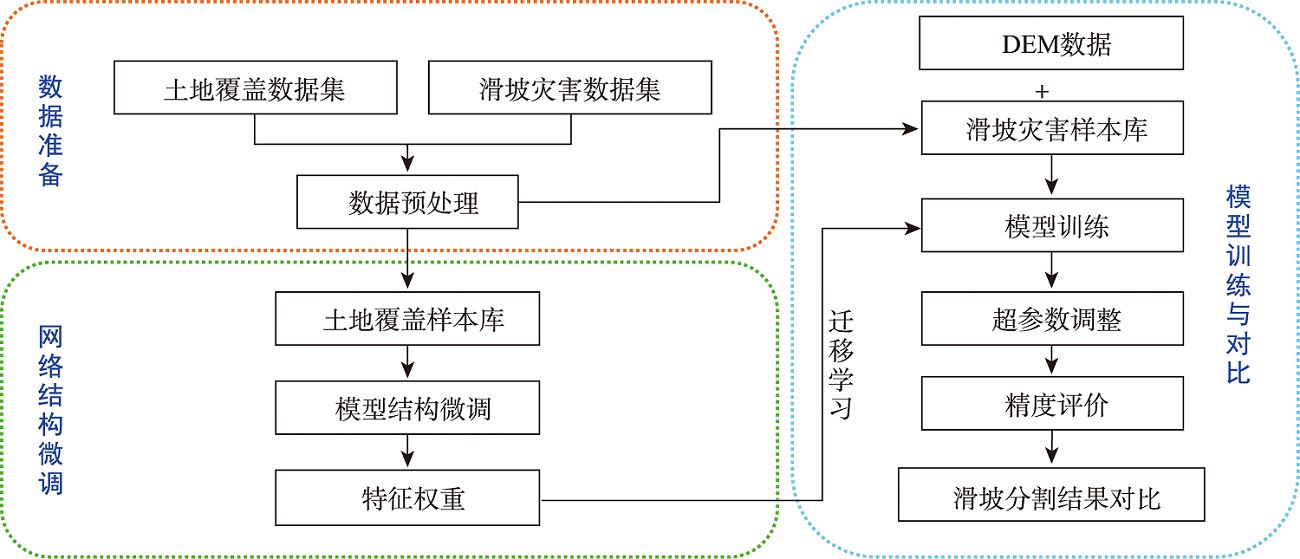
Remote sensing images contain rich semantic information and play an important role in landslide disaster monitoring. Traditional landslide recognition is mainly based on remote sensing visual interpretation and human-computer interaction recognition, which is time and labor consuming, with strong subjectivity and low extraction accuracy. Semantic segmentation, as an important task in deep learning, has played an important role in automatic recognition tasks using remote sensing images due to its end-to-end, pixel-level classification capability and has great potential in automatic recognition of landslides. The existing semantic segmentation models for landslides using remote sensing images usually lack the feature information of multi-scale ground objects, and the boundary will be blurred with the increase of network depth. In this paper, Attention combined with Encoder-Decoder Network (AED-Net) is proposed for landslide recognition. A shallow feature extraction network is used to alleviate the boundary ambiguity caused by deep neural network. Multi-scale feature extraction capability of convolution pool pyramid structure in void space is utilized. Combined with the feature restoring ability of the encoder-decoder structure, the boundary information is restored, and the channel attention mechanism is used to enhance the key feature learning ability of the model. The focal-loss function is used to alleviate the imbalance of positive and negative samples. In our study, firstly, the GID-5 data set is used to conduct comparative tests on the expansion rate setting of void convolutions and the selection of channel attention mechanism in the model to get the optimal solution. Then, the feature weight is transferred to the semantic segmentation task for landslide disaster by using transfer learning method, and the hyperparameter discussion and ablation experiment are carried out. The resulting model achieves the optimal segmentation performance on the landslide disaster data set of Bijie City, with a Pixel Accuracy (PA) of 95.58%, the Mean Pixel Accuracy (MPA) of 89.24%, and the Mean Intersection over Union (MIoU) of 82.68%. Compared with classical semantic segmentation networks such as PSP-Net, Attention U-Net, DeeplabV3+ with ECA attention mechanism, and semantic segmentation models such as PA-Fov and LandsNet for classfifying landslide disasters, the pixel accuracy of our model increases by 0.73%~1.97%. The average pixel accuracy of all categories increases by 1.0%~2.84%, and the average interaction ratio increases by 2.25%~5.11%. Moreover, the edge information of landslide image is smoother and the multi-scale landslide segmentation accuracy is better than other deep learning models, which demonstrates the effectiveness of the proposed model in semantic segmentation of landslides from remote sensing images.
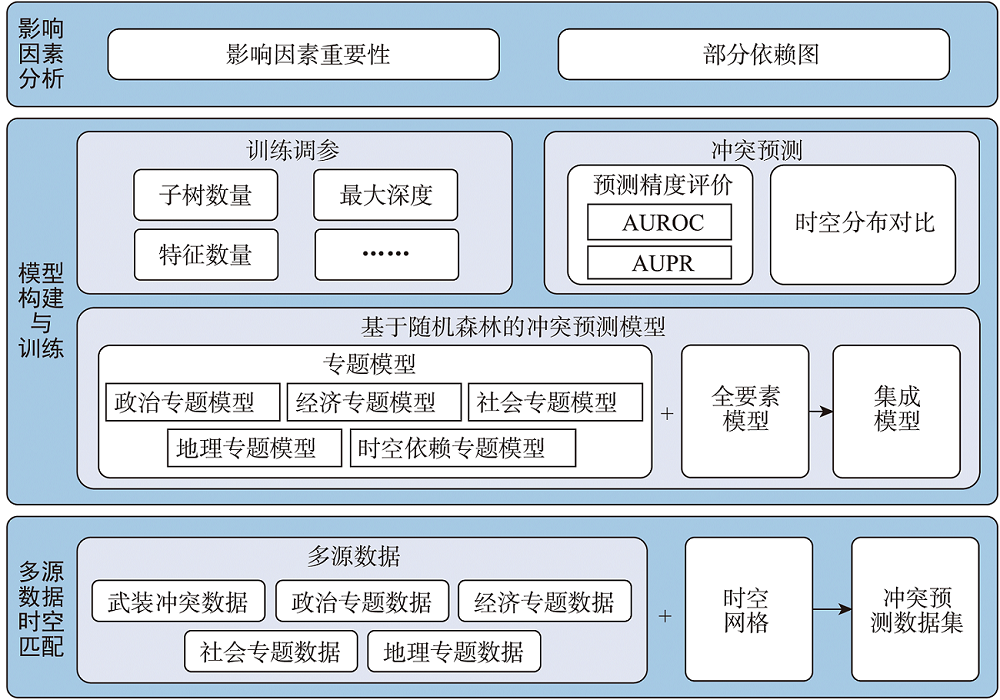
A better understanding of the threat of armed conflict in a region is essential to advance the Belt and Road Initiative and overseas investment and construction. Most existing studies have concentrated on a "country-year" level and have limited accuracy in predicting armed conflict risk at the sub-national level, because the armed conflict risk involves numerous influencing factors and many data have limited spatiotemporal accuracy. In our study, we built several models based on random forest methods for armed conflict risk prediction by integrating multi-source armed conflict data with political, economic, social, and geographic thematic information into a unified spatiotemporal framework at "grid-month" scale. Taking the Indochinese Peninsula as an example, we compared the prediction accuracy of each thematic model and the integrated model for armed conflict risk. Then we compared the prediction results against the actual spatiotemporal distribution of armed conflicts, and the weights of each influencing factor were calculated and analyzed. The results show that: (1) compared to the traditional logistic regression model's performance, the accuracy, area under the ROC curve, and area under the PR curve of the integrated random forest model increased by 0.017 7, 0.436 2, and 0.171 2, respectively; (2) the political, economic, and social factors had a significant impact on the risk of armed conflict in the Indochina Peninsula, while geographic factors were less important. However, as the risk level changes, the degree of influence of these factors also changed; (3) the model prediction accuracy of armed conflict risk can be greatly increased by taking into account the spatiotemporal dependence of conflicts, which was supported by the underlying thematic data; (4) the conflict results predicted at the "grid-month" scale were more precise and interpretable compared to large-scale prediction results. This study provides a reference and basis for China's overseas investment as well as local conflict risk prevention, control, and governance.
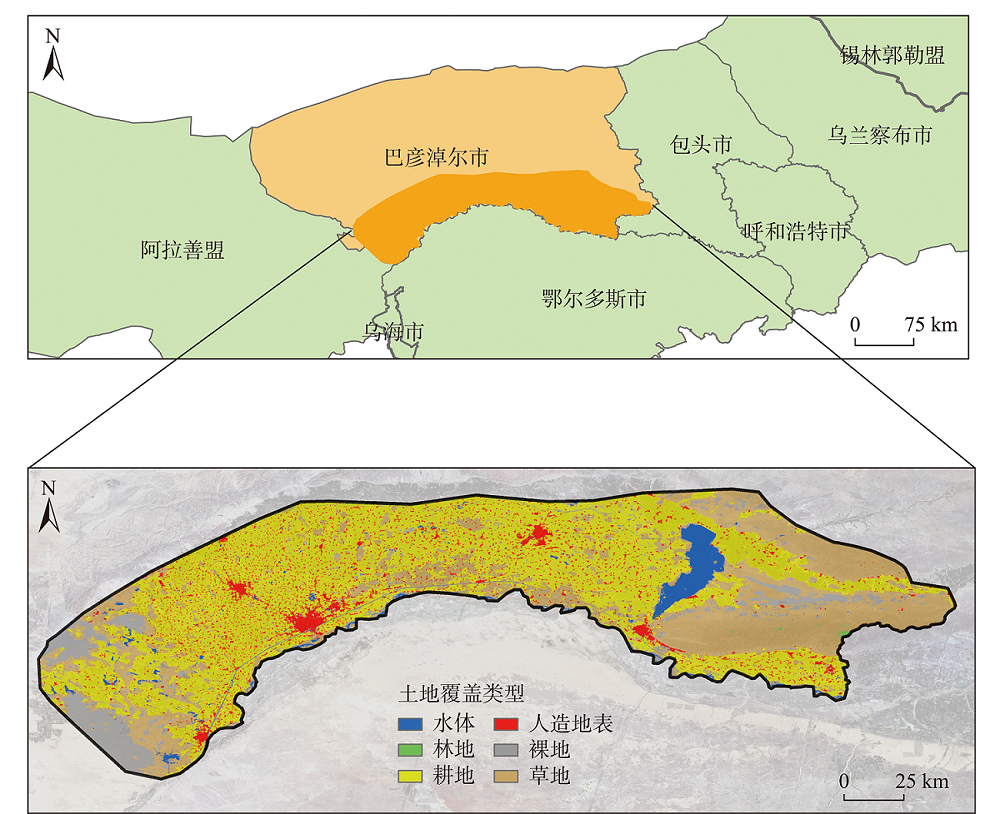
To meet the challenges posed by the "fragmented" nature of ecological governance, it is crucial to have a holistic understanding of the vulnerability of basin ecosystems and the underlying patterns of their evolution for comprehensive ecological management. The Ulansuhai Basin, serving as a pilot site for a representative ecological conservation and restoration project, has experienced a shift from traditional "lake management" to a more systemic "basin management". This study selected the Ulansuhai Basin as the study area and established a "Sensitivity-Recovery-Pressure" index system for ecological vulnerability assessment. Using the Google Earth Engine cloud platform, methods including Mann-Kendall test, Sen+Mann-Kendall trend analysis, and transformation trajectory were applied to analyse the spatiotemporal evolution of ecological vulnerability in the Ulansuhai Basin from 2000 to 2020. Moreover, geographical detectors were utilized to further investigate the causes of ecological vulnerability in the Ulansuhai Basin, and to identify the primary driving factors. The results indicated that the ecological vulnerability of the Ulansuhai Basin exhibited a “low in the middle, high on both sides” pattern, e.g., the western region of the Ulan Buh Desert and the eastern Ula Mountain region had relatively higher ecological vulnerability, while the central Hetao irrigation area had lower ecological vulnerability. From 2000 to 2020, the basin’s ecological vulnerability grading index increased from 2.44 to 2.59, indicating a slight decline in ecological vulnerability. Abrupt changes of vulnerability were observed in 2000, 2009, 2013, 2017, and 2020, with approximately 59.82% of the basin area maintaining stable ecological vulnerability grades throughout the assessment period. The transformation trajectory method showed that the decline of vulnerability peaked in 2013 and then began to slow after 2017. Additionally, surface aridity was identified as a key driving factor of ecological vulnerability in the Ulansuhai Basin, and the interaction of multiple factors showed a stronger explanatory power for ecological vulnerability than a single factor. Generally, land cover type exhibited the most significant explanatory power, followed by meteorological and economic types. This study analyzed the long-term spatiotemporal changes and causes of ecological vulnerability in basin ecosystems, providing a scientific basis for the assessment and governance of ecological conservation and restoration projects in ecologically vulnerable regions.
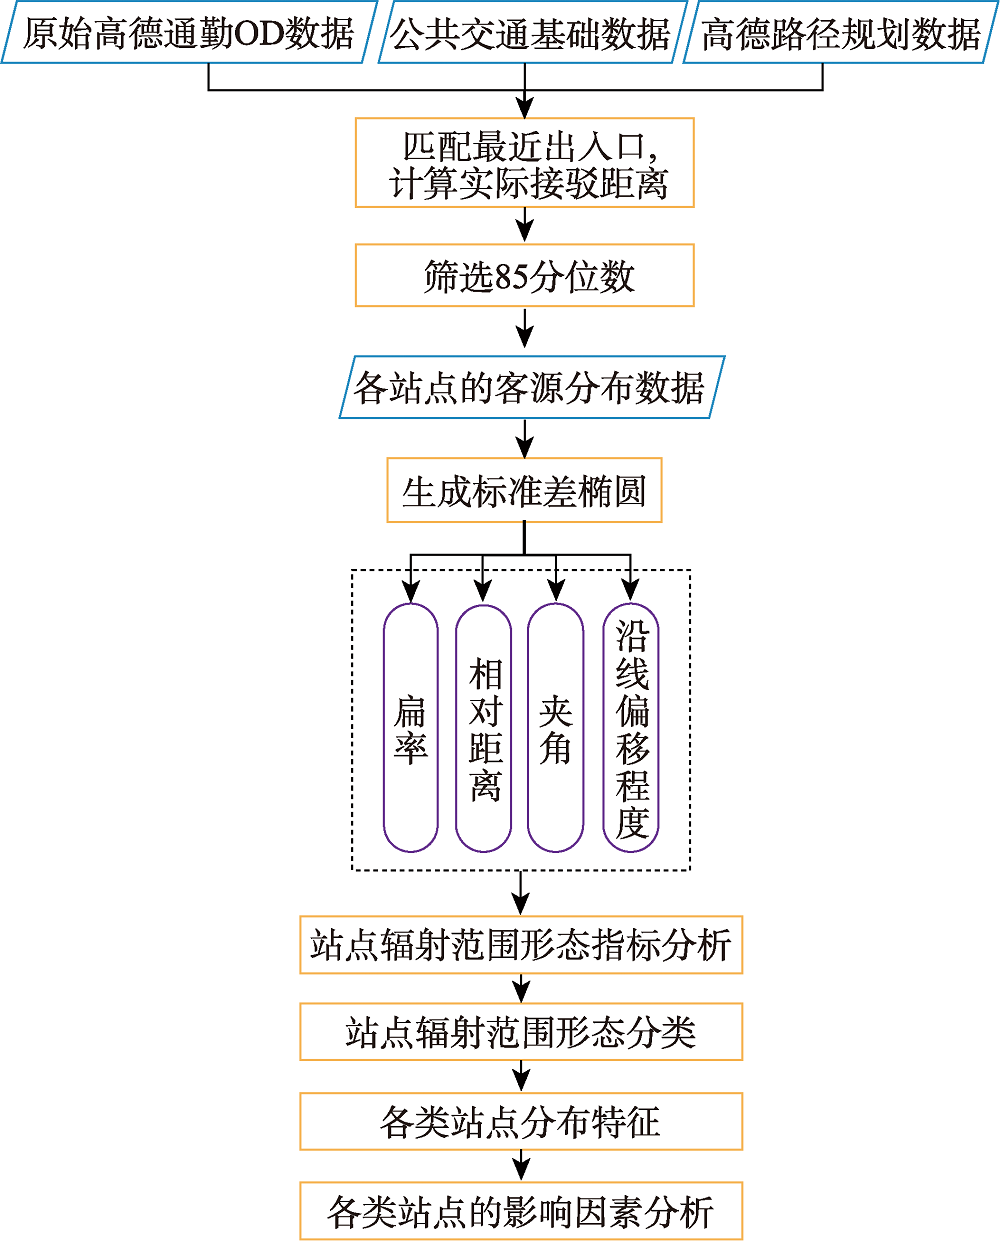
It is of great significance to study the spatial form of the catchment area of metro stations and their influencing factors for establishing a long-term interaction mechanism between rail transit and the built environment and guiding the development of land use around metro stations based on the TOD development model. In order to more accurately express the form characteristics of the catchment area of the stations, this paper takes Xiamen as an example, obtains the spatial distribution of the actual passenger flow source of each station of the metro through the Amap commuting OD data and the Amap route planning data, and uses the Standard Deviation Ellipse (SDE) method to establish the oblateness, relative distance, angle, and offset along the line to describe the form of the catchment area of each station. Based on the index system, the spatial form types of the catchment area of metro stations are summarized, and the influence mechanism of each station and the surrounding built environment, and station attributes under various form categories are revealed. The results show that: ① There are obvious differences in the eccentricity and aggregation direction of the catchment area of the metro stations inside and outside the island in Xiamen. The catchment area direction of most stations tends to be vertical to the line, and the source center tends to shift to the vertical direction of the line; ② According to the importance of the four indicators to measure the homogenization of the service scope of the station, the stations are divided into three categories: coupling service, eccentric service, and complete centrifugal service, and further divided into eight spatial forms. Among them, the coupling service stations are closest to the homogenization mode of theoretical TOD; ③ There is a certain aggregation phenomenon in the spatial distribution of various stations. The coupling service stations are mainly distributed in the west and south of the island. The eccentric service stations are mainly distributed in the north of the island and outside the island. The completely centrifugal stations are mainly distributed outside the island and in the east of the island; ④ The scale and location of factors such as land use layout and development degree, station density and layout, and location environment will make the station form different catchment area forms. The results are of great significance for supplementing the research methods of the catchment area of metro stations and improving the comprehensive benefits of rail transit.
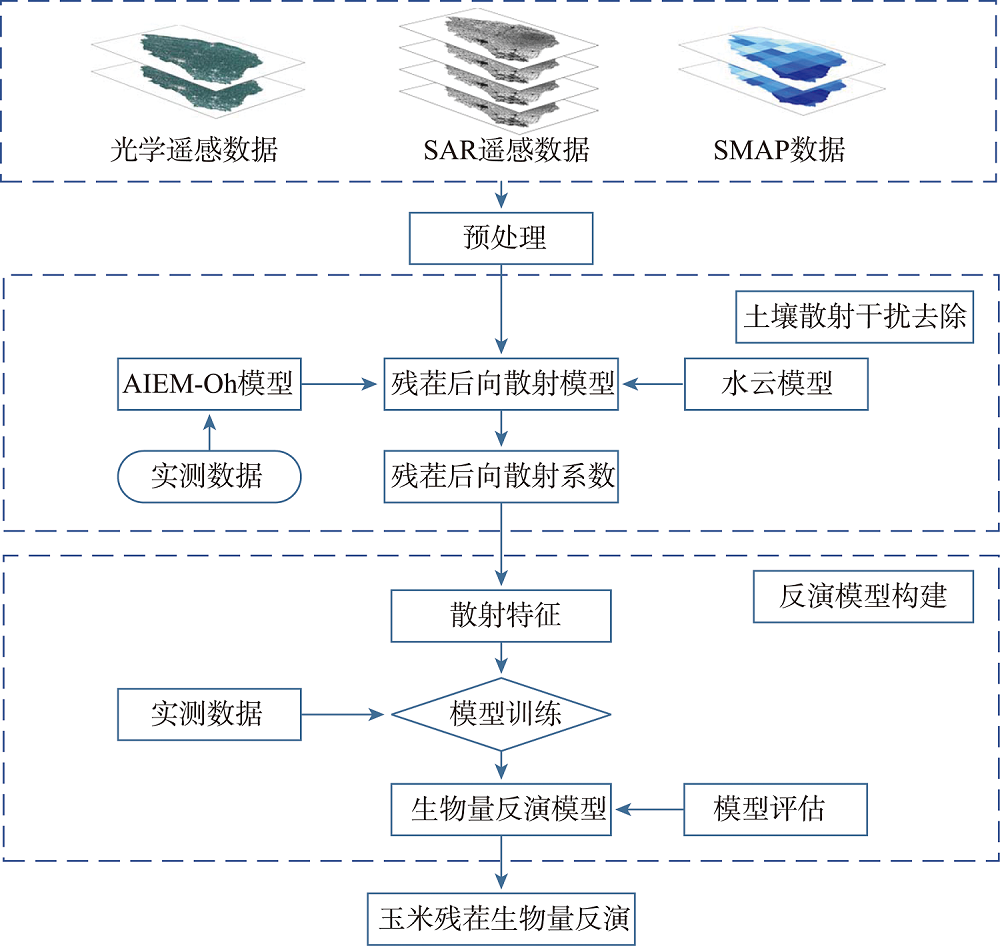
As a main way of conservation tillage, crop residue has important influence on the cycle of material and energy in farmland ecosystem. Acquisition of the biomass information of corn residues timely and accurately is of great significance for understanding the implementation of conservation tillage and evaluating the impact of residues quantitatively. However,compared with crops, residues have lower coverage and contain less water,which makes it more difficult to acquire the biomass. To address this issue, we developed a residue backscattering model based on AIEM-Oh model and the Water Cloud Model (WCM) to remove the soil scattering interference. Using Sentinel-1 SAR images as the main data source, a regression model of corn residue biomass was constructed based on radar features selected to retrieve and map the corn residue biomass in Lishu County. Results show that the residue backscattering model can eliminate the interference of soil backscattering contribution effectively, and the inversion model based on the residue backscattering coefficient can improve the biomass inversion accuracy. The autumn biomass inversion model based on the dual-polarized scattering product (Product) has an R2 greater than 0.75, and an RMSE less than 85 g/m2, showing an increase of at least 0.12 in R2 and a decrease of 17 g/m2 in RMSE compared to the biomass inversion model before soil scattering contribution removed. This study verifies the feasibility of residue biomass inversion model based on backscattering data with soil scattering interference removed, and provides an attempt for the dynamic monitoring of corn residue biomass using SAR remote sensing data in the future.
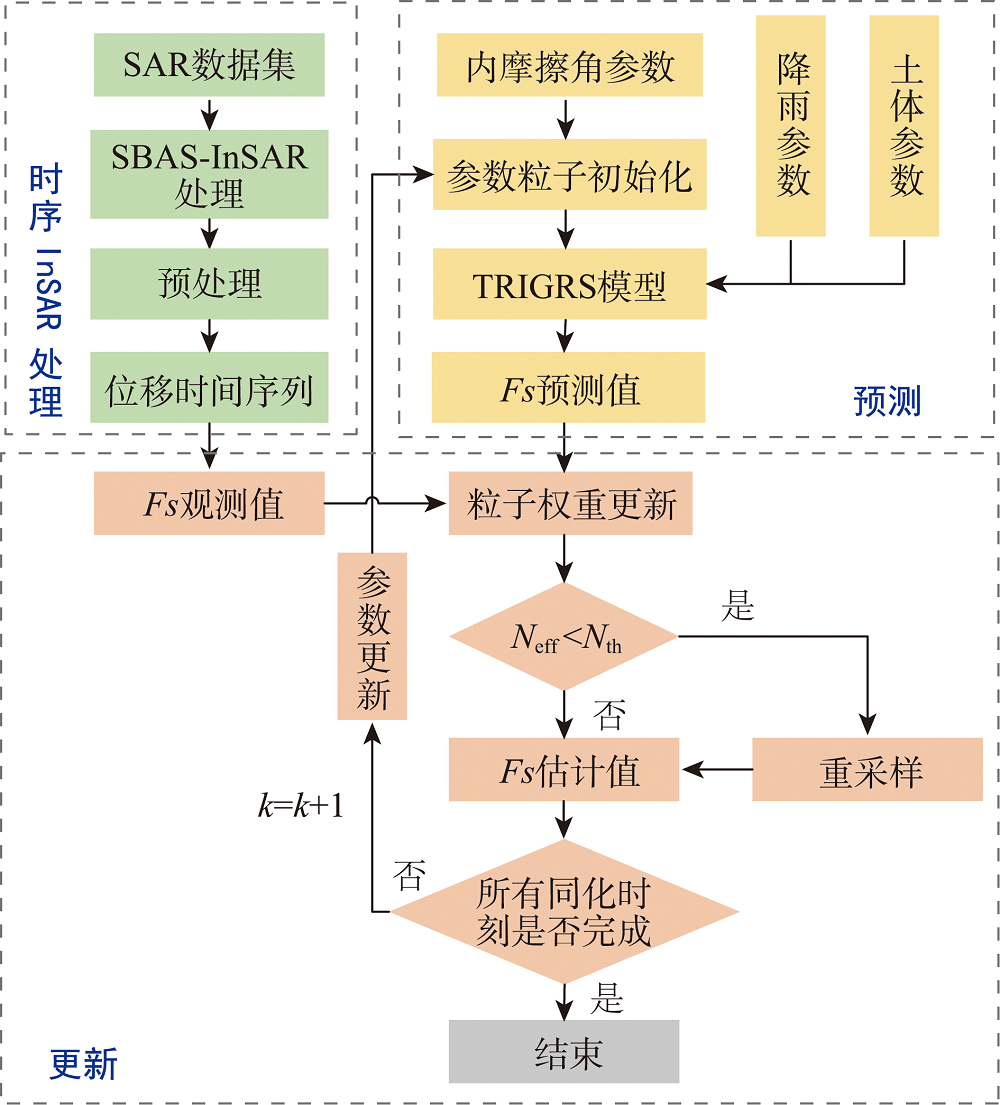
Landslide disasters pose a grave threat to national infrastructure projects, making landslide disaster risk assessment in engineering areas crucial for ensuring the safety of railway operations. Typically, such assessments involve employing frequency analysis, probability analysis, and deterministic analysis methods. Among these methods, the establishment of a physical deterministic model based on the mechanisms of rainfall infiltration and water accumulation yields more objective evaluation results and exhibits excellent applicability. However, physically deterministic models often necessitate the inclusion of numerous geotechnical parameters in their calculations, leading to certain limitations. Factors like temporal and spatial variability, as well as the uncertainty in geotechnical parameters, influence these models. To enhance the prediction accuracy of landslide risk assessments, this study focuses on the Gaojiawan landslide as the research area. By utilizing the particle filter algorithm, the study assimilates safety factor (Fs) data from the TRIGRS model, incorporating SBAS-InSAR observation data. Additionally, it updates the internal friction angle parameter of the model. The results reveal a gradual decrease in the safety factor of the Gaojiawan landslide following assimilation. Moreover, the safety factor at the front edge of the slope is significantly lower than that at the rear edge, aligning more closely with current observations. Real-time updates of the internal friction angle parameters are achieved, gradually aligning the parameters with the observed values. As a result, the root mean square deviation of the model decreases from 0.17 to 0.04, bringing the model's prediction closer to the observed values. Consequently, landslide risk assessment based on the particle filter assimilation method more accurately reflects the current landslide situation and exhibits higher prediction accuracy.
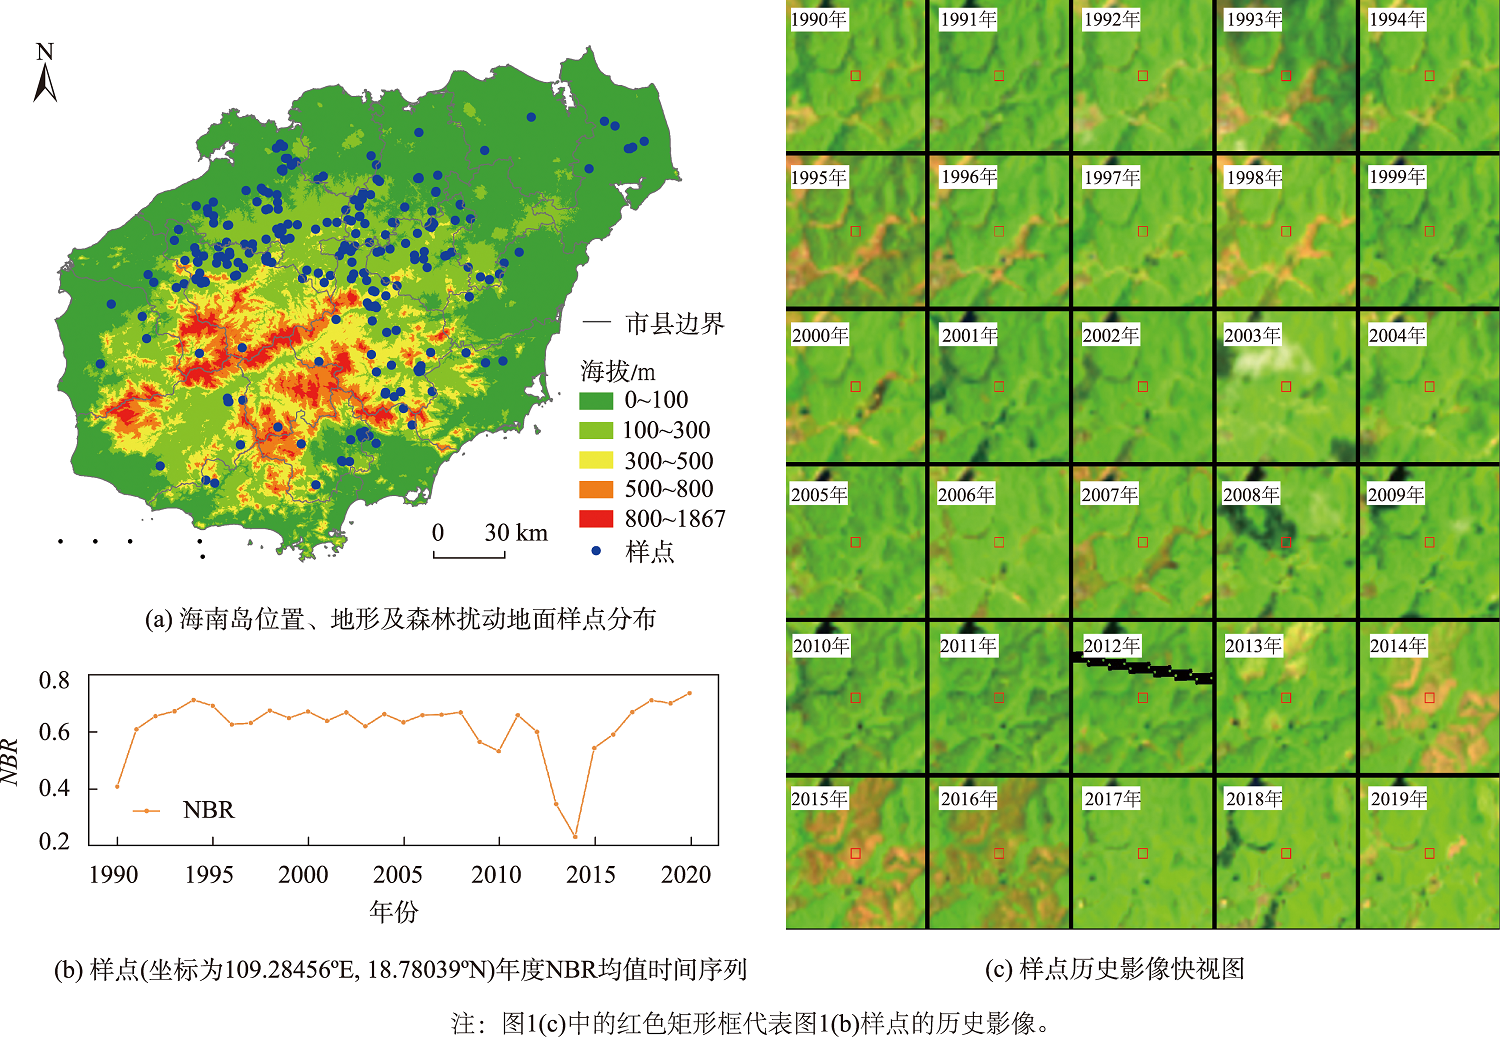
Tropical forests have significant economic and ecological value, and timely and accurate monitoring of forest disturbance is critical to promoting their sustainable development. In this study, all Landsat 5/7/8 and Sentinel-2 optical images since 1987 and the LandTrendr algorithm were used to monitor tropical forest disturbance in Hainan Island. The dense time-series satellite images were quickly processed on the Google Earth Engine platform (GEE), and the spatiotemporal distribution characteristics of annual forest disturbances on Hainan Island over the past 30 years were identified. The main causes of forest disturbance were analyzed with the development of rubber plantations, changes in forestry policies, and several severe natural disasters. The results show that: 1) the total area of forest disturbance from 1990 to 2020 is 2.53×10³ km2 (equivalent to 11.74% of the total forest area in 2020), and is mainly concentrated in the central, northern, and northwestern regions. The three regions with the largest forest disturbances are Danzhou City, Qiongzhong County, and Baisha County, respectively; 2) most forest disturbances occur at elevation below 300 m (83.40%) and slope less than 25° (94.86%), and forests at higher elevations are well preserved; 3) forest disturbance occurred more intensely between 2000 and 2010 and decreased significantly after 2010, with the largest affected area in 2005; 4) rapid development of rubber plantations (accounting for 43.48% of total forest disturbance area), changes in forestry policies (e.g., promotion of eucalyptus cultivation), and severe natural disasters (drought and hurricane) around 2005 are the main causes of forest disturbance. The rapid monitoring method of forest disturbance proposed in this study and long-term forest disturbance dataset provide a reference for forest monitoring research and forestry department decision making on Hainan Island.