期刊
文章
图表
检索
EN
中文
首页
关于期刊
期刊定位与发展现状
数据库收录
期刊荣誉
编委会
投稿指南
期刊政策
期刊订阅
联系我们
EN
中文
更多选择
期刊
DOI
请选择
Area Development and Policy
Cities
Journal of Arid Land
Regional Sustainability
Resources Environment and Sustainability
冰川冻土
长江流域资源与环境
沉积学报
城市学刊
城市研究
地理科学
地理科学进展
地理学报
地理学报(英文版)
地理学与可持续性(英文)
地理研究
地理与地理信息科学
地球科学进展
地球信息科学学报
地域研究与开发
地质与资源
第四纪研究
干旱区地理
干旱区研究
干旱区资源与环境
高原气象
贵州师范大学学报(自然科学版)
国际灾害风险科学学报(英文)
国情快报·科普版
国情快报·政策版
国土资源科技管理
寒旱区科学
湖泊科学
湖南城市学院学报(自然科学版)
湖南师范大学自然科学学报
湖南文理学院学报(自然科学版)
华南地理学报
黄金科学技术
经济地理
历史地理
历史地理研究
旅游论坛
旅游学刊
全球变化数据仓储电子杂志(中英文)
全球变化数据学报
热带地理
人文地理
山地科学学报(英文版)
山地学报
湿地科学
时空信息学报
世界地理研究
天然气地球科学
土壤与作物
亚热带资源与环境学报
遥感技术与应用
中国地理科学(英文版)
中国沙漠
中国生态旅游
中国土地科学
资源开发与市场
资源科学
资源与生态学报
自然资源情报
自然资源信息化
自然资源学报
起始年
结束年
请选择
1934
1935
1936
1937
1938
1939
1940
1941
1942
1943
1944
1945
1946
1947
1948
1949
1950
1951
1952
1953
1954
1955
1956
1957
1958
1959
1960
1961
1962
1963
1964
1965
1966
1967
1968
1969
1970
1971
1972
1973
1974
1975
1976
1977
1978
1979
1980
1981
1982
1983
1984
1985
1986
1987
1988
1989
1990
1991
1992
1993
1994
1995
1996
1997
1998
1999
2000
2001
2002
2003
2004
2005
2006
2007
2008
2009
2010
2011
2012
2013
2014
2015
2016
2017
2018
2019
2020
2021
2022
2023
2024
2025
请选择
2025
2024
2023
2022
2021
2020
2019
2018
2017
2016
2015
2014
2013
2012
2011
2010
2009
2008
2007
2006
2005
2004
2003
2002
2001
2000
1999
1998
1997
1996
1995
1994
1993
1992
1991
1990
1989
1988
1987
1986
1985
1984
1983
1982
1981
1980
1979
1978
1977
1976
1975
1974
1973
1972
1971
1970
1969
1968
1967
1966
1965
1964
1963
1962
1961
1960
1959
1958
1957
1956
1955
1954
1953
1952
1951
1950
1949
1948
1947
1946
1945
1944
1943
1942
1941
1940
1939
1938
1937
1936
1935
1934
卷
期
作者
作者单位
检索结果
期刊
Loading ...
出版年
Loading ...
表6 不同模型性能和复杂度指标对比
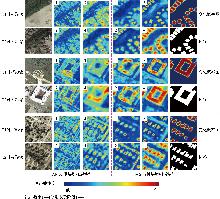
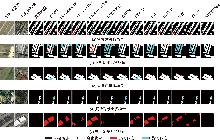
图8
MSDFENet网络中间层特征四阶段热力图可视化
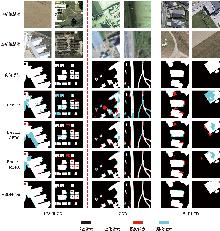
图7
消融实验目视结果
表5 消融实验定量结果
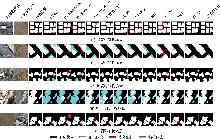
图6
WHU-CD数据集实验结果
表4 WHU-CD数据集上不同模型定量指标对比
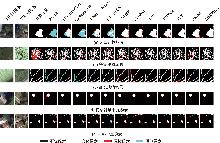
图5
CDD数据集实验结果
表3 CDD数据集上不同模型定量指标对比
图4
LEVIR-CD数据集实验结果
表2 LEVIR-CD数据集上不同模型定量指标对比
表1 不同变化检测方法对比
图3
MSFA模块结构
图2
APDC模块结构
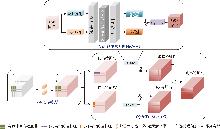
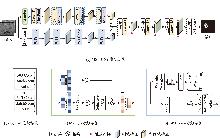
图1
MSDFENet网络结构
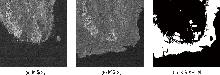
图4
邯郸数据集影像及参考变化图
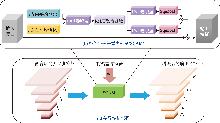
图3
MSF-UNet模型结构
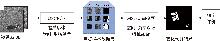
图2
DSCF方法流程
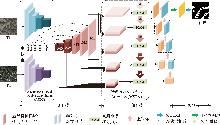
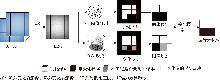
图1
所提方法的整体框架
表4 不同方法的模型参数量、浮点运算次数和训练时间
表3 消融实验在邯郸数据集中的评价指标结果
跳至
页
第1页
共8239页
共164776条记录
首页
上一页
下一页
尾页