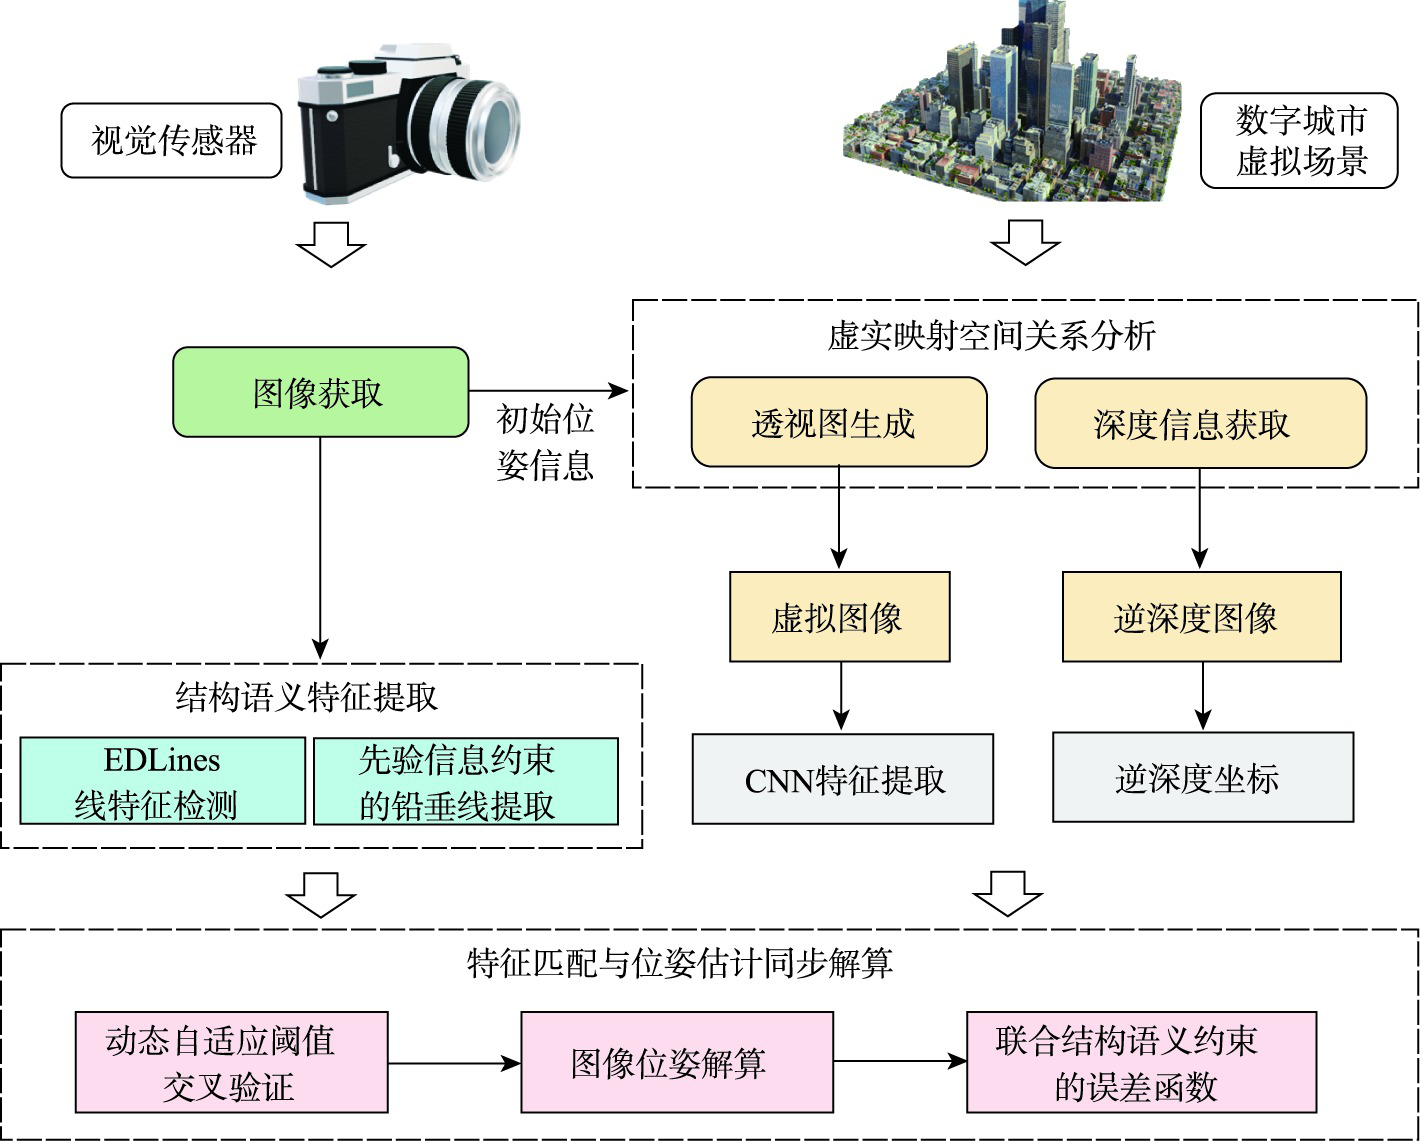
Digital city is one of the main requirements of three-dimensional (3D) real scene and leads the direction of future smart city construction. Digital city usually uses the 3D model of the real scene as the spatial data volume and integrates the object-linked data of various sensors to achieve virtual-real fusion. The integration of spatial data volume and object-linked perception data is the key to digital city applications. Visual sensor is an important sensor type which is widely used in urban life, such as surveillance cameras, vehicles, and other devices. The key to digital city application is registering the visual sensors with virtual 3D model accurately. The purpose of spatial registration for visual sensor is to estimate or optimize the position and orientation of the visual sensor and to get the accurate spatial position of any object in the image. It is one of the key technologies for applications such as Augmented Reality and Video GIS. Currently, the spatial registration methods for visual sensors can be divided into hardware-based and vision-based methods. Due to the popularity of vision sensors, vision-based registration methods have been widely used. However, in digital city applications, seasons and weather always change, there are often large differences in appearance between the real image taken by visual sensor and the image of virtual scene. Therefore, the accuracy of outdoor 6 Degree of Freedom (DOF) position obtained by existing methods is usually insufficient, resulting in low registration accuracy of the visual sensor. In order to improve the accuracy of visual sensor spatial registration in digital city scene, this paper presents a method of virtual-real registration for digital city scene with structural semantic information in urban area. Firstly, the virtual perspective image of digital city scene is obtained, the plumb line which contains structural semantic information is extracted from the target image, and the properties of global constraints of the plumb line is used to restore the camera's position accurately and achieve the registration of monocular image in the virtual digital scene. Experiments show that this method achieves accurate registration of virtual and real images with large differences in appearance. Compared with the existing methods, the position and orientation errors are reduced by 35.9% and 39.3%. This method can effectively optimize the initial pose and improve the registration accuracy of visual sensors in digital city scene. A lightweight cloud-edge registration framework is designed and can be used in image geolocation tasks based on portable devices.
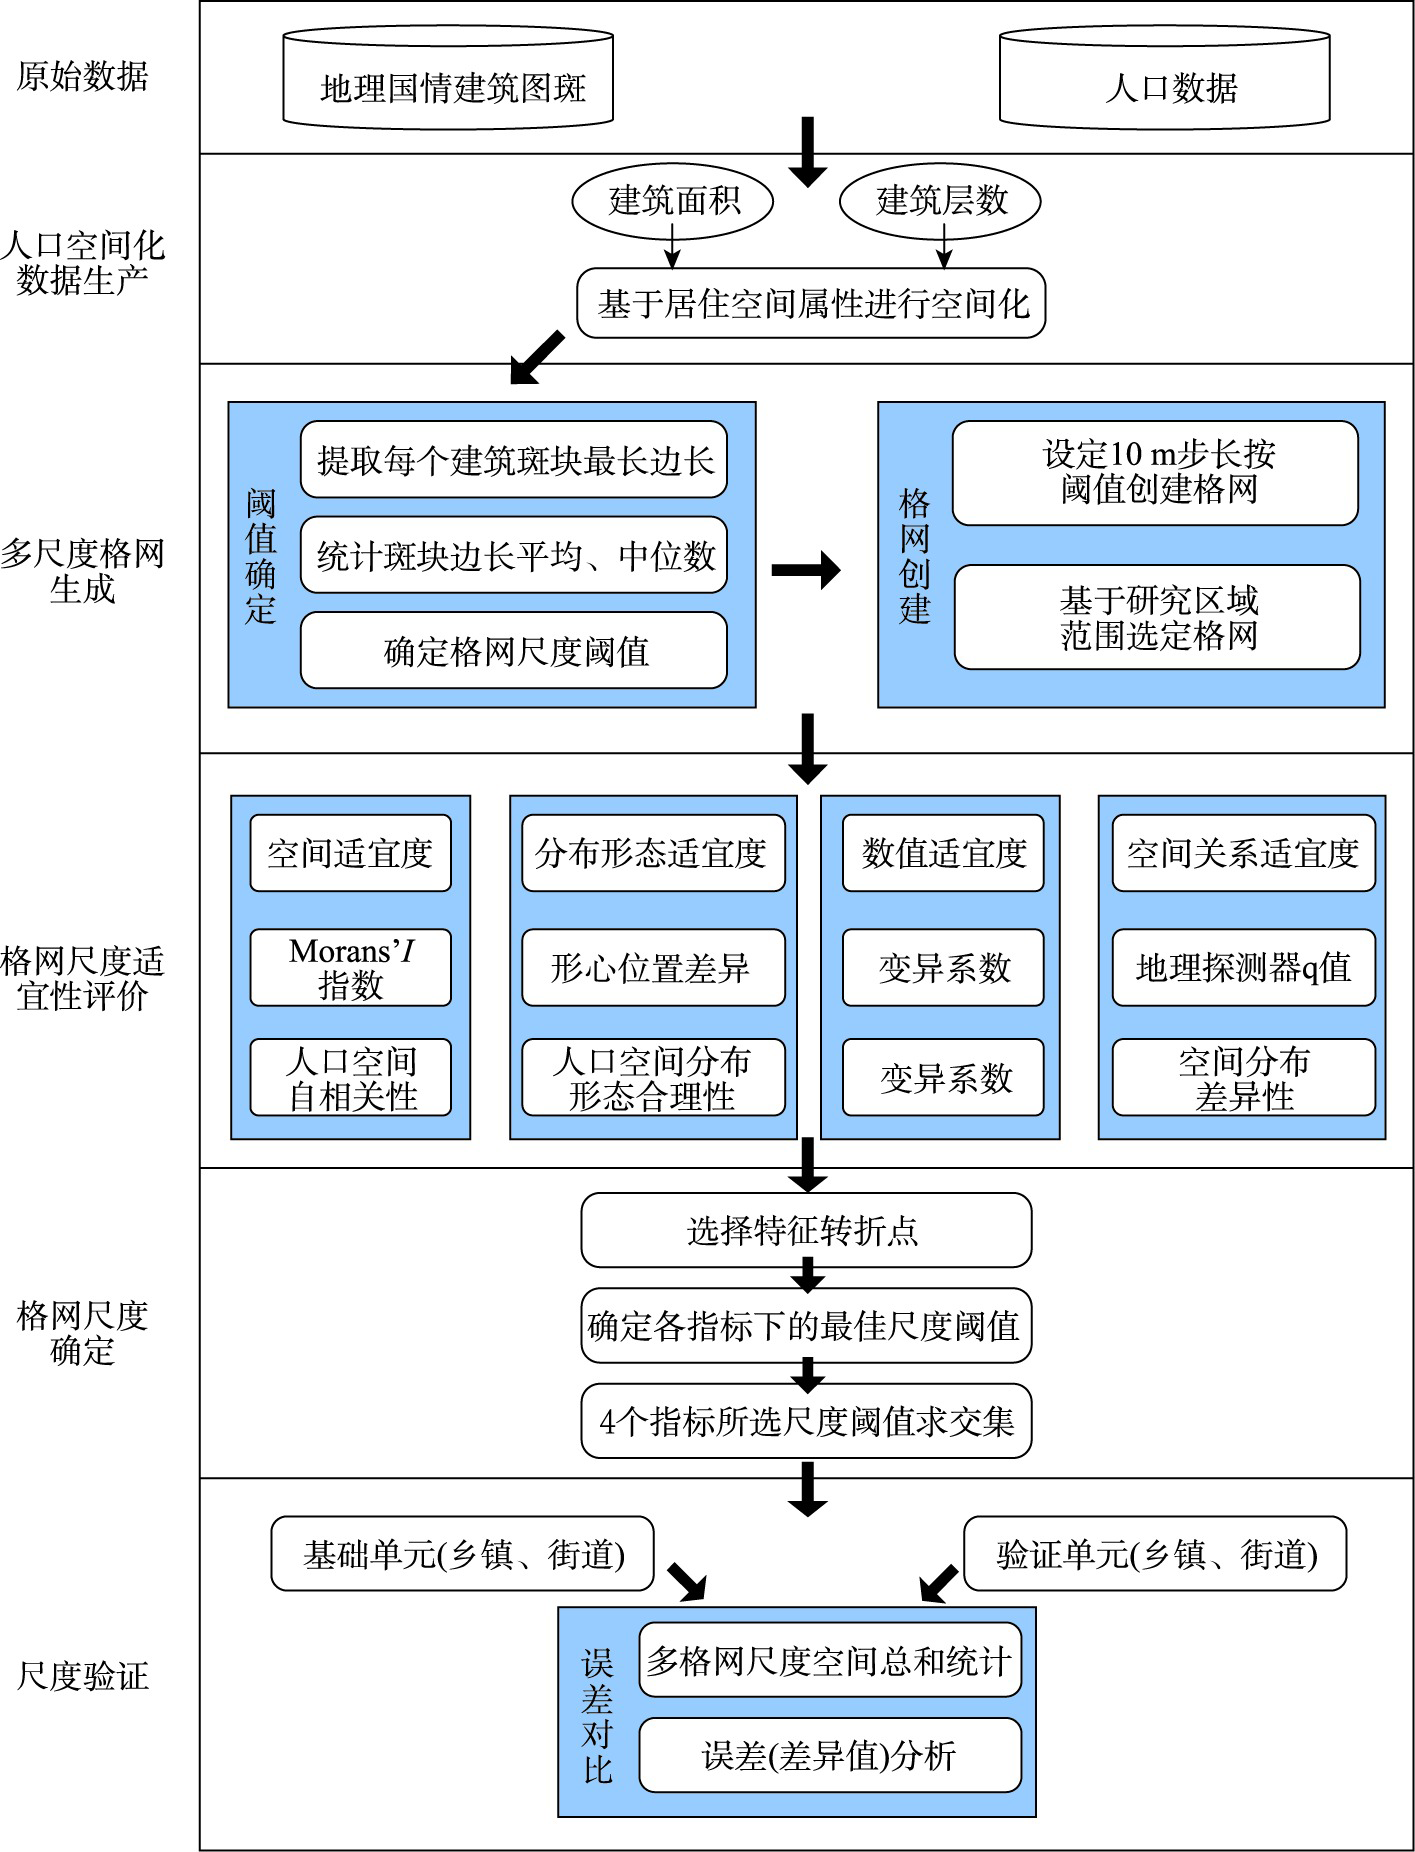
The spatial distribution of world population varies considerably from region to region due to differences in geography and economic development, which requires a specific scale of population grid for population spatialization in different regions. A uniform grid scale can only represent the spatial distribution of population at one grid scale, which leads to poor representation for more densely or sparsely populated areas. In order to express the spatial distribution of the population more accurately and determine the appropriate scale of the population grid for a given area, this paper proposes a method to determine the scale of suitable grids based on a multi-indicator analysis. We construct an innovative index system based on the shape-centered difference distance, by combining spatial suitability, numerical suitability, and spatial relationship suitability, and use spatial autocorrelation, coefficient of variation, and geographic detector model to get rid of the scale effect of landscape index from the spatial and numerical perspectives. In this paper, the process of population spatialization employs geographic country data combined with occupancy spatial attributes (i.e., number of building floors and floor area). The suitable scale threshold of the grid under each index is determined based on the analysis of the change of the characteristic points of each index, and then the common scale threshold is identified as the overall suitable grid scale. The geometric mean of the absolute relative error against the real population value is calculated to verify the index analysis results and the suitable scale of population grid. This paper takes the Guye District of Tangshan city in the Capital Economic Circle as the empirical analysis area. The results of the index system analysis show that the differences between clusters of population patches gradually become smaller and their distribution patterns become less expressive as the scale of the girds increases, and the overall expressiveness of the population grid gradually decreases as the scale increases. From perspectives of spatial suitability, distribution morphology suitability, numerical suitability, and spatial relationship suitability, 90 m and 100 m are identified as the suitable grid scales, under which the population spatialization could obtain better quality. The validation analysis demonstrates that the method of determining suitable grid scale for population spatialization in this study has a certain degree of validity and reliability.
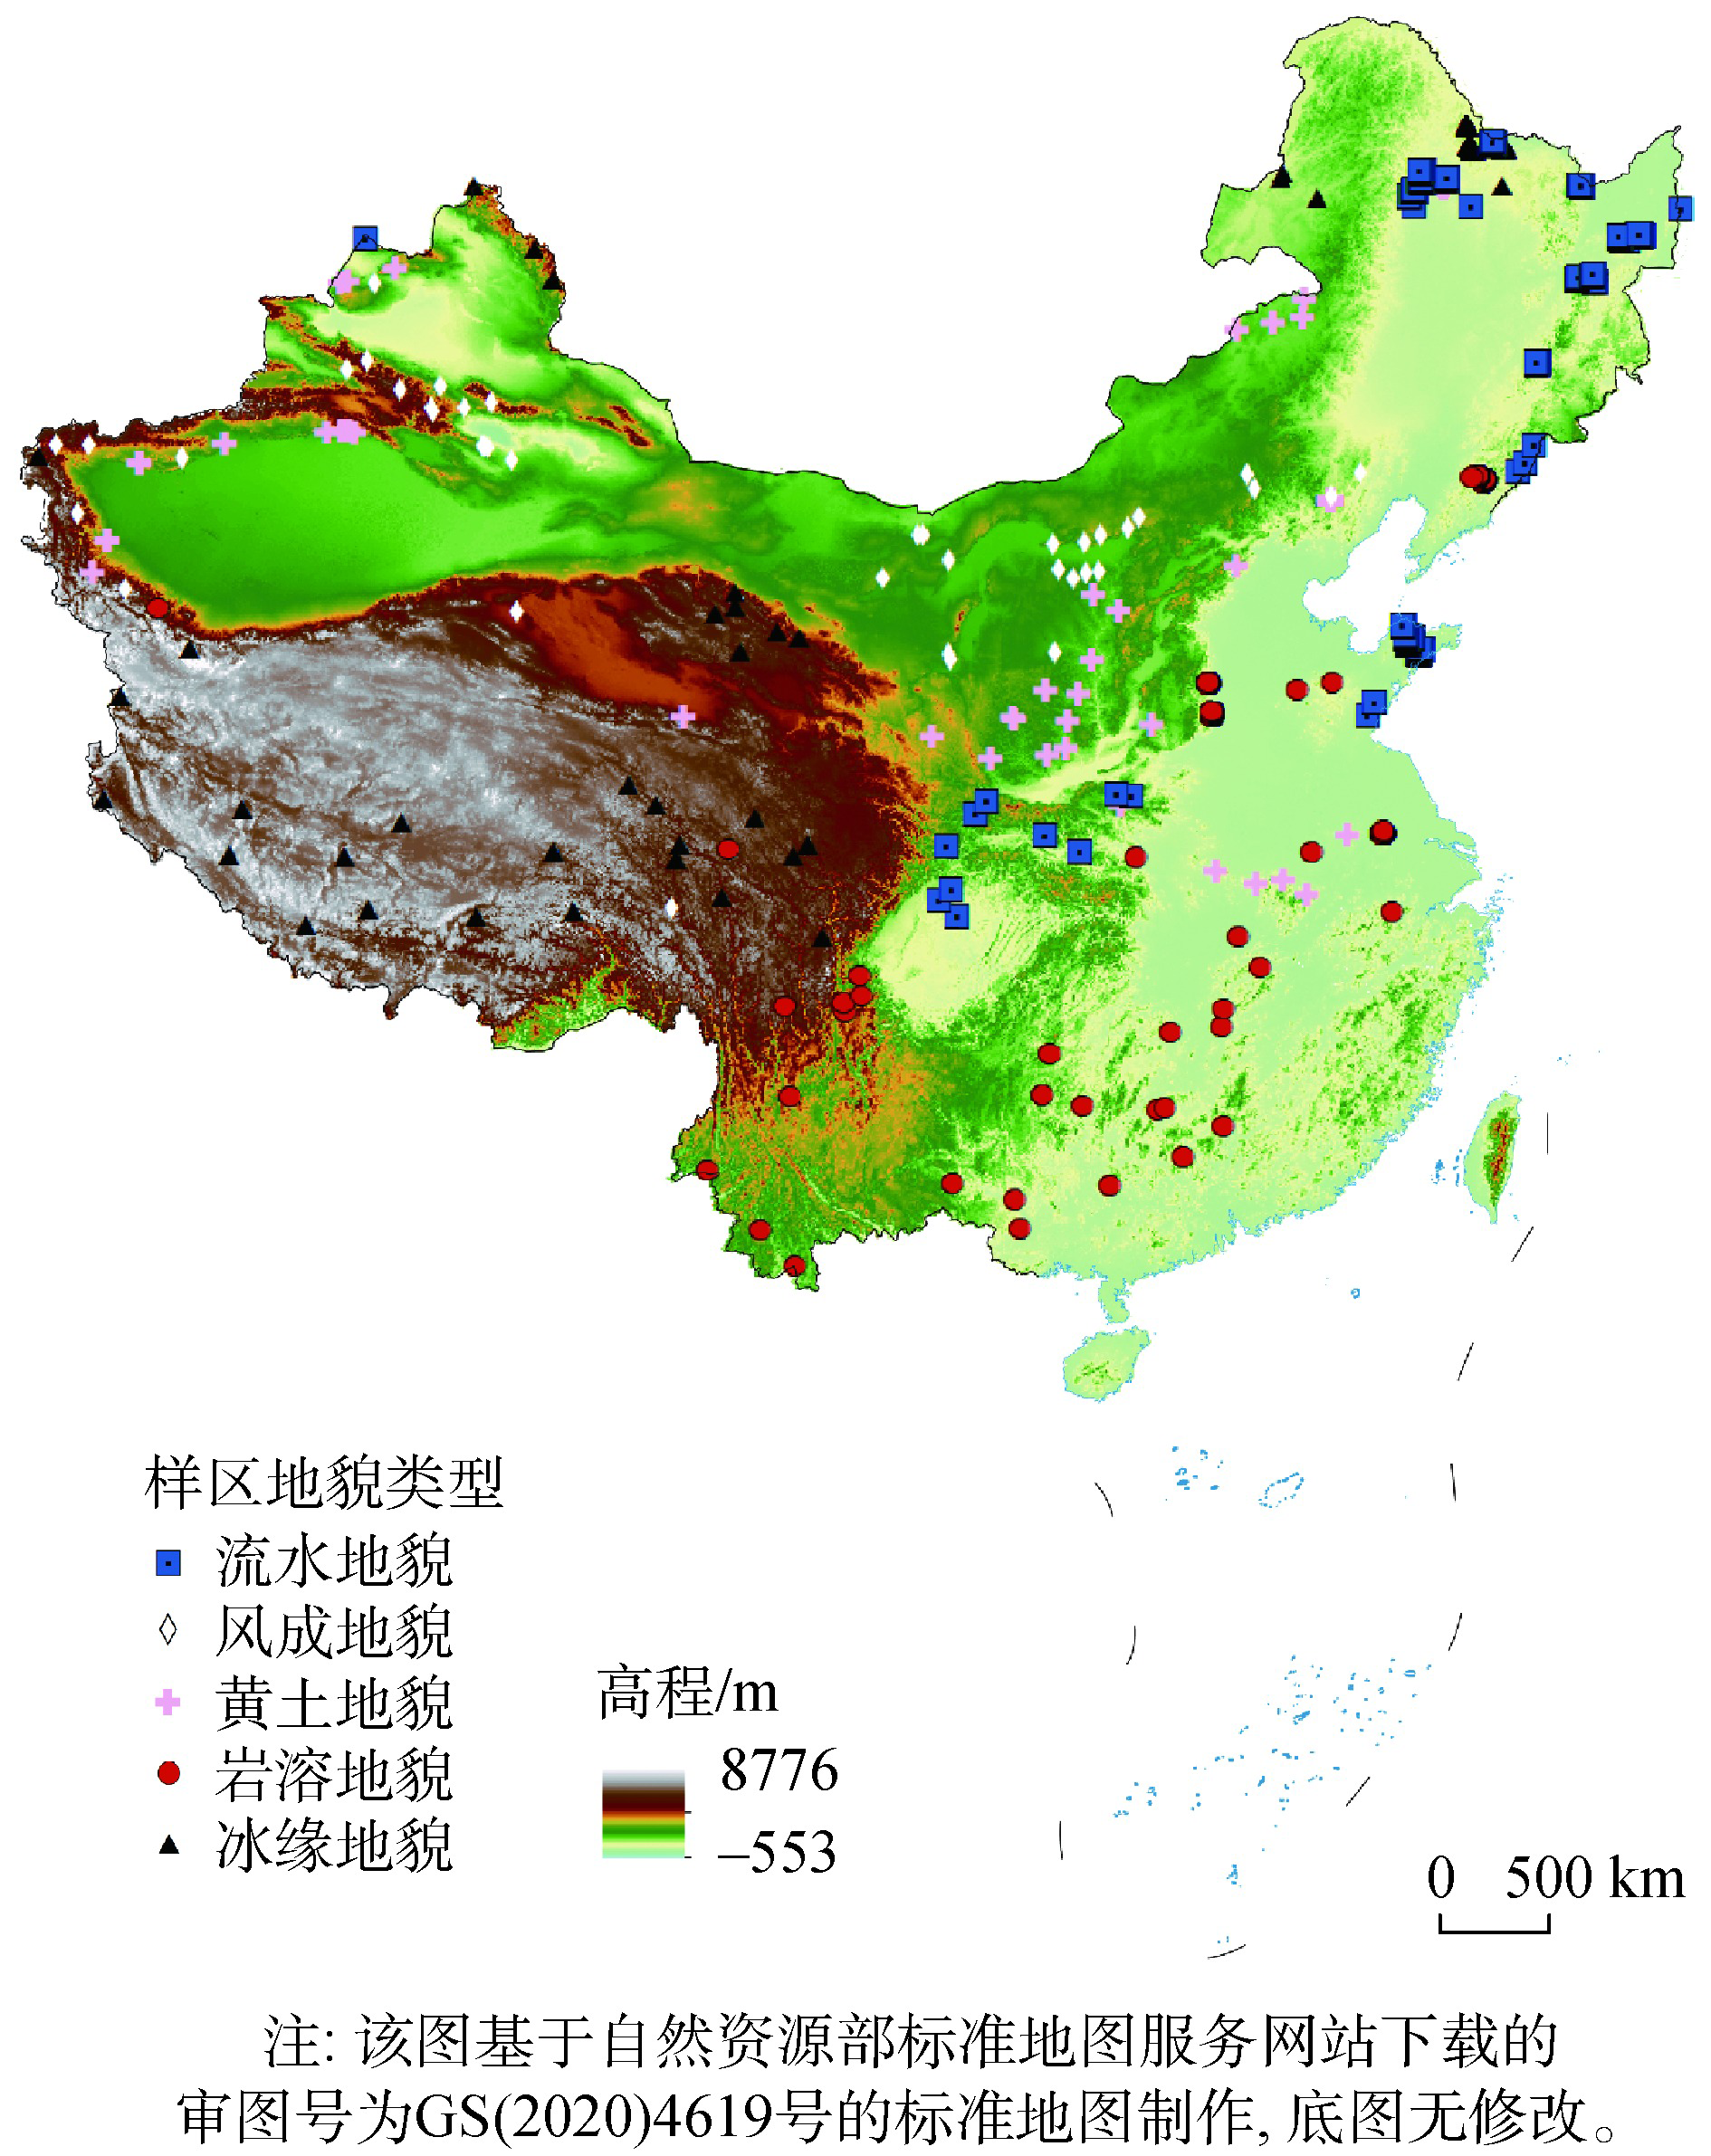
Landform recognition has become a key part of geomorphological research, which has been widely concerned by scholars. The research of geomorphic units based on catchment has become a hotspot in the field of landform recognition. Previous studies have generated a series of new questions, such as whether large-scale landform types can be identified based on local catchment landform features, which landform description methods are more adaptable, and what is the knowledge bottleneck of current landform recognition methods based on the catchment. So, in this paper, we selected sample areas representing five major landform types in China, including karst, loess, periglacial, aeolian, and fluvial. Based on the complex network theory, we took the complex network indicators and the topographic metrics as the basic data sources. Three typical machine learning methods, i.e., LightGBM, XGBoost, and RF, were used to automatically identify the main geomorphic types in China. Results show that both the complex network structure and the terrain features of the catchment have certain explanatory power and recognition effect on landforms, and the overall recognition accuracy is 77.5% and 72.5%, respectively. Among the five geomorphologic types selected, LightGBM, XGBoost, and RF machine learning methods have the highest recognition accuracy (up to 100%) on periglacic geomorphology. Compared to a single geomorphic description data source, the geomorphic recognition effect that combines the two data sources is significantly improved. The overall accuracy using two data sources is 5% and 10% higher than that using the single complex network dataset and the single topographic dataset, respectively. Moreover, LightGBM has better adaptability to the combination of complex network and terrain factor feature sets, and the overall accuracy can reach 82.5%. In general, this study expands the application area and scope of catchment landform recognition methods, and provides a new idea for the research of catchment landform recognition.
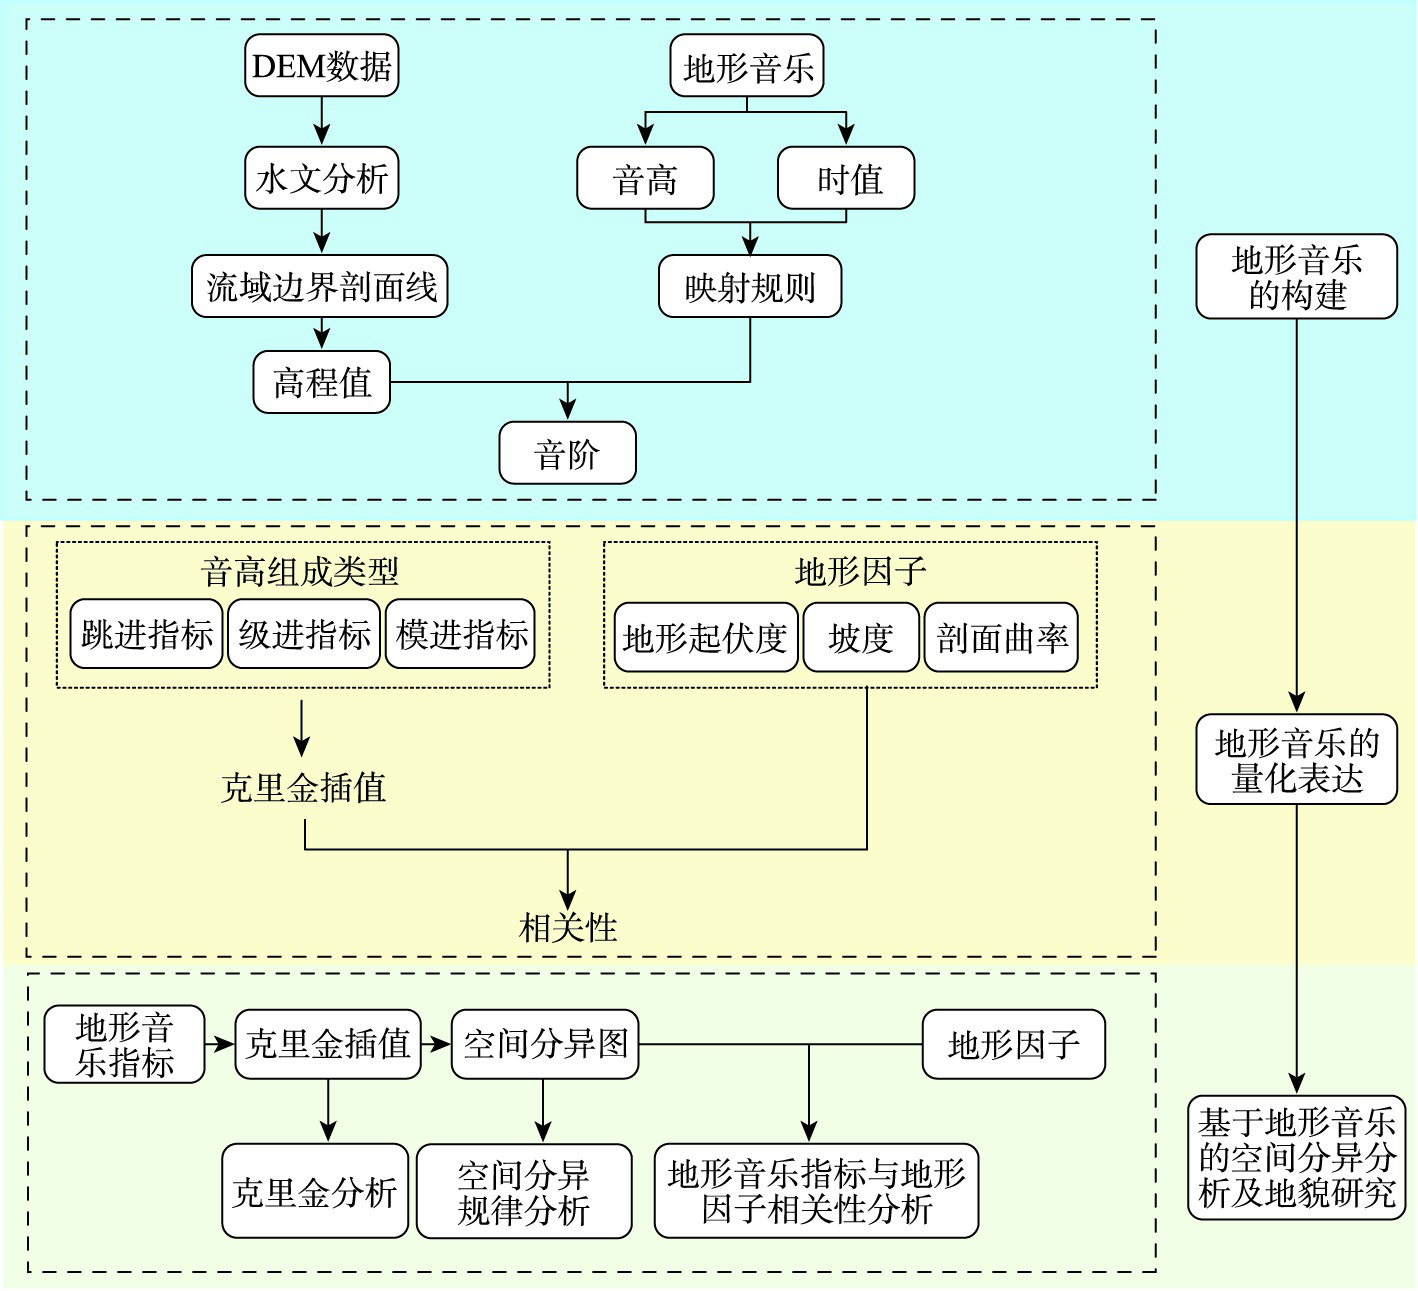
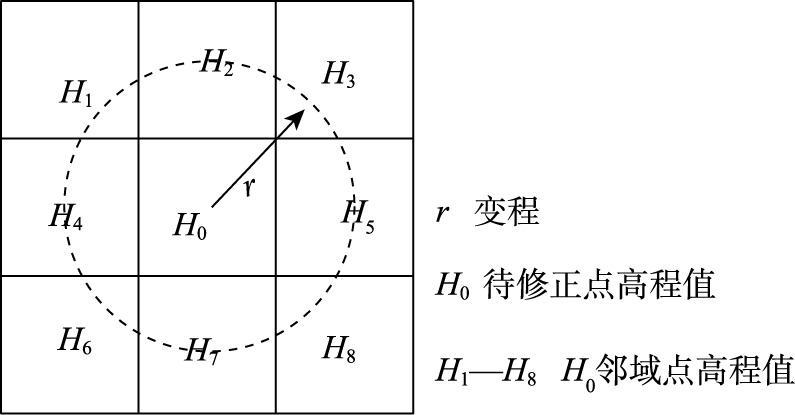
Terrain music, the study of terrain feature lines, describes terrain undulation patterns in audible form. This paper takes terrain music as the starting point to simulate and quantify the morphology of terrain characteristic lines, and further discusses the spatial differentiation characteristics and laws of the terrain on the Loess Plateau. Based on the DEM data with a resolution of 30 m, 53 typical watersheds evenly distributed on the Loess Plateau in northern Shaanxi were selected as test sample areas, and the music theory knowledge, digital terrain analysis, and geostatistical theory were integrated. The watershed boundary profile was taken as the entry point to realize the digital expression of the land surface morphology. The Kriging method was used to construct a spatially differentiated map of terrain music index, so that the spatial distribution patterns and characteristics of the terrain could be further analyzed. On this basis, the spatial distribution of terrain music index on the Loess Plateau in northern Shaanxi and the comparative analysis with traditional indicators were further discussed. Results show that the terrain music index can quantitatively describe and reveal the spatial distribution characteristics of the terrain from multiple angles: ① The correlation coefficient between jump-in index and terrain undulation is -0.486, which quantitatively describes and reveals the spatial distribution characteristics of terrain from the degree of terrain undulation; ② The correlation coefficient between the grade progression index and slope is -0.328, which quantitatively describes and reveals the spatial distribution characteristics of terrain from the degree of slope of the terrain; ③ The correlation coefficient between the modal progression index and the profile curvature is -0.309, which quantitatively describes and reveals the spatial distribution characteristics of the terrain from the degree of terrain curvature. This study expands the research scope of digital terrain analysis and promotes the integration of music theory and geomorphology research, which further reveals that the application scope of terrain music related research methods in the field of geomorphology is different from that of traditional methods. This study examines the characteristics and internal mechanisms of spatial differentiation of terrain from the perspective of audibility, which deepens the understanding of development processes and internal mechanisms of terrain on the Loess Plateau.
Due to the limitation of earth observation technology, the existing global Digital Elevation Model (DEM) datasets usually contain information of vegetation, buildings, and other non-ground objects. Especially in forested areas, the DEM data usually cannot describe the bare-earth surface precisely and show large systematic deviations. This study proposes a Back Propagation Neural Network (BPNN) model that takes into account the spatial autocorrelation of elevation to reduce the errors of bare-earth DEM in forested areas. This model first fits the optimal semivariogram to determine the spatial variation of elevation and takes the elevation points within the variation range from a target point as the optimal spatially autocorrelated neighborhood. Then, we train the BPNN model by using the terrain factors (i.e., slope, aspect, and terrain undulation), vegetation factors (i.e., vegetation height and vegetation coverage), and elevation points within the range of variation as the influencing factors, and using the elevation difference between DEM and Light Detection And Ranging (LiDAR) DEM as the predicted value. Finally, the trained model is used to correct the DEM in different forested areas. In order to verify the practicability and efficiency of the model, this paper takes the DEM products including SRTM1, AW3D30, and TanDEM-X (TDX) 90 of four types of forests (evergreen broad-leaved forest, evergreen coniferous forest, mixed forest, and deciduous broad-leaved forest) as the research objects, and trains the BPNN model respectively for each forest type. The correction result is compared with BPNN trained with all four types of forest data (BPNN-T), BPNN trained without terrain factors (BPNN-W), BPNN trained without spatial autocorrelation of elevation (BPNN-R), and multiple linear regression model (MLR). The results show that: (i) The BPNN model significantly improves the accuracy of DEM in the four forests, with the Mean Error (ME) close to 0-1 m and the Root Mean Square Errors (RMSE) reduced by 46%~70%; (ii) The aspect has the largest influence on the DEM correction for TDX90 while has little influence on SRTM1 DEM correction. Before and after correction, the RMSE of each DEM increases with the increase of slope and relief; (iii) The DEM error increases with the increase of vegetation height and vegetation coverage before correction, but this trend disappears after correction, indicating that BPNN effectively eliminates the impact of vegetation on bare ground DEM; (iv) BPNN has the highest prediction accuracy, followed by BPNN-T, MLR, and BPNN-W. And BPNN-R has the worst prediction accuracy. Therefore, the accuracy of DEM can be significantly improved by fully considering terrain factors and spatial autocorrelation of elevation for different forest types.
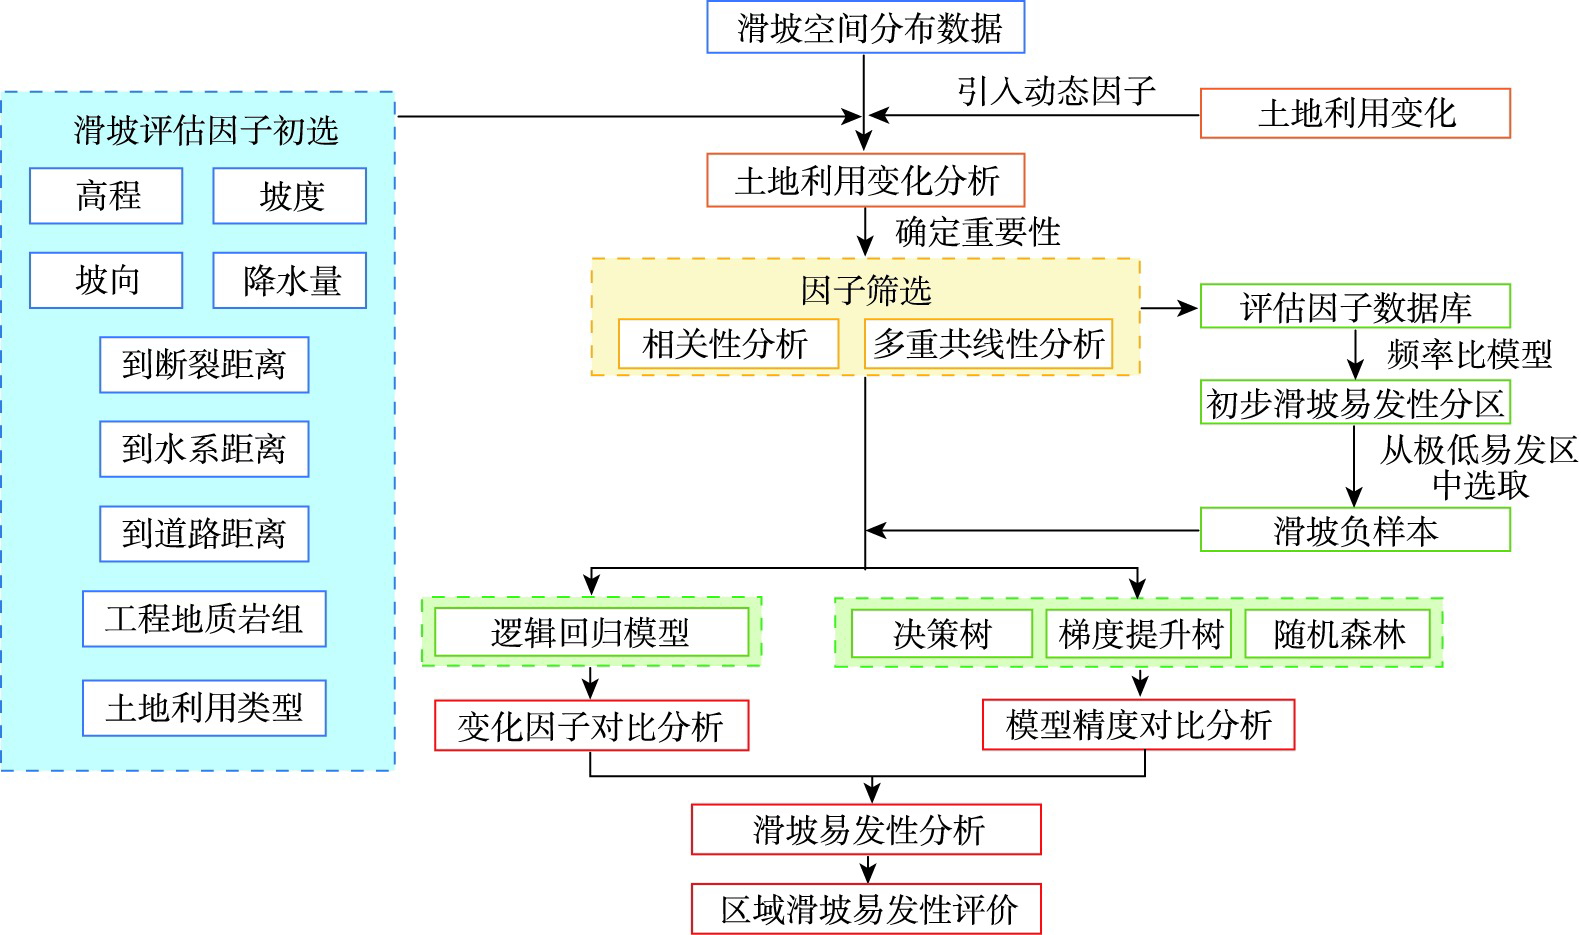
The causes of landslide disasters are complex, and landslide susceptibility assessment is of great significance for disaster warning, prevention, and control management. In the previous mapping studies on landslide susceptibility assessment, land use change factor was not considered. This paper proposed a combination of factors for landslide susceptibility assessment by considering land use dynamic change factor. The landslide frequency ratio was used to quantitatively measure the correlation between land use change and landslide development. And Logistic Regression (LR) model was used to compare the prediction ability of the model before and after the introduction of land use change factor. We constructed three machine learning models: Decision Tree (DT), Gradient Boosting Decision Tree (GBDT), and Random Forest (RF). We used AUC and other indicators to compare model performance. Finally, we took Sanming City of Fujian Province as the study area and the whole Fujian Province as the verification area to conduct the landslide susceptibility assessment research. The results show that there is a strong correlation between land use change factor and landslide development. The inclusion of land use change factor improves model prediction accuracy, which indicates that it is necessary to introduce dynamic factor in the assessment of landslide susceptibility. The verification results show that RF model has higher prediction accuracy than DT and GBDT. The high landslide prone areas are mainly distributed in the west and central of Sanming City, where the land use change degree is high, and the impact of human activities is great. The low landslide prone areas basically locate in the high-altitude areas with little influence of human activities. This study provides a new research perspective for landslide susceptibility assessment and helps to explore the impact of human activities on disaster formation.
In response to the problem of poor continuity when using traditional LOD generation algorithms to render large-scale 3D geological models, this paper puts forward a kind of edge-locking LOD method to eliminate boundary cracks in 3D geological models. To begin with, the triangular grid partitioning issue is quickly transformed into a graph partitioning problem using a multi-level graph partitioning algorithm, which divides the triangular grid into a series of clusters and cluster groups of similar size based on spatial adjacency and executes the multi-level graph partitioning algorithm with parallel computation to improve the partitioning efficiency. Next, the grid simplification algorithm based on quadratic error metric locks the boundaries of cluster groups for simplification to generate higher level LOD. In the simplification phase, edge-locking simplification is achieved by increasing the boundary edge weights of cluster groups at each level of LOD, while at the same time, DAG dependencies of clusters and cluster groups at different levels of LOD are constructed from the bottom up. Finally, the LOD progressive data blocks at all levels of the model are efficiently generated and the paging mechanism is utilized to encode cluster and cluster group data blocks, thus taking full account of the spatial adjacency of the data and DAG dependencies so that a minimum number of Pages are loaded simultaneously at runtime. In this paper, the 3D geological models with different scales and complexity constructed from borehole data are selected for data validation, in which A is constructed from 189 borehole data to obtain 21 standard strata with a data size of 50MB and an area of 3337 km2; B is constructed from 6489 borehole data to obtain 43 standard strata with a data size of 139 MB and an area of 123 km2. After accessing the data file in Obj format, the LOD is constructed by performing operations on the model such as delineation of clusters and cluster groups, mesh simplification of constrained outer boundaries, as well as encoding the clusters and cluster groups data of the LOD. The experimental findings indicate that the approach proposed in the paper can generate LOD with a simplification rate of approximately 50% at all levels to eliminate cracks between high and low precision data blocks of the 3D geological model, achieve better continuity expression when visualizing 3D geological models, have better rendering effects, which can satisfy the requirements of high-quality visualization of multi-scale large-scale 3D geological models, and is applicable to urban underground space engineering, digital mines, and other fields, as well as providing support for the transparency of underground space and visualization of large-scale geological models.

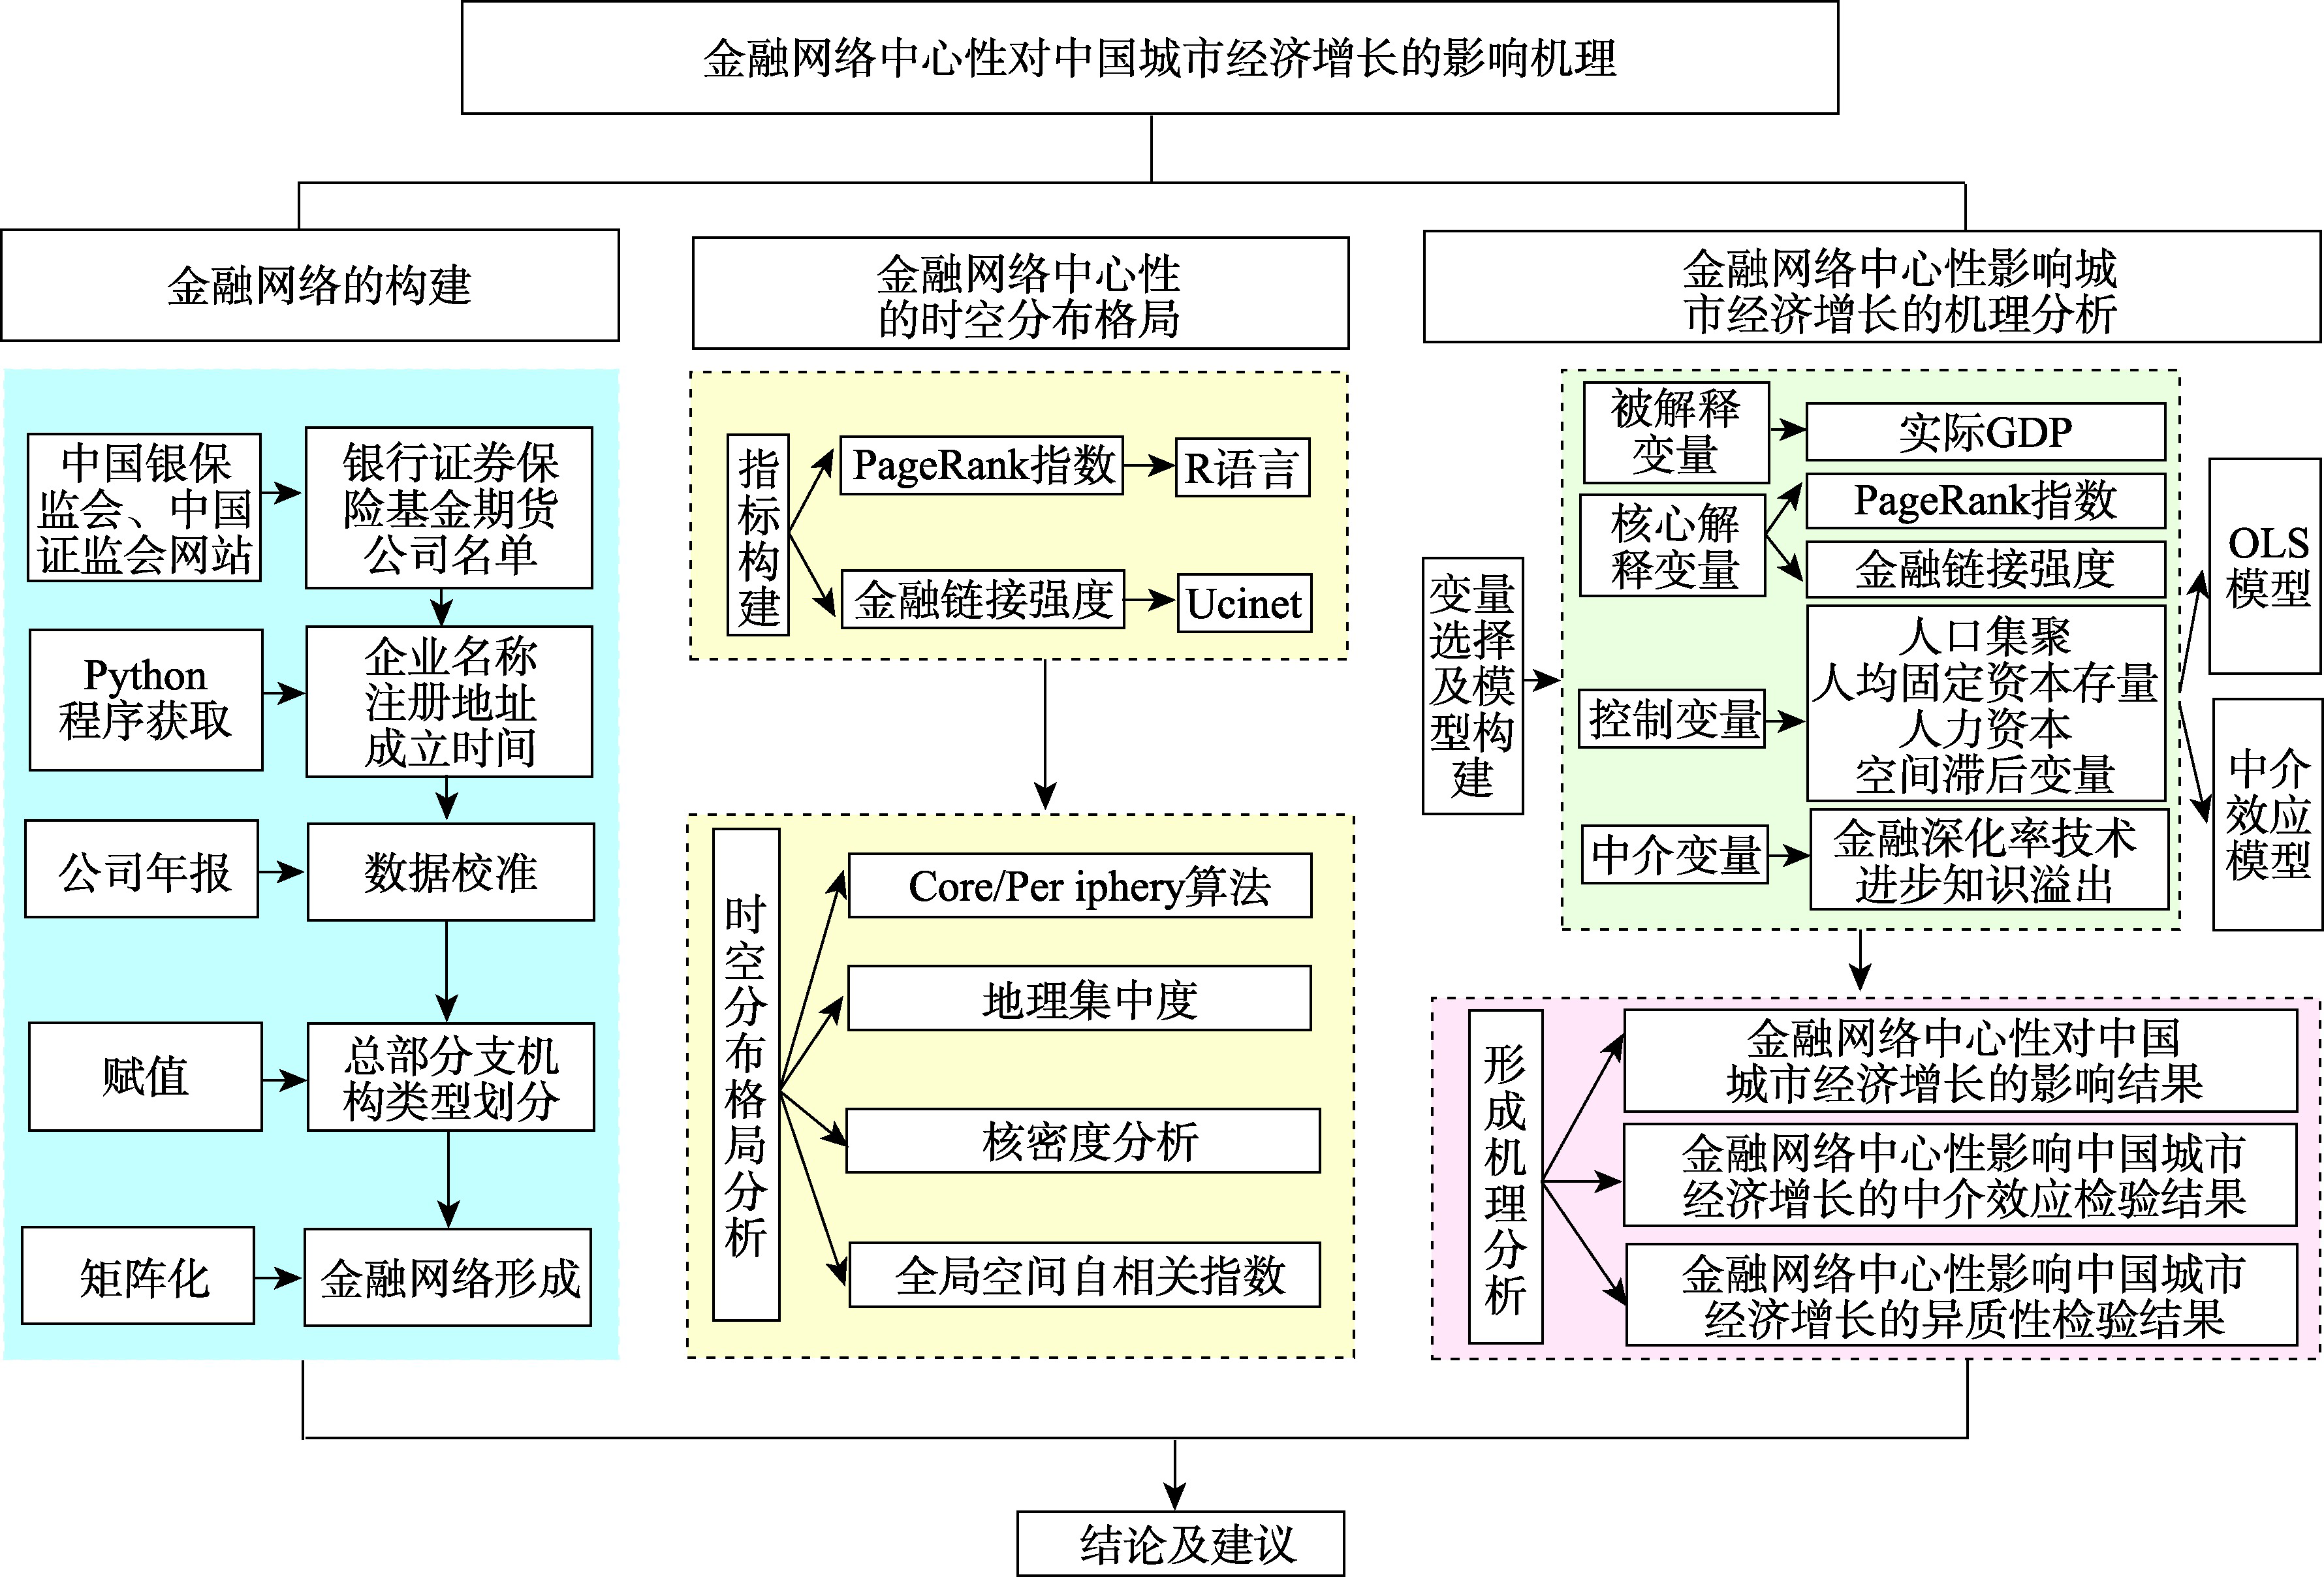
The development of financial network has profoundly changed the form of knowledge spillover between cities and further affected the level of urban economic growth. The research on the externality of financial network has gradually become a research hotspot in financial geography. With the assistance of the data of headquarters and branches of enterprises in China's financial industry from 2005 to 2020, this paper combines the methods of social network analysis and recursion thought to calculate the centrality of financial network to analyze its spatial and temporal distribution pattern. Meanwhile, we use the OLS model to analyze the influence mechanism of financial network centrality on urban economic growth in China. The study finds that: (1) From 2005 to 2020, the centrality of financial network showed a "core-edge" distribution pattern, but the spatial agglomeration degree of financial network was decreasing. In this paper, with the help of the Core/Periphery algorithm in UCINET software, cities are divided into core and peripheral cities according to the 2020 financial network,and finally 52 cities with core status, such as Beijing, Guangzhou, and Hangzhou, and 239 cities with peripheral status, such as Anshan, Binzhou, and Foshan, are identified. Cities in the eastern region play an important role in the allocation of financial network resources, forming a "core-periphery" pattern with Beijing, Shanghai, and Shenzhen as the core cities and the other cities as the periphery cities; (2) The development of financial network can not only alleviate financing constraints, but also affect urban economic growth by promoting knowledge spillovers under the influence of network externalities. Cities with larger network links and better accessibility have higher levels of economic growth, and the knowledge spillover effect is more dependent on network proximity than location advantage in "place space"; (3) The degree of knowledge spillover promoted by financial network centrality shows spatial heterogeneity, and the core city which plays the role of "knowledge gatekeeper" can obtain greater benefits from network links. Due to the lack of "knowledge gatekeepers", peripheral cities are unable to make full use of external resources, which exacerbates the risk of being at the low end of the value chain and finally leads to the economic growth level of core cities much higher than that of peripheral cities. In the future, we should attach great importance to the construction of financial network and give full play to the driving role of financial network in urban economic growth in China.
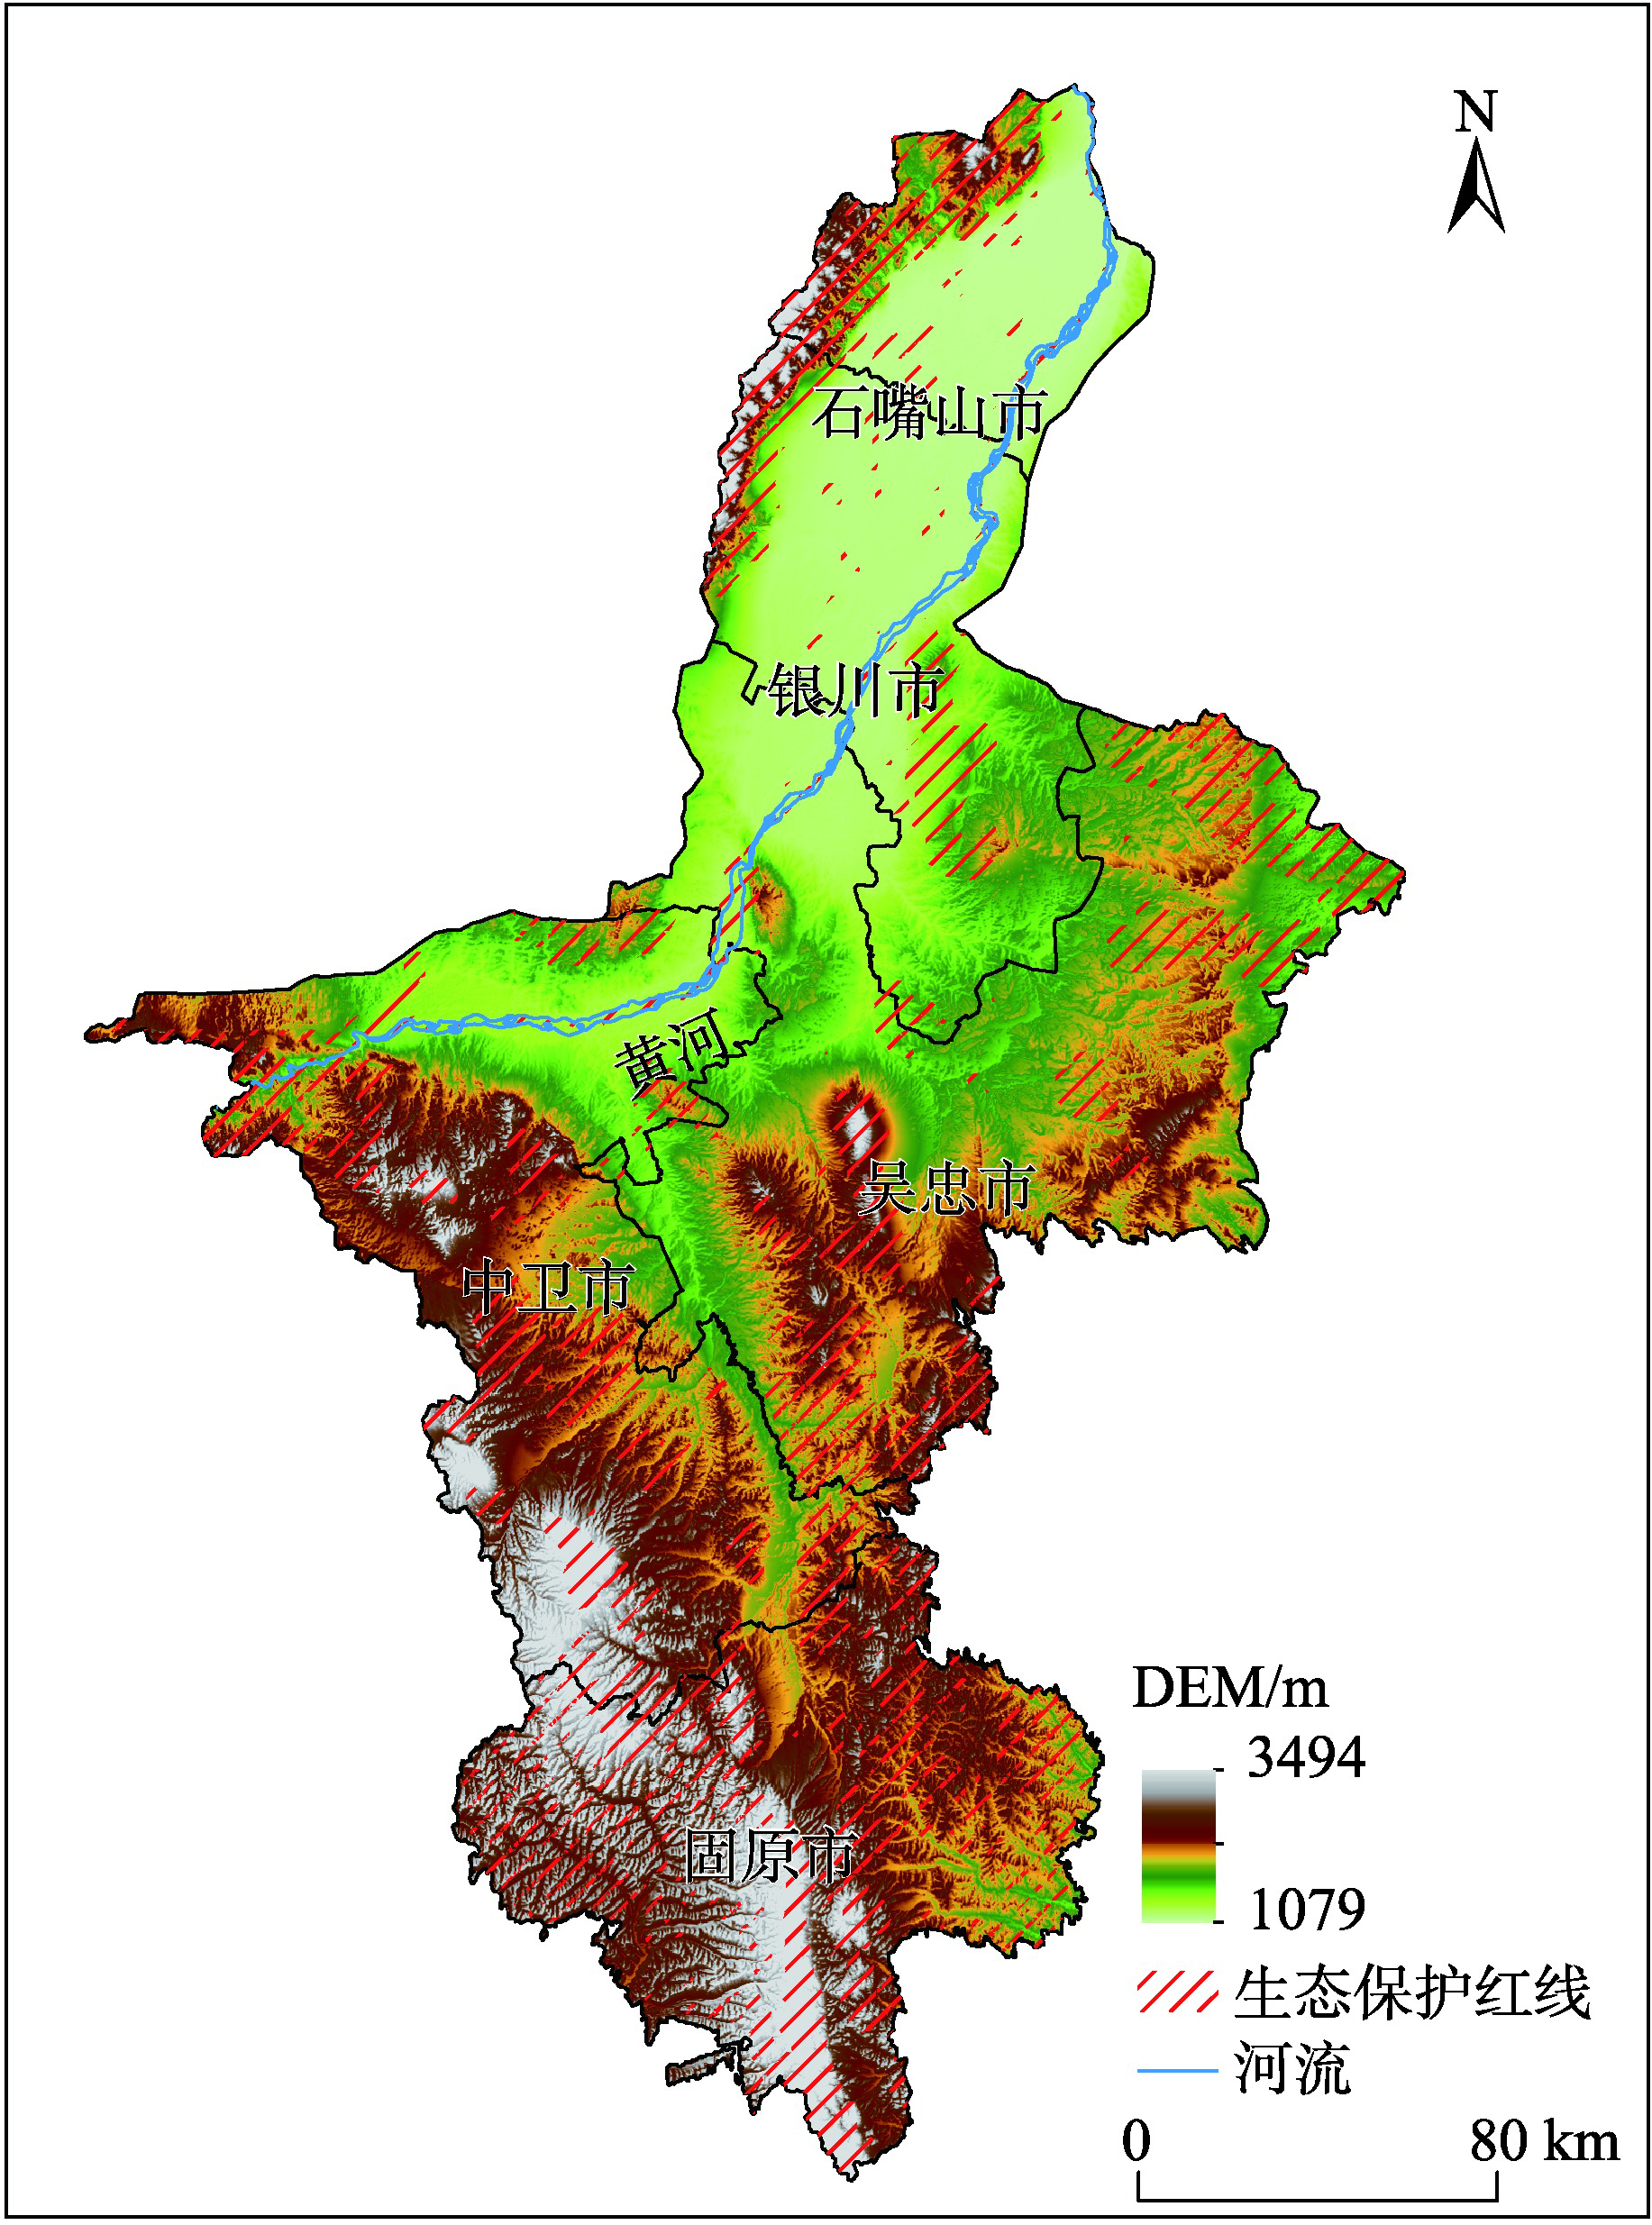
Ningxia is one of the first provinces in China that has finished the delineation of Ecological Conservation Red Line (ECRL). Nearly one fourth of Ningxia has been included in ECRL, significantly contributing to maintain the ecological security of the northern region. However, there is a lack of relevant research on the evaluation of the contribution of the ecological barrier and the protection effect of the eco-redline in Ningxia. In this paper, based on the equivalent value of Ningxia ecosystem service base and land use data at a 2-m resolution, we objectively evaluated the Ecosystem Service Value (ESV) in 2020 and its changes between 2018-2020, and analyzed the effect of the ECRL delineation. Consequently, a critical direction for ecological protection goals is emphasized for this autonomous region. Our findings include: (1) In 2020, the total natural ecological assets stock in Ningxia was 3.32 million hectares, which mainly consists of forest, grasslands, and wetlands, providing a ESV of around 88.90 billion yuan for the region. During the period of 2018—2020, there was an increase of ESV (106 million yuan); (2) The ECRL area ( one fourth of the regional area) contributed more than one third of the ESV in the entire region, and 63% of the increase in ESV during the evaluation period was attributed to the ECRL area; (3) Meadows provided 52% of ESV in the entire region, with only 31% located in ECRL area. During 2018—2020, meadow ecosystems also faced problems such as stock reduction, desertification, and degradation. Increasing the meadows ecosystem stock and quality is the key factor for the incremental value of ecosystem services; (4) It is suggested to follow the internal mechanism of ecosystem structure and process, center on the regional dominant ecological function and the characteristics of the ecosystem structure, systematically carry out ecological protection and restoration based on local conditions.
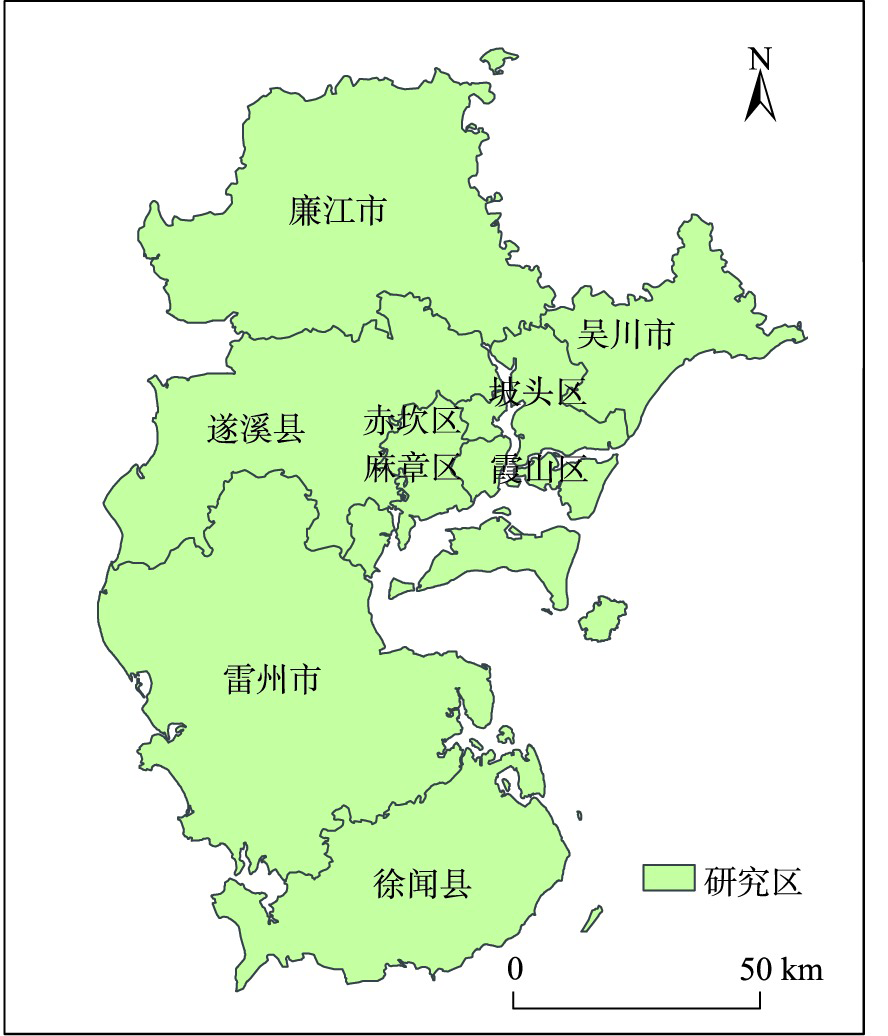
Western Guangdong is one of the three major sugarcane producing areas in China. Sugarcane in western Guangdong is mainly distributed in Zhanjiang, with more than 2 million sugarcane farmers. In 2020, the sugarcane planting area in Zhanjiang reached 130 030 hectares. Mapping sugarcane plantation and analyzing its spatiotemporal characteristics in western Guangdong are of great values for making polices in sugarcane industry, optimizing the distribution of sugarcane plantation, and promoting production efficiency. Remote sensing technology provides an efficient way to acquire land cover information. In this study, the sugarcane plantation distribution information in 2000, 2008, and 2020 was acquired based on Landsat remote sensing data and statistics data in sugarcane planting areas. Following steps were implemented: preprocessing of Normalized Difference Vegetation Index (NDVI) time series, construction of reference NDVI of sugarcane, extraction of the amplitude and the maximum of NDVI time series, and identification of sugarcane using the Time Weighted Dynamic Time Warping (TWDTW) method. The TWDTW method calculated the distance between NDVI time series of unknown pixels and sugarcane pixels, and a distance threshold was set via the statistics data to acquire the sugarcane plantation distribution. Based on the extracted distribution of sugarcane plantation, the kernel density of sugarcane distribution was calculated to analyze the spatial clustering characteristics of sugarcane planting areas. Landscape pattern indexes such as the percentage of landscape, average patch area, patch density, and aggregation index were calculated to analyze the spatial distribution characteristics of sugarcane planting patches. The topographic characteristics of sugarcane planting areas were also analyzed based on DEM data. The results showed that: ① the TWDTW model could realize sugarcane identification with high accuracy by combing remote sensing time series data and statistics data. In 2000, 2008 and 2020, the average accuracy of sugarcane mapping reached 87.62%; ② Sugarcane was mainly distributed in Suixi, Leizhou, and Xuwen in western Guangdong. The distribution of sugarcane planting in Suixi and Leizhou presented a pattern of high-density aggregation in multi centers; ③ From 2000 to 2020, the average area of sugarcane patches increased, the patch density decreased, and the aggregation index increased in Suixi and Leizhou, which indicated that the layout of sugarcane plantation had been significantly adjusted in these areas, and sugarcane production showed a trend of intensive production; ④ In Suixi and Leizhou, most of sugarcane was planted in flat areas, showing a great potential to develop mechanized production.
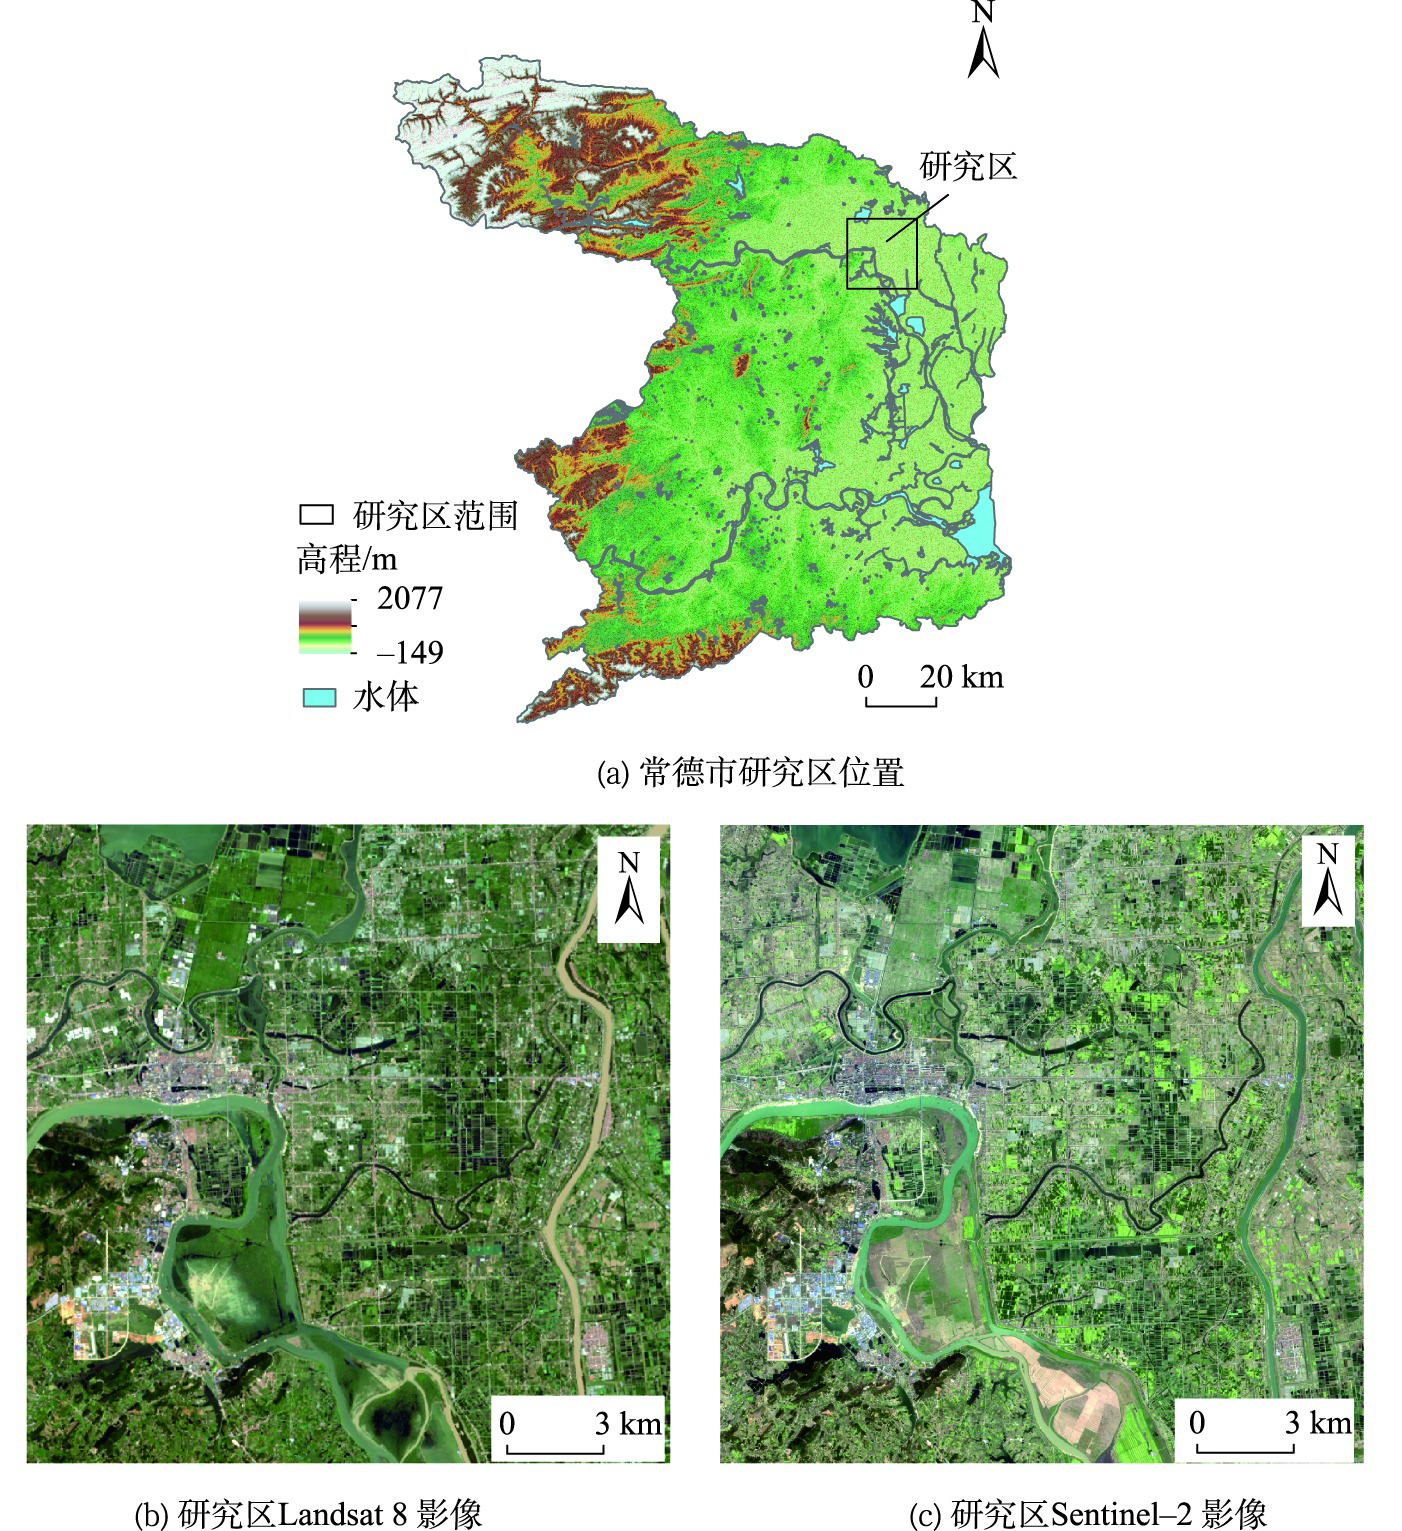
There are various reasons for the inconsistency among land cover products, such as the difficulty in determining pixel into categories at different image resolutions. The inconsistency caused by image resolution is determined by the attributes of the image itself and cannot be changed by increasing the number of samples, improving classification methods, and other measures. Especially in mountainous and hilly areas with high ground fragmentation, the resolution has a greater impact on the quality of land cover products. Therefore, taking the cultivated land of GlobeLand 30 and WorldCover products as an example, this paper introduces information entropy to analyze the consistency of multi-source land cover products. Firstly, the information entropy of different bands of the original images in the cultivated land is calculated to reflect the overall uncertainty of the cultivated land category. Secondly, the local information entropy is constructed to describe the local uncertainty of the images. Finally, the uncertainty of the two products is overlapped and the consistency is analyzed. The results show that: (1) The information entropy can reflect the uncertainty changes with more details in the cultivated land based on the spatial distribution of products, and the regional distribution of categories that are difficult to determine can also be easily detected; (2) The overall uncertainty of GlobeLand30 cultivated land with 30m resolution is greater than that of WorldCover cultivated land with 10 m resolution. The large uncertainty of the two products mainly exists in the transitional areas between cultivated land and other ground features, where there are more mixed pixels and fuzzy ground feature categories; (3) Based on the overlapped uncertainty of the two products, the uncertainty of cultivated land is relatively low in products with higher resolution and relatively high in products with lower resolution. The difference of cultivated land uncertainty caused by resolution difference are that 34.54% in blue band, 51.13% in green band, 46.03% in red band, and 61.48% in near-infrared band; (4) For areas where the spatial distribution of the two products is inconsistent, the uncertainty of GlobeLand30 product is greater, which means it is greatly affected by the resolution, while the uncertainty of WorldCover product is smaller, which means it is less affected by resolution.
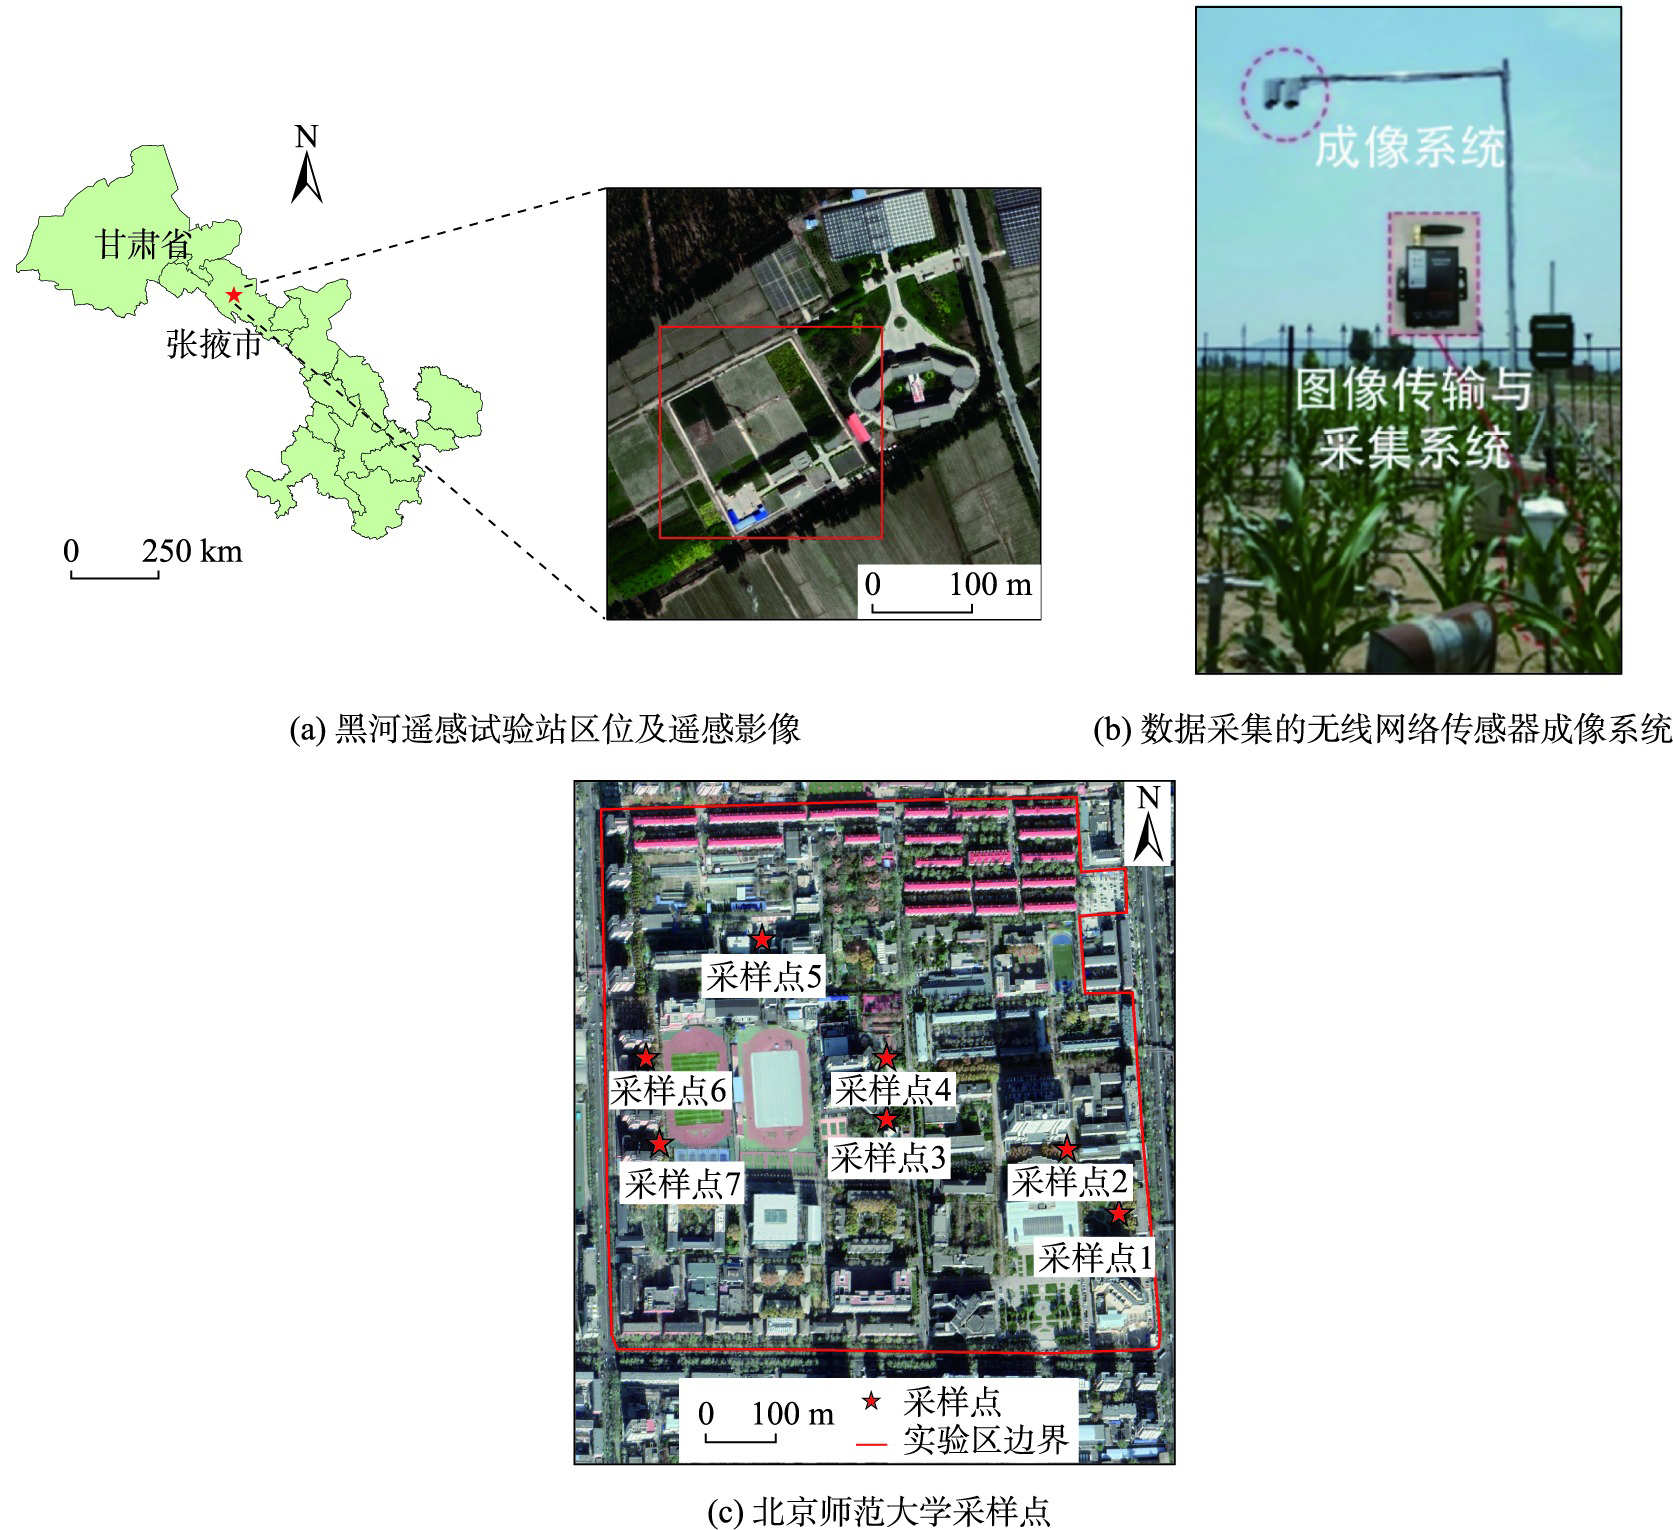
The vegetation and soil fraction in the sensor's field of viewing will be varied with different light and observation geometry, and such variation can be used by the remote sensing geometric-optical model to simulate canopy multi-angle reflectance. As a result, the four components, i.e., lit and shaded vegetation, as well as lit and shaded soil are important input parameters for the geometric-optical model. In this paper, an algorithm for extracting the four geometric-optical components with the combination of solar illumination information and multi-scale clusters derived from a k-means process was proposed. Firstly, the clustering space was formed by synthesizing a new color index, then the multi-scale image hierarchical model was constructed by using the lit and shaded component in the subgraphs of the images respectively, and then the k-means clustering was performed in the multi-scale image hierarchical model to obtain the vegetation component and soil component results. Finally, the obtained results in the above subgraphs were combined as the output to achieve the extraction of four geometric-optical components. Validation on the proposed method was conducted on fifty-two vegetation canopy images which were acquired under natural lighting conditions. We compared our results with those of OTSU threshold on ultra-green index, Fisher linear algorithm, and SHAR-LABFVC algorithm. The results showed that the proposed algorithm performed well in mapping accuracy and user accuracy in the classification of shaded components, and the highest Kappa coefficient (0.82) was achieved. Good and stable classification results were observed under the conditions of continuous changing canopy cover and solar altitude angle, and this promising result suggests that the proposed method has the potential in long-term vegetation monitoring as well as measuring vegetation four-component changes even in a single day. The advantages of this algorithm are to improve the classification accuracy of the shadow component and to solve the extraction problem of the four components under high vegetation coverage. However, reducing computational cost and thus to improve the applicability of this algorithm in complex scenes will need further efforts in the future work.
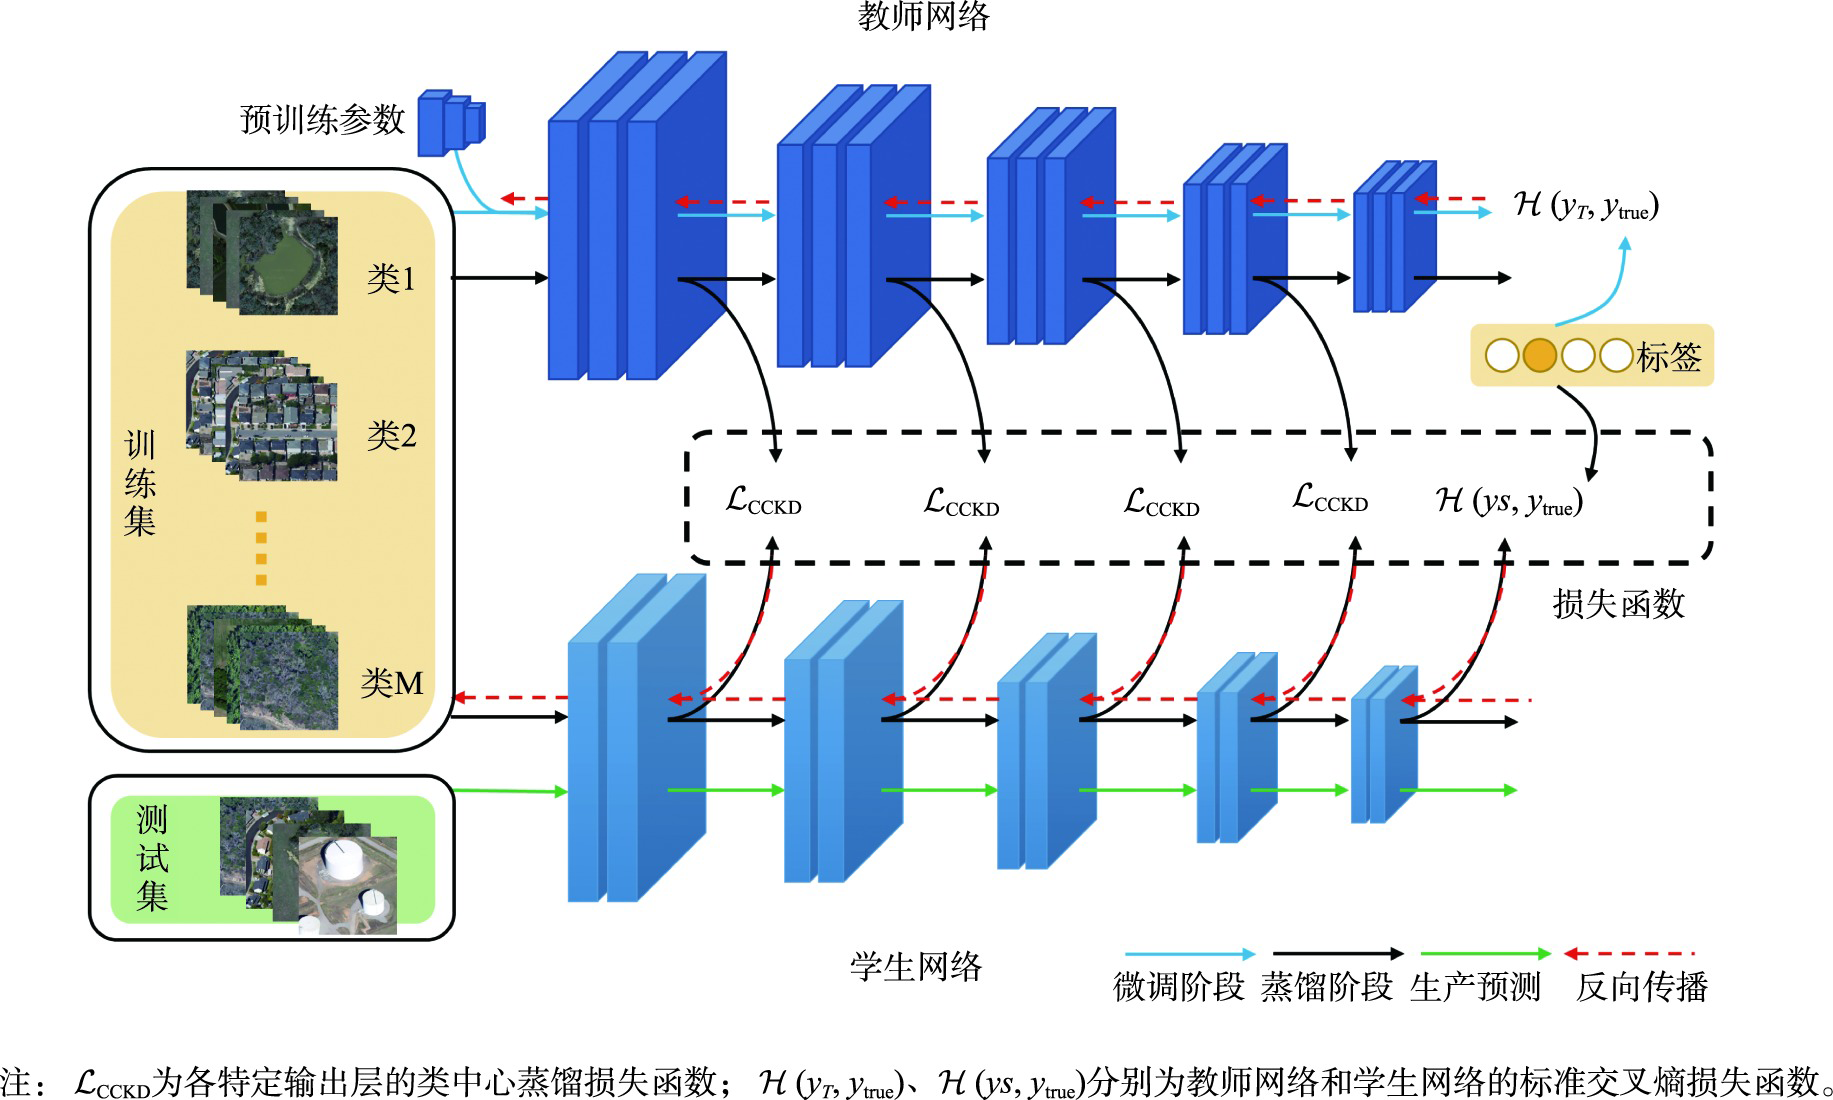
Convolutional neural networks have been widely used in the task of Remote Sensing Image Scene Classification (RSISC) and have achieved extraordinary performance. However, these excellent models have large volume and high computational cost, which cannot be deployed to resource-constrained edge devices. Moreover, in the RSISC task, the existing knowledge distillation method is directly applied to the compression model, ignoring the intra-class diversity and inter-class similarity of scene data. To this end, we propose a novel class-centric knowledge distillation method, which aims to obtain a compact, efficient, and accurate network model for RSISC. The proposed class-centric knowledge distillation framework for remote sensing image scene classification consists of two streams, teacher network flow and student network flow. Firstly, the remote sensing image scene classification dataset is sent into the teacher network pre-trained on a large-scale dataset to fine-tune the parameters. Then, the class-centric knowledge of the hidden layer is extracted from the adjusted teacher network and transferred to the student network based on the designed class center distillation loss, which is realized by constraining the distance of the distribution center of similar features extracted by the teacher and student network, so that the student network can learn the powerful feature extraction ability of the teacher network. The distillation process is combined with the truth tag supervision. Finally, the trained student network is used for scene prediction from remote sensing images alone. To evaluate the proposed method, we design a comparison experiment with eight advanced distillation methods on classical remote sensing image scene classification with different training ratios and different teacher-student architectures. Our results show that: compared to the best performance of other distillation methods, in the case of the teacher-student network belonging to the same series, the overall classification accuracy of our proposed method is increased by 1.429% and 2.74%, respectively, with a given training ratio of 80% and 60%; and in the case of teacher-student networks belonging to different series, the classification accuracy is increased by 0.238% and 0.476%, respectively, with the two given ratios. Additionally, supplementary experiments are also carried out on a small data set of RSC11 with few classes and few samples, a multi-scale data set of RSSCN7 with few classes and multiple books, and a large complex data set of AID with many classes of heterogeneous samples. The results show that the proposed method has good generalization ability. Trough the comparison experiments with similar techniques, it is found that the proposed method can maintain excellent performance in challenging categories through confusion matrix, and the proposed distillation loss function can better deal with noise through testing error curve. And visualization analysis also shows that the proposed method can effectively deal with the problems of intra-class diversity and inter-class similarity in remote sensing image scenes.
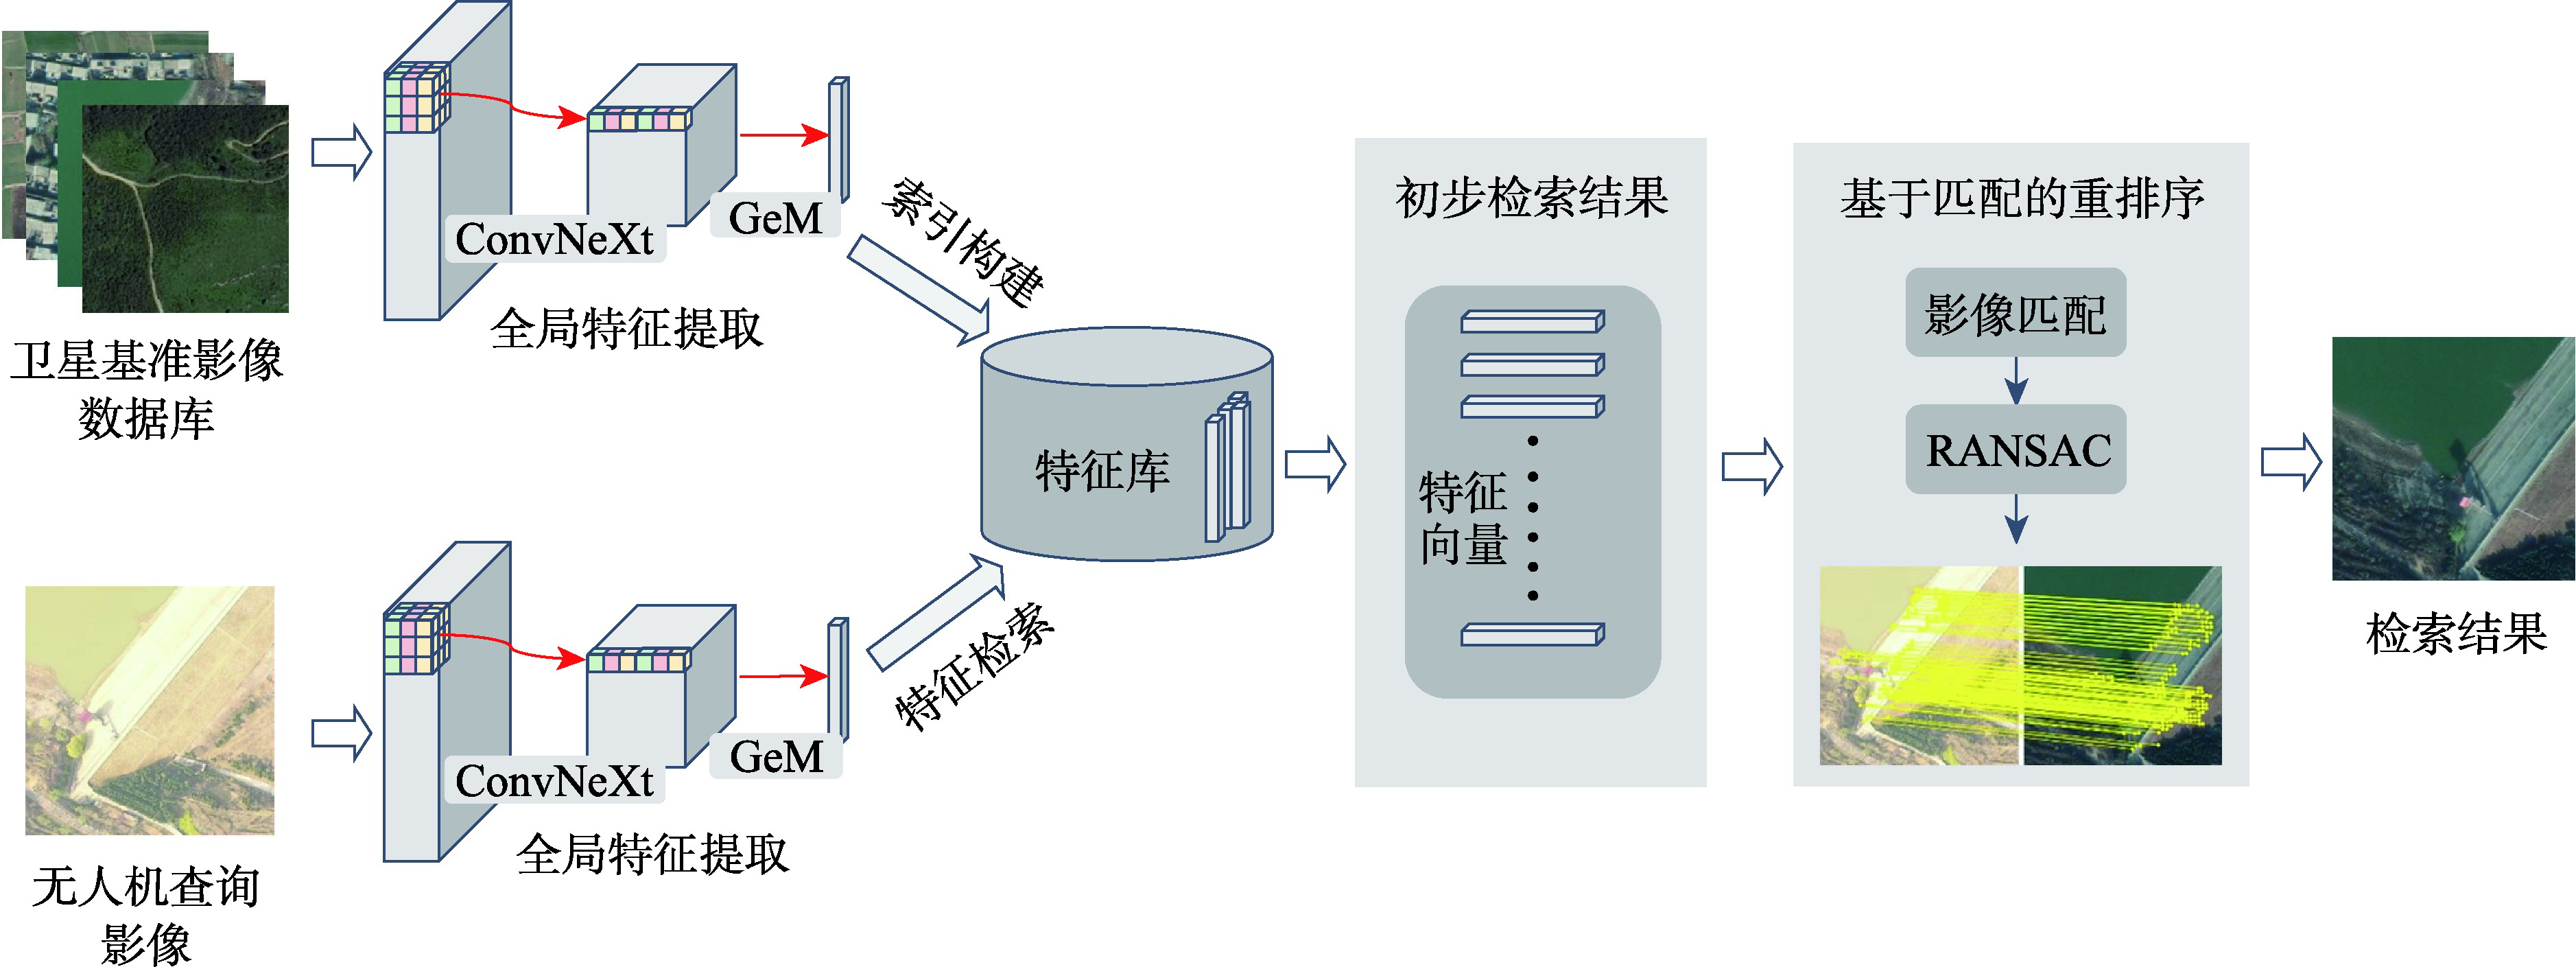
With the development of Unmanned Aerial Vehicle (UAV) technology, it has been applied to various tasks in different fields. The prerequisite for a UAV to perform successful aerial tasks is accurate localization of its own position. Generally, traditional UAV navigation relies on the Global Navigation Satellite System (GNSS) for localization. However, this system has disadvantages such as instability and susceptibility to interference, leading to situations where UAV cannot use GNSS for positioning, known as GNSS-denied environments. This study focuses on the navigation and positioning of UAV in GNSS-denied environments and proposes a UAV visual retrieval and positioning method that comprehensively utilizes local and global deep learning features of known satellite orthophotos. Specifically, ConvNeXt is used as the backbone network, combined with generalized mean pooling, to form a retrieval feature extraction algorithm for extracting global features of satellite and UAV images. A triplet loss function considering the overlapping area between images is designed for the retrieval and positioning tasks, and a corresponding training data set is established to train the feature extraction algorithm. Then, the satellite images within a certain range are retrieved according to the extracted global features, and the preliminary retrieval results are obtained. In order to further improve the accuracy of the retrieved target images, the LoFTR algorithm based on deep learning local features is used for matching and reordering. Since the LoFTR algorithm has many mismatches, RANSAC is used to screen the matching results. Experiments using the test datasets we established demonstrate that the proposed method obtains an average accuracy of 90.9% and an average time cost of 2.22 seconds for retrieving satellite images in different seasons from fully overlapped UAV simulated images. The accuracy of the UAV real image test is 87.5%, which can meet the UAV positioning requirements.
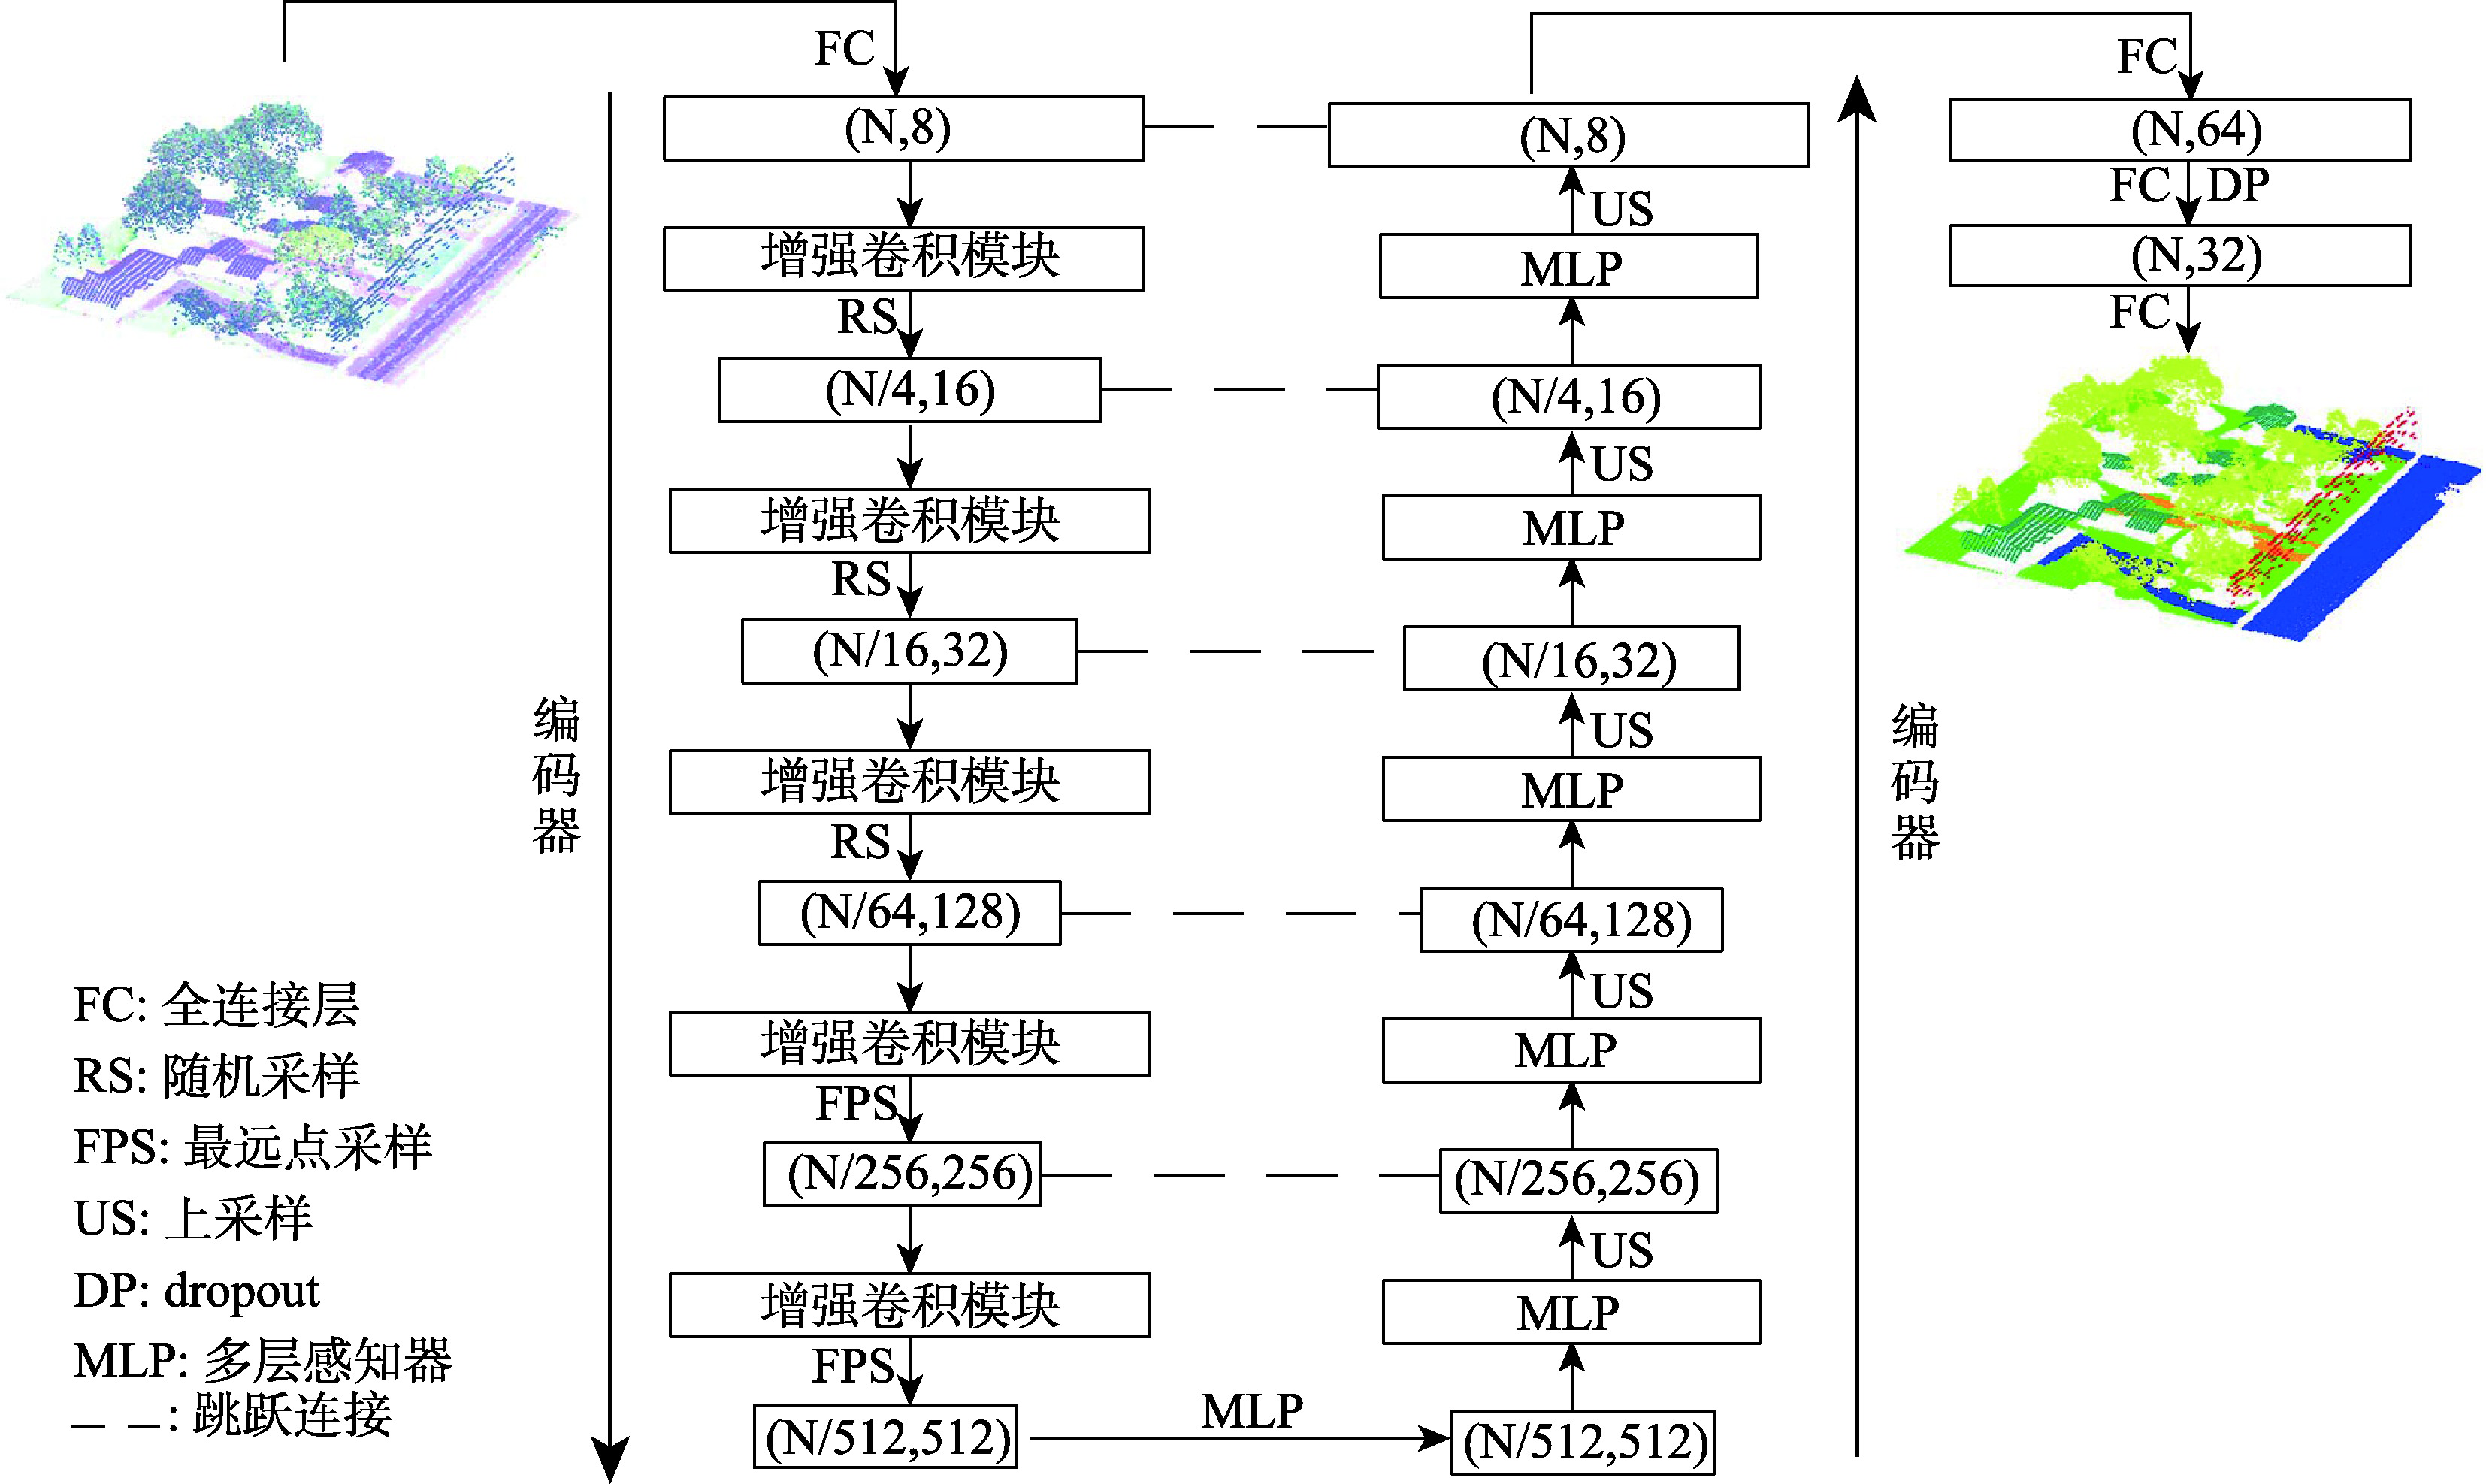
The multispectral LiDAR system can simultaneously provide the 3D space and spectral information of the target ground object, which is convenient for ground object recognition, land cover/use classification, and scene understanding. However, most multispectral LiDAR point cloud classification methods cannot fully mine the geometric information of point clouds and achieve poor performance in fine-scale classification. To overcome this limitation, this paper presents a continuous kernel point convolutional network which uses local point cloud geometric information to enhance features. Firstly, the network combines a random sampling with a farthest point sampling to quickly process large-scale multispectral LiDAR point clouds. Then, an enhanced convolution module based on continuous variable convolution is designed to improve the semantic information expression of multispectral LiDAR point cloud data. In order to address the problem that kernel point convolution simply using the distance relationship between the geometric space and feature space of neighboring points and centroids is insufficient to express the local information as a complementary feature of the kernel point convolution network, the local features given to the kernel points are enhanced by using the position relationship between neighboring points and centroids while aggregating the local features to provide richer semantic information for the multispectral LiDAR point cloud classification network. Finally, the weighted label smoothing loss and the Lovasz-Softmax loss are combined to further improve the classification performance. The results on the Titan multispectral LiDAR dataset show that the proposed network achieves an overall accuracy of 96.80%, a macro-F1 index of 88.51%, and a mIoU value of 83.42%, which is superior to the state-of-the-art (SOTA) multispectral LiDAR data networks. The proposed model uses the combination of grid sampling and KD-Tree to better preserve the geometric features of the original point cloud. In the case of a single batch of 65,536 points, the point cloud sampling time is reduced by 28 261.79 ms compared with similar multispectral LiDAR point cloud classification networks. This Study demonstrates the potential of enhanced feature kernel points convolutional network for multispectral LiDAR point cloud classification tasks.